COIT11226: Online Solar Power System Project Report, BIT, 2019

Verified

Added on  2023/01/23

|19
|2900
|87
Report
AI Summary
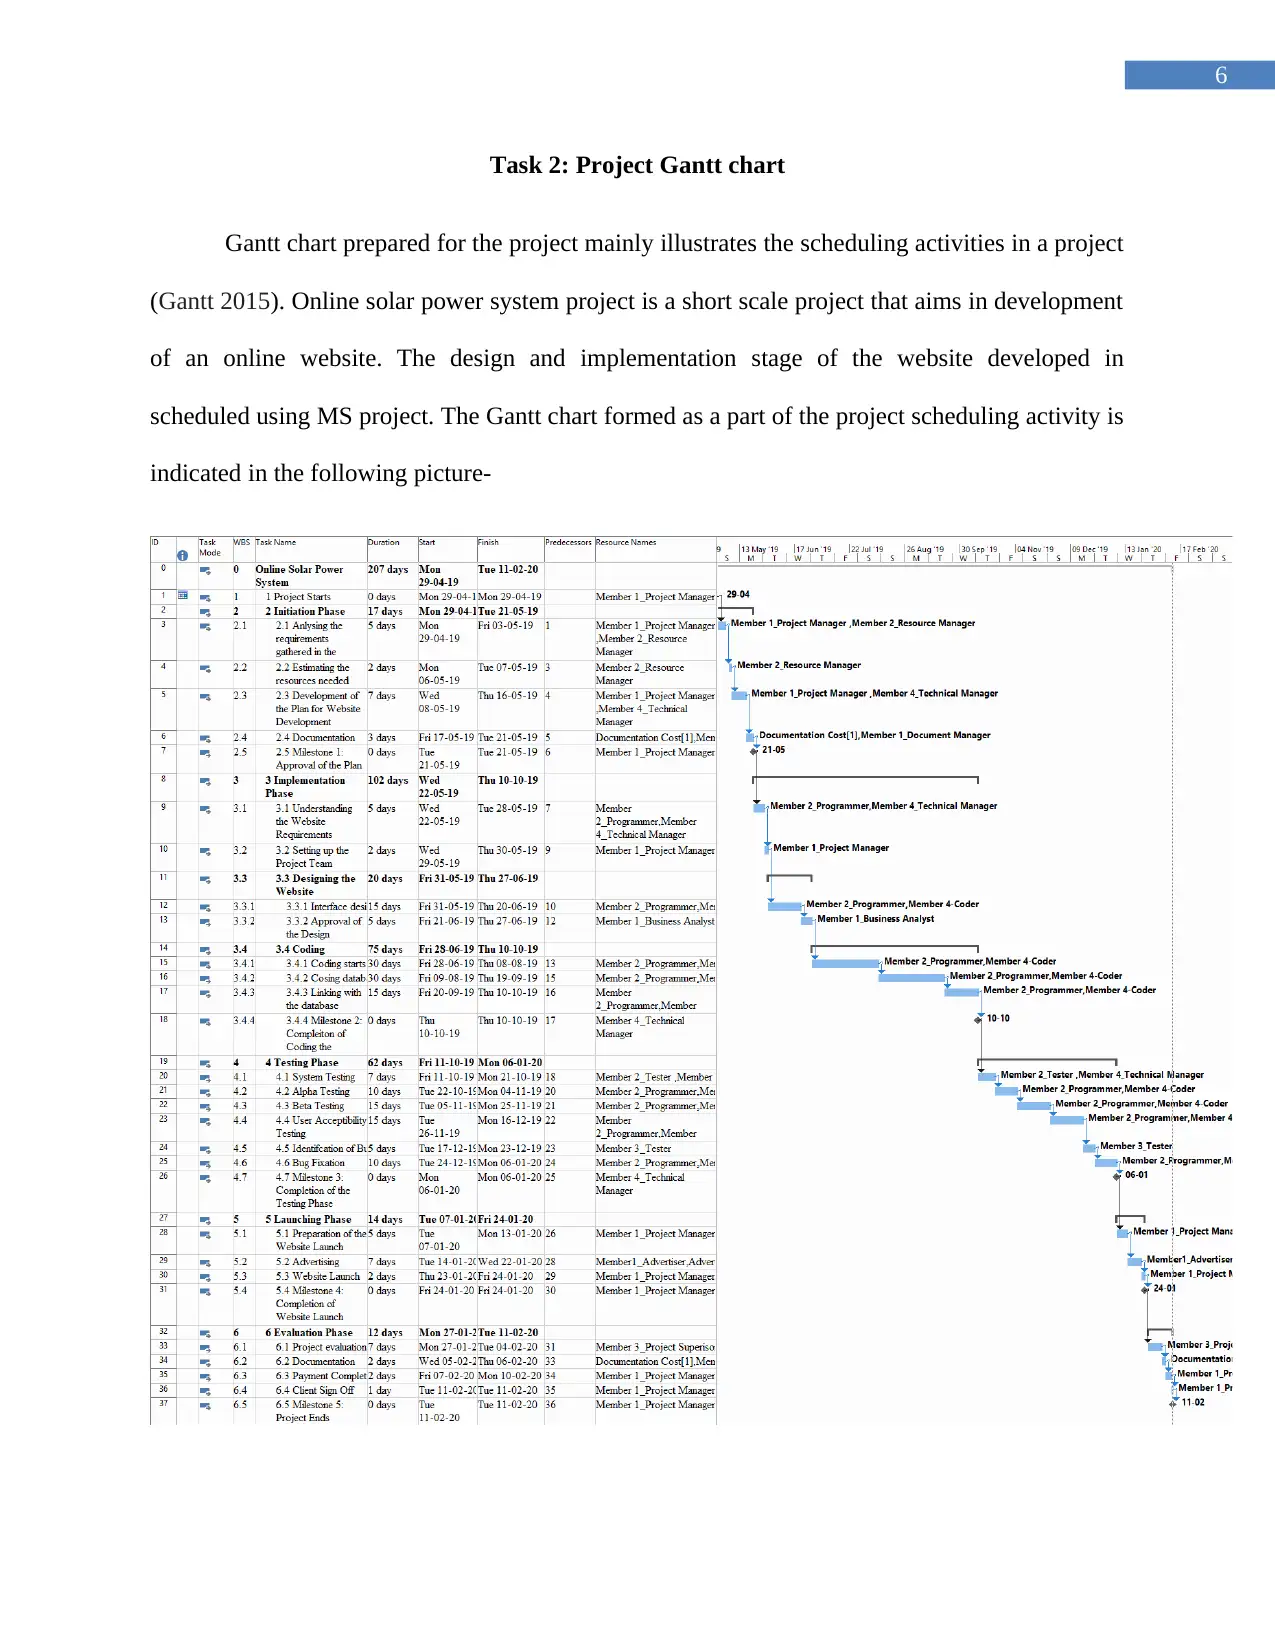
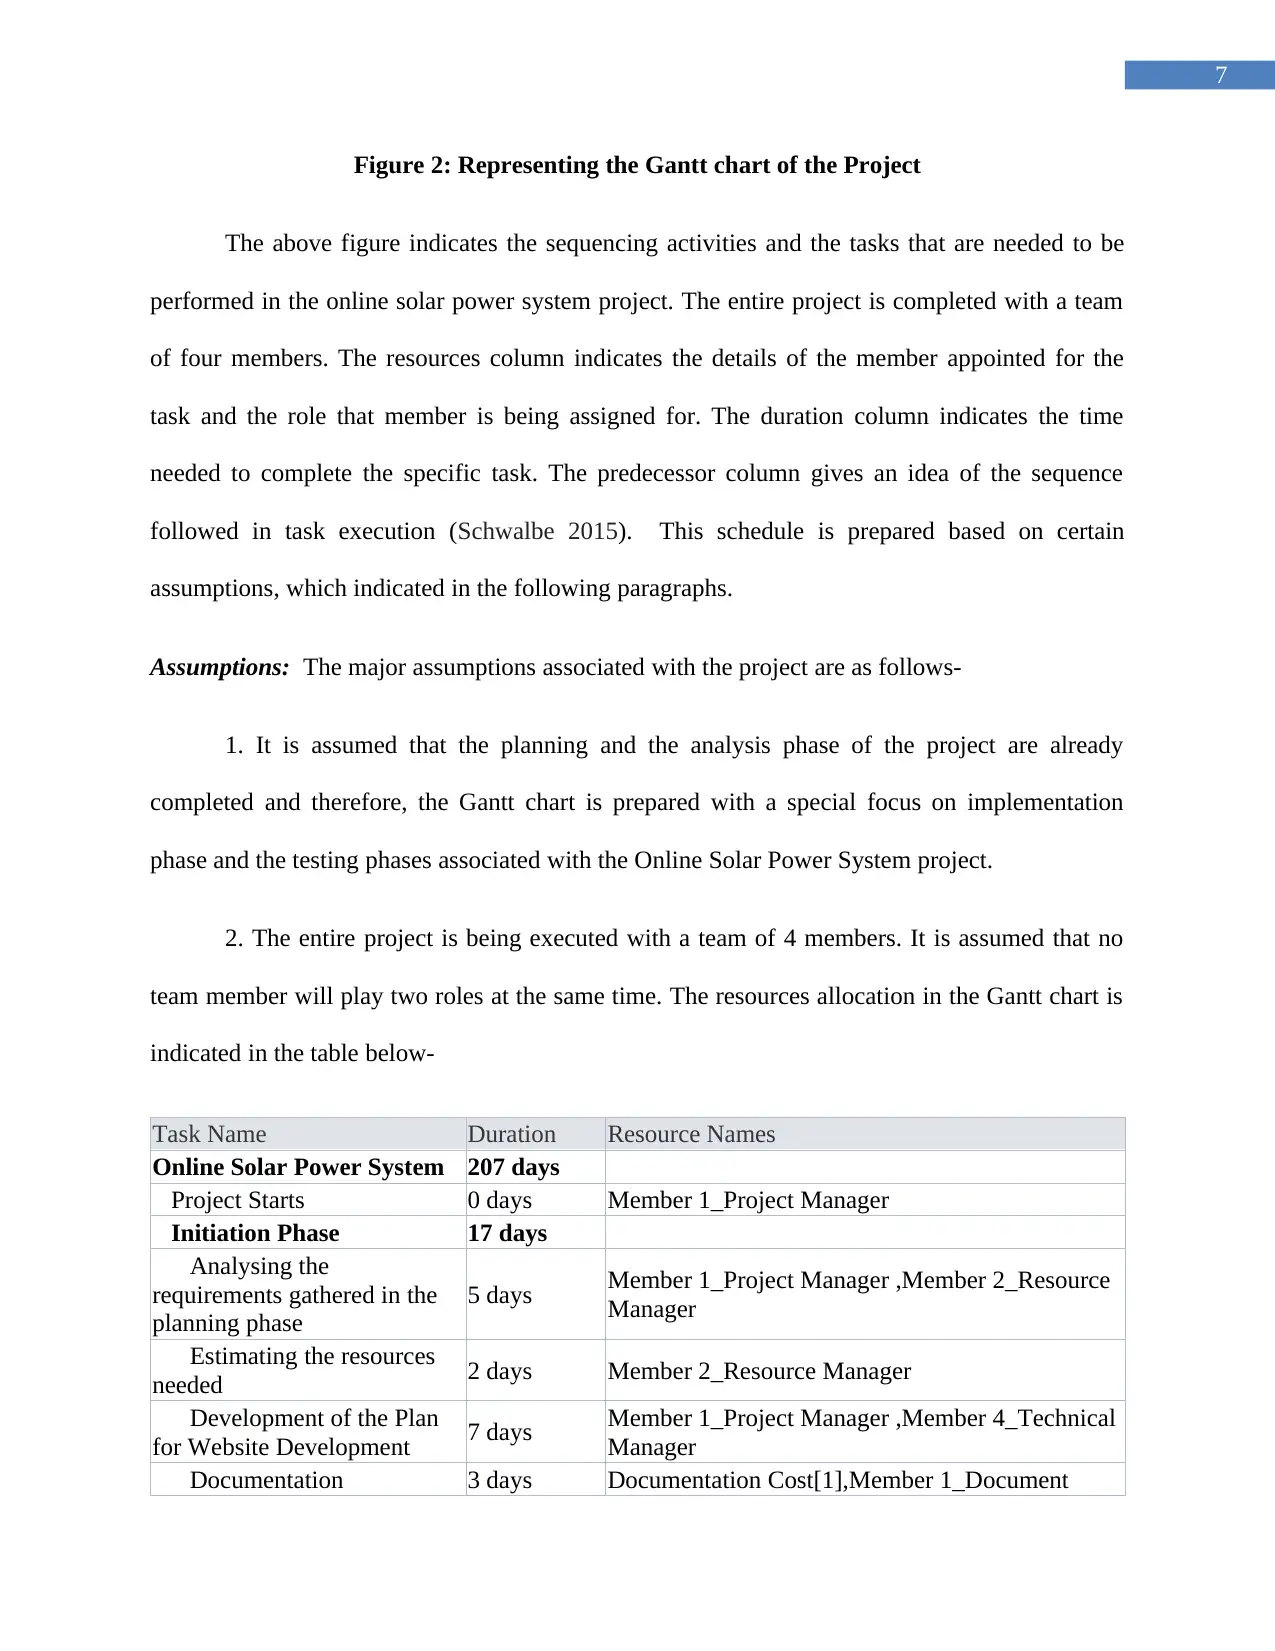
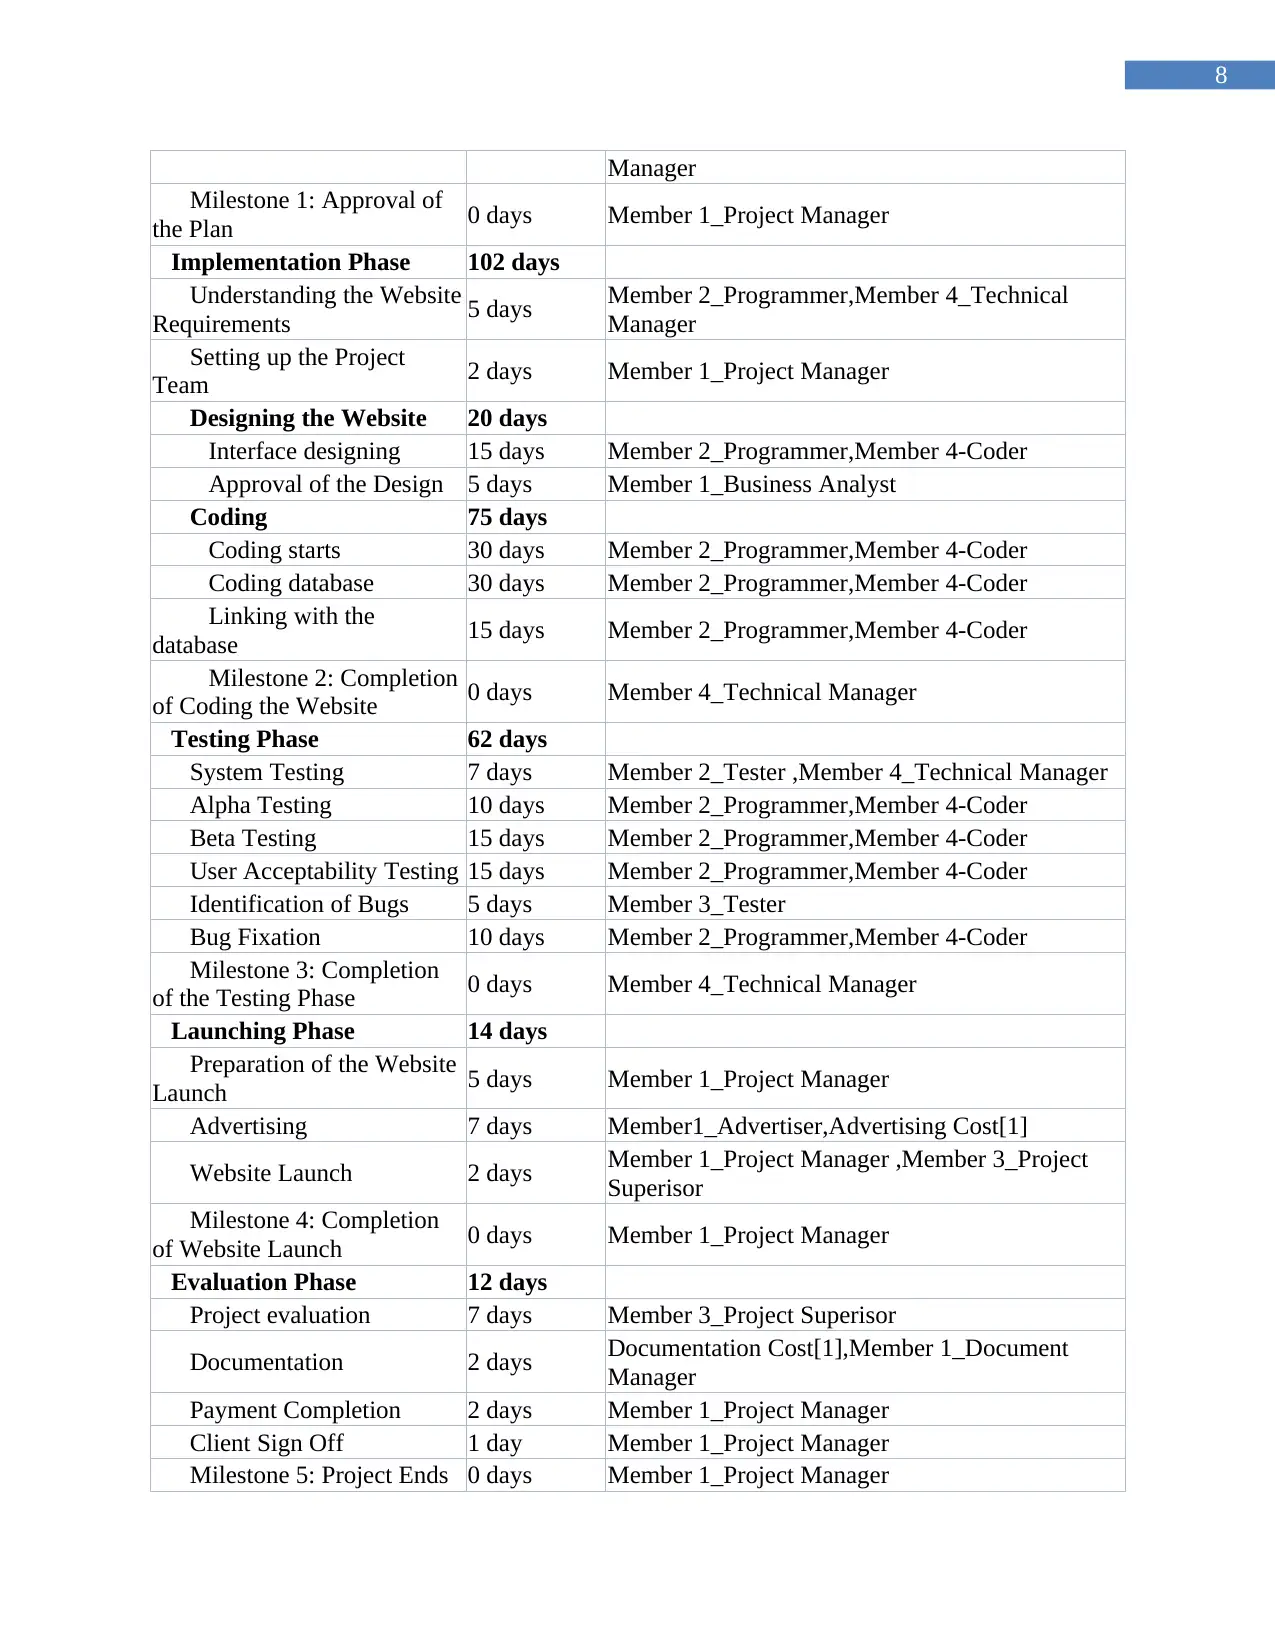
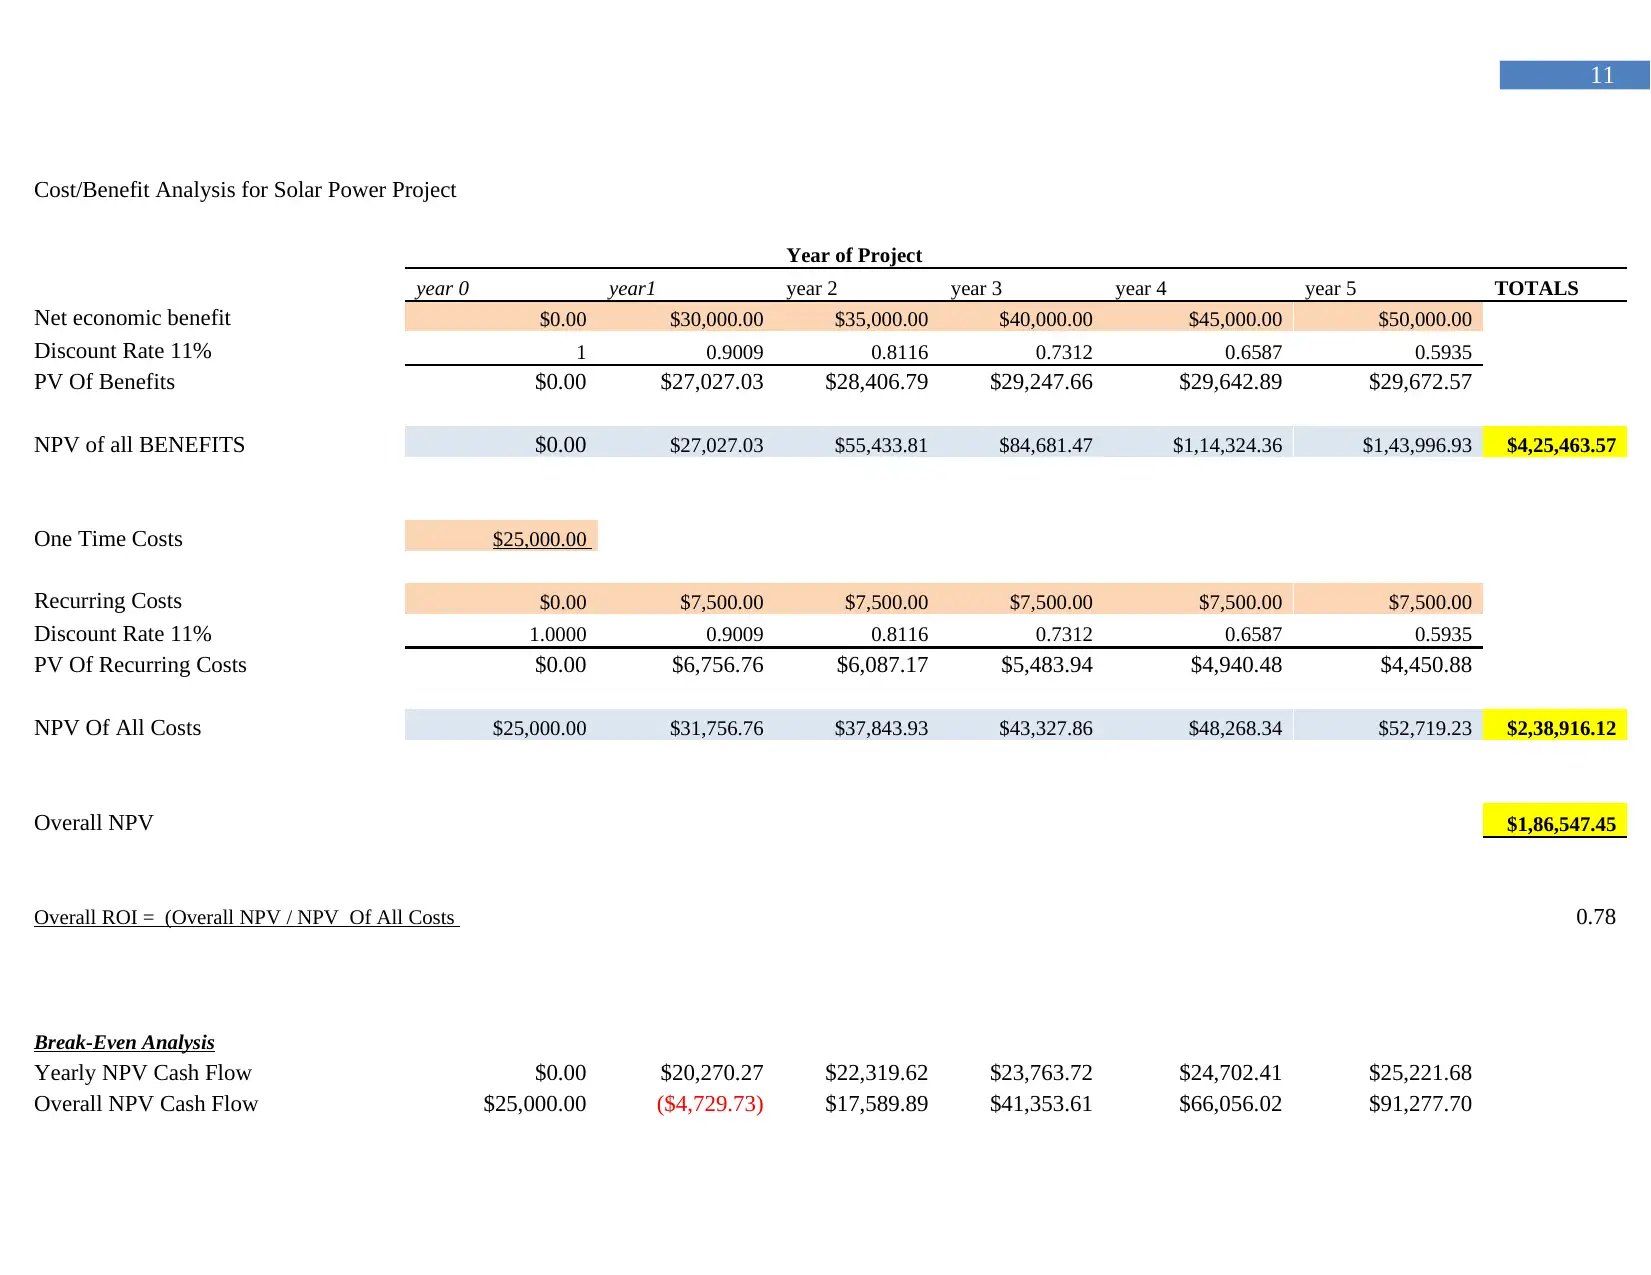
This report details an online solar power system project undertaken as part of a Bachelor of Information Technology program. It begins by comparing two system development methodologies: the Modified Waterfall Model and Extreme Programming, outlining their definitions, advantages, and disadvantages. A project Gantt chart is then presented, illustrating the scheduling activities and resource allocation for the project's implementation and testing phases. The report further delves into the economic cost feasibility of the project, including a detailed Excel-based cost-benefit analysis, break-even analysis, and return on investment (ROI) calculations. The financial analysis covers a 5-year period, with forecasted benefits, recurring costs, and the overall net present value. The break-even period is determined to be approximately 1.2 years, and the report concludes by assessing the project's value to both customers and investors, emphasizing its financial viability.
Document Page
Running head: BACHELOR OF INFORMATION TECHNOLOGY
Bachelor of Information Technology
Name of Student
Name of University
Author Note
tabler-icon-diamond-filled.svg

Paraphrase This Document

Need a fresh take? Get an instant paraphrase of this document with our AI Paraphraser
Document Page
1
Table of Contents
Task 1: System Development Methodology........................................................................2
1.1. Description of Both the Model.................................................................................2
1.1.1. Modified Waterfall Model.................................................................................2
1.1.2. Extreme Programming.......................................................................................3
1.2. Comparison between Modified Waterfall and XP....................................................4
Task 2: Project Gantt chart..................................................................................................6
Task 3: Economic Cost Feasibility/Project Budgeting......................................................10
3.1. Excel.......................................................................................................................10
3.2. Breakeven Period....................................................................................................13
3.2.1. Breakeven Period Definition...........................................................................13
3.2.2. Different types of Values Obtained from the Project......................................13
3.2.3. Values to the Customer....................................................................................14
3.3. Return on Investment..............................................................................................15
3.3.1. ROI..................................................................................................................15
3.3.2. Value of ROI in the project.............................................................................15
3.3.3. Project is worthwhile Investment....................................................................15
References..........................................................................................................................16
Document Page
2
Part B: Case Study Solar Power
Task 1: System Development Methodology
This section of the report will be identifying the system development methodology that
can be employed for designing a software system. This section of the report will be comparing
two methods of software implementation, which are modified waterfall model and extreme
programming.
1.1. Description of Both the Model
The following section provides a brief description of Modified waterfall model and
extreme programming.
1.1.1. Modified Waterfall Model
Modified waterfall model is an advanced version of the traditional waterfall model and
therefore, make use of almost similar phases as that of the pure waterfall model. A modified
waterfall model solves a number of problem that is faced by the traditional waterfall model
(Datyal 2015). The traditional waterfall model was gradually becoming redundant due to its
limitations. The modified waterfall model helps in eliminating those limitations. The phases of
modified waterfall model is indicated in the figure below-
Document Page
3
Figure 1: Representing the phases of Modified Waterfall Model
(Source: Velmourougan et al. 2014)
One of the most basis advantage of modified waterfall model is that it is quite flexible in
comparison to the traditional waterfall model.
1.1.2. Extreme Programming
Extreme Programming (XP), is an agile software development framework or process.
This particular software development method aims in producing a software of high quality
(Salah, Paige and Cairns 2014). Thus, this framework is mainly used to improve the quality and
tabler-icon-diamond-filled.svg

Paraphrase This Document

Need a fresh take? Get an instant paraphrase of this document with our AI Paraphraser
Document Page
4
the responsiveness of the software that is being developed. One of the most basic advantages of
XP is that it enables the software companies in saving a subsequent amount of cost and time
required for project implementation.
1.2. Comparison between Modified Waterfall and XP
The differences between Modified waterfall method and XP method is indicated in the
table below-
Characteristics Modified Waterfall Extreme Programming
Definition Modified waterfall make use
of same phase as that of
traditional waterfall model
It is an agile software
development process. This
approach is mainly based on
delivery of the software in
small increments (Matharu et
al. 2015).
Advantages The main advantage of
Modified waterfall model is
that the model is very simple
to use and each phase of
modified waterfall model has
specific deliverables
The main advantage of
extreme programming model
is that this particular method
is associated with small
releases that helps in delivery
of an advanced product
(Turk, France and Rumpe
2014)
Disadvantages The disadvantage of Modified The disadvantage is that, this
Document Page
5
waterfall model is that the
milestone associated with this
software development
process is quite ambiguous.
process makes it difficult to
scale up the project in
implementation of large
projects.
Document Page
6
Task 2: Project Gantt chart
Gantt chart prepared for the project mainly illustrates the scheduling activities in a project
(Gantt 2015). Online solar power system project is a short scale project that aims in development
of an online website. The design and implementation stage of the website developed in
scheduled using MS project. The Gantt chart formed as a part of the project scheduling activity is
indicated in the following picture-
tabler-icon-diamond-filled.svg

Paraphrase This Document

Need a fresh take? Get an instant paraphrase of this document with our AI Paraphraser
Document Page
7
Figure 2: Representing the Gantt chart of the Project
The above figure indicates the sequencing activities and the tasks that are needed to be
performed in the online solar power system project. The entire project is completed with a team
of four members. The resources column indicates the details of the member appointed for the
task and the role that member is being assigned for. The duration column indicates the time
needed to complete the specific task. The predecessor column gives an idea of the sequence
followed in task execution (Schwalbe 2015). This schedule is prepared based on certain
assumptions, which indicated in the following paragraphs.
Assumptions: The major assumptions associated with the project are as follows-
1. It is assumed that the planning and the analysis phase of the project are already
completed and therefore, the Gantt chart is prepared with a special focus on implementation
phase and the testing phases associated with the Online Solar Power System project.
2. The entire project is being executed with a team of 4 members. It is assumed that no
team member will play two roles at the same time. The resources allocation in the Gantt chart is
indicated in the table below-
Task Name Duration Resource Names
Online Solar Power System 207 days
Project Starts 0 days Member 1_Project Manager
Initiation Phase 17 days
Analysing the
requirements gathered in the
planning phase
5 days Member 1_Project Manager ,Member 2_Resource
Manager
Estimating the resources
needed 2 days Member 2_Resource Manager
Development of the Plan
for Website Development 7 days Member 1_Project Manager ,Member 4_Technical
Manager
Documentation 3 days Documentation Cost[1],Member 1_Document
Document Page
8
Manager
Milestone 1: Approval of
the Plan 0 days Member 1_Project Manager
Implementation Phase 102 days
Understanding the Website
Requirements 5 days Member 2_Programmer,Member 4_Technical
Manager
Setting up the Project
Team 2 days Member 1_Project Manager
Designing the Website 20 days
Interface designing 15 days Member 2_Programmer,Member 4-Coder
Approval of the Design 5 days Member 1_Business Analyst
Coding 75 days
Coding starts 30 days Member 2_Programmer,Member 4-Coder
Coding database 30 days Member 2_Programmer,Member 4-Coder
Linking with the
database 15 days Member 2_Programmer,Member 4-Coder
Milestone 2: Completion
of Coding the Website 0 days Member 4_Technical Manager
Testing Phase 62 days
System Testing 7 days Member 2_Tester ,Member 4_Technical Manager
Alpha Testing 10 days Member 2_Programmer,Member 4-Coder
Beta Testing 15 days Member 2_Programmer,Member 4-Coder
User Acceptability Testing 15 days Member 2_Programmer,Member 4-Coder
Identification of Bugs 5 days Member 3_Tester
Bug Fixation 10 days Member 2_Programmer,Member 4-Coder
Milestone 3: Completion
of the Testing Phase 0 days Member 4_Technical Manager
Launching Phase 14 days
Preparation of the Website
Launch 5 days Member 1_Project Manager
Advertising 7 days Member1_Advertiser,Advertising Cost[1]
Website Launch 2 days Member 1_Project Manager ,Member 3_Project
Superisor
Milestone 4: Completion
of Website Launch 0 days Member 1_Project Manager
Evaluation Phase 12 days
Project evaluation 7 days Member 3_Project Superisor
Documentation 2 days Documentation Cost[1],Member 1_Document
Manager
Payment Completion 2 days Member 1_Project Manager
Client Sign Off 1 day Member 1_Project Manager
Milestone 5: Project Ends 0 days Member 1_Project Manager
Document Page
9
The above table indicates that no team members are playing more than one role at a time.
It is assumed that the tasks are executed in a sequential manner to eliminate the issues of
resource clash.
3. It is assumed that the coding phase of the website will involve the specification of
automatic report generation within the system.
4. A calendar of 5 working days a week and 8 hours working time is assumed in
preparation of the Gantt chart.
tabler-icon-diamond-filled.svg

Paraphrase This Document

Need a fresh take? Get an instant paraphrase of this document with our AI Paraphraser
Document Page
10
Task 3: Economic Cost Feasibility/Project Budgeting
3.1. Excel
The Online solar power system project deals with development of an online website that
will link the potential customers to the services offered by Bob Sparks. The initial investment
cost of the project $25,000 and the recurring cost of the project is $7,500. A financial analysis of
the project has been estimated with an expected discount rate of 11%. The time period for
estimation of the business case is 5-Year period. The forecasted benefits that is assumed for this
project is $30,000, $35,000, $40,000, $45,000 and $50,000 throughout the period of 5 years. The
cost benefit analysis of the project is indicated in the table below-
Document Page
11
Cost/Benefit Analysis for Solar Power Project
Year of Project
year 0 year1 year 2 year 3 year 4 year 5 TOTALS
Net economic benefit $0.00 $30,000.00 $35,000.00 $40,000.00 $45,000.00 $50,000.00
Discount Rate 11% 1 0.9009 0.8116 0.7312 0.6587 0.5935
PV Of Benefits $0.00 $27,027.03 $28,406.79 $29,247.66 $29,642.89 $29,672.57
NPV of all BENEFITS $0.00 $27,027.03 $55,433.81 $84,681.47 $1,14,324.36 $1,43,996.93 $4,25,463.57
One Time Costs $25,000.00
Recurring Costs $0.00 $7,500.00 $7,500.00 $7,500.00 $7,500.00 $7,500.00
Discount Rate 11% 1.0000 0.9009 0.8116 0.7312 0.6587 0.5935
PV Of Recurring Costs $0.00 $6,756.76 $6,087.17 $5,483.94 $4,940.48 $4,450.88
NPV Of All Costs $25,000.00 $31,756.76 $37,843.93 $43,327.86 $48,268.34 $52,719.23 $2,38,916.12
Overall NPV $1,86,547.45
Overall ROI = (Overall NPV / NPV Of All Costs 0.78
Break-Even Analysis
Yearly NPV Cash Flow $0.00 $20,270.27 $22,319.62 $23,763.72 $24,702.41 $25,221.68
Overall NPV Cash Flow $25,000.00 ($4,729.73) $17,589.89 $41,353.61 $66,056.02 $91,277.70
chevron_up_icon
1 out of 19
circle_padding
hide_on_mobile
zoom_out_icon