Bacterial Forensics: PCR and Gel Electrophoresis Analysis
VerifiedAdded on 2023/05/28
|7
|2229
|394
AI Summary
This article discusses the use of PCR and gel electrophoresis in forensic analysis, specifically in a case study on bacterial forensics. It explains the steps involved in PCR and gel electrophoresis analysis and how they were used to identify the source of food poisoning. The article also highlights the importance of PCR in forensic research and genetic typing methods.
Contribute Materials
Your contribution can guide someone’s learning journey. Share your
documents today.
1CASE STUDY ON BACTERIAL FORENSICS
Aim of the Project
The purpose of this exercise is to analyse the three samples and identify the source that
matches the sample taken from the affected player (marked as Victim) that has been provided
with. The food samples may be marked as X, Y and Z and we will use these nomenclature
throughout our investigation report. The method to be adopted for this identification process
is the method known as polymerase chain reaction (PCR). For each of the four samples, PCR
amplification of specific target sequence from genomic DNA will be performed and the
amplified product will be analysed by agarose gel electrophoresis.
The Importance of PCR in Forensic Analysis
2
The invention of PCR 1 has given leads to the development of various forensic genetic typing
methods. PCR can be utilised as a tool in DNA fingerprinting that recognise an individual
from millions of others. For illustration, small DNA samples isolated from the scene of
crime can be compared with DNA obtained from suspects. Such methods can identify or rule
out suspects amid a police investigation.2 The variations in DNA markers 3 like SNPs,
VNTRs, microsatellites, short tandem repeats (STRs), interspaced DNA transposons and
other repetitive elements4 are considered for distinguishing different persons which became
the basis of forensic research 5. Most laboratories uses STRs and VNTRs as inputs to
investigate with PCR-based methods like AFLP, CAPs etc.
PCR is crucial for the sensitivity of SNP typing systems 5. The main advantage of PCR in
forensic analysis is that scientists use the concept to make copies or amplify regions of the
genome that vary widely between different individuals . By comparing the length of different
variable number tandem repeats (VNTRs) they can determine whether the sample matches
with the DNA of the suspect.
1
21 Kary Mullis, ‘Specific enzymatic amplification of DNA in vitro: the polymerase chain reaction.’ Cold Spring Harbor
symposia on quantitative biology (1986) 51, 263–273.
2 Peter Gill ,’An assessment of the utility of single nucleotide polymorphisms (SNPs) for forensic purposes’. Int. J. Legal
Med (2001) ,.114, 204–210
3 Bruce Budowle ,’ Analysis of the VNTR locus D1S80 by the PCR followed by high-resolution PAGE.’(1991), Am. J.
Hum. Genet . 48, 137–144
4 Colin Kimpton and others ‘Automated DNA profiling employing multiplex amplification of short tandem repeat loci PCR
Methods Appl.’,International Journal of Legal Medicine (1993) 3, 13–22.
5 Analysis of Specific Bacteria from Environmental Samples using a Quantitative Polymerase Chain Reaction Curr. Issues
Mol. Biol. 4: 13-18 , 2002
Secure Best Marks with AI Grader
Need help grading? Try our AI Grader for instant feedback on your assignments.
Polymerase chain reaction (PCR) is a laboratory process for amplifying6 a particular
region of DNA.7 The DNA polymerase, template DNA, Mgcl2, two primers (forward and
reverse) and dNTPs are reaction mixtures of a PCR that are mixed and executed a number
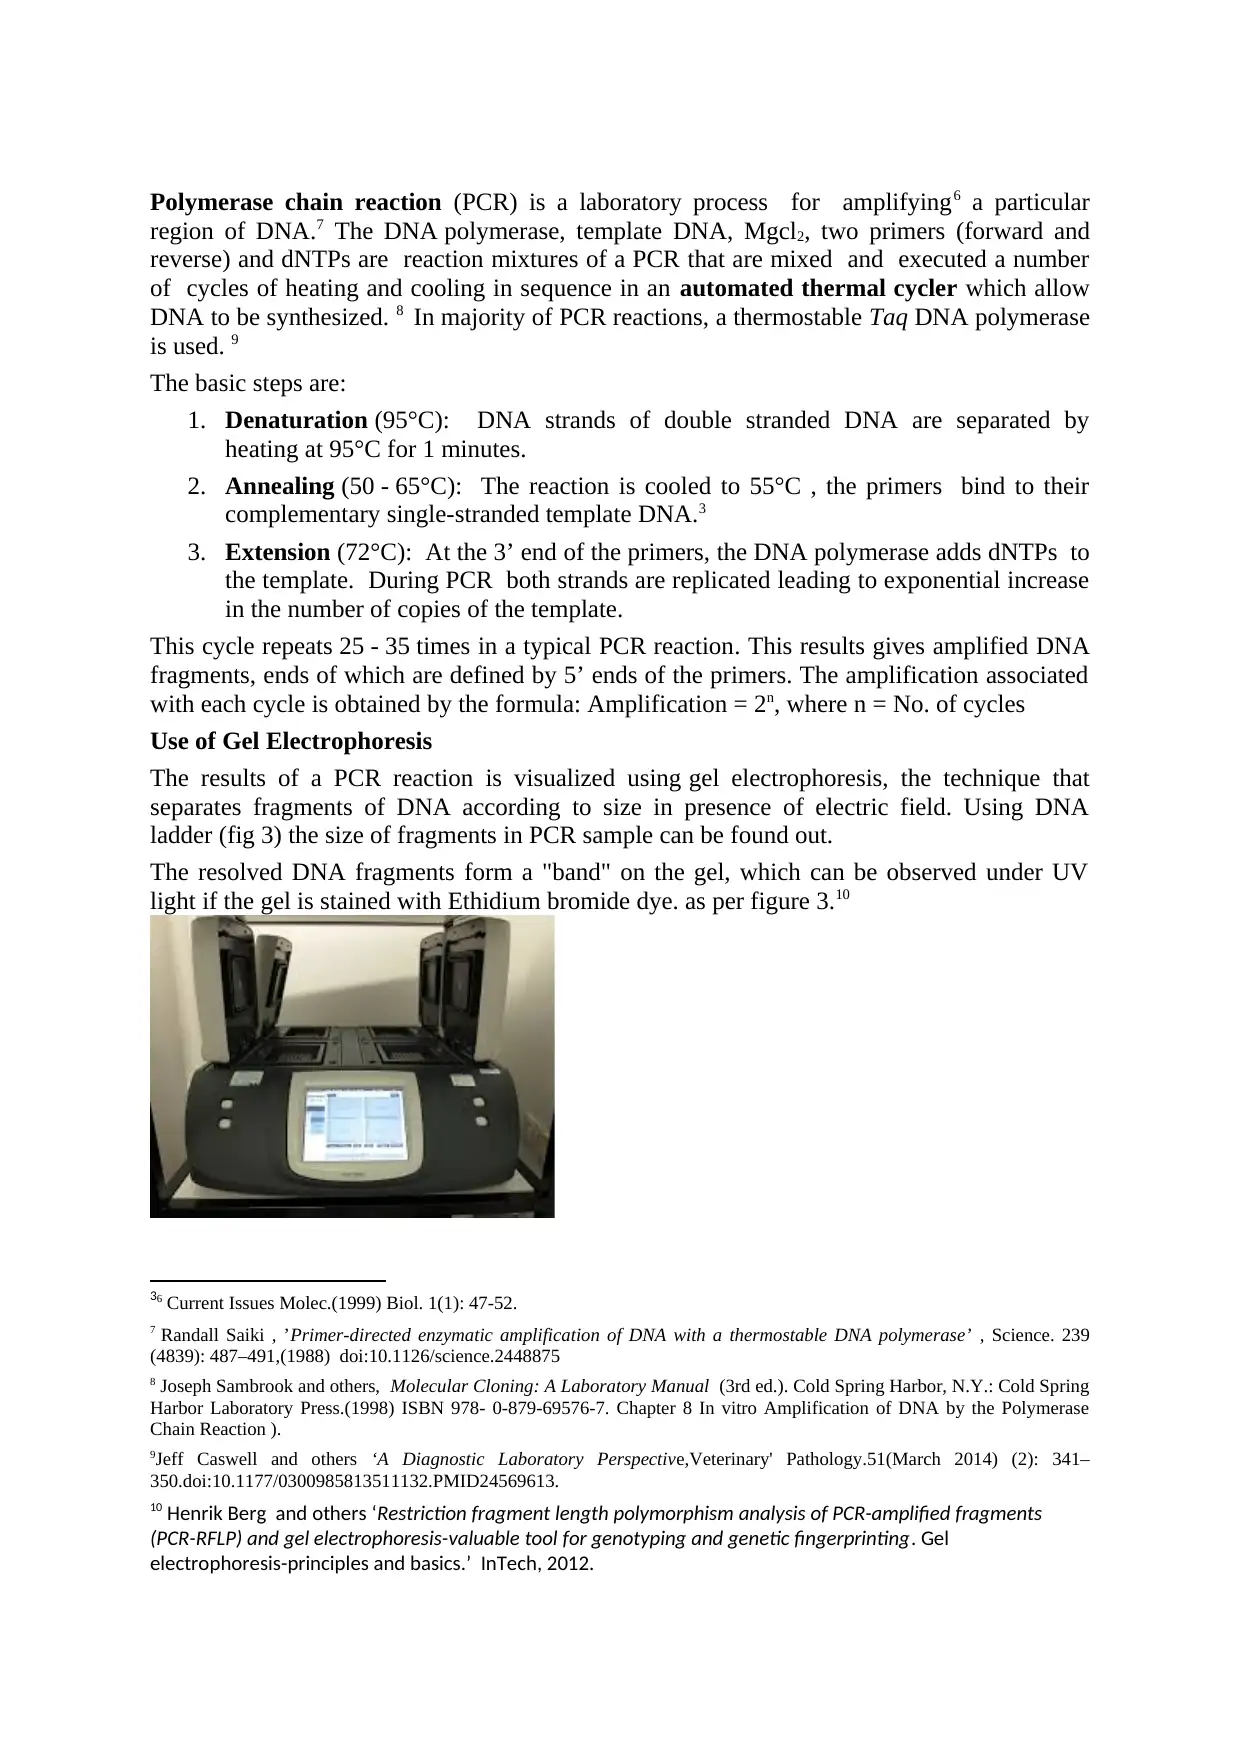
of cycles of heating and cooling in sequence in an automated thermal cycler which allow
DNA to be synthesized. 8 In majority of PCR reactions, a thermostable Taq DNA polymerase
is used. 9
The basic steps are:
1. Denaturation (95°C): DNA strands of double stranded DNA are separated by
heating at 95°C for 1 minutes.
2. Annealing (50 - 65°C): The reaction is cooled to 55°C , the primers bind to their
complementary single-stranded template DNA.3
3. Extension (72°C): At the 3’ end of the primers, the DNA polymerase adds dNTPs to
the template. During PCR both strands are replicated leading to exponential increase
in the number of copies of the template.
This cycle repeats 25 - 35 times in a typical PCR reaction. This results gives amplified DNA
fragments, ends of which are defined by 5’ ends of the primers. The amplification associated
with each cycle is obtained by the formula: Amplification = 2n, where n = No. of cycles
Use of Gel Electrophoresis
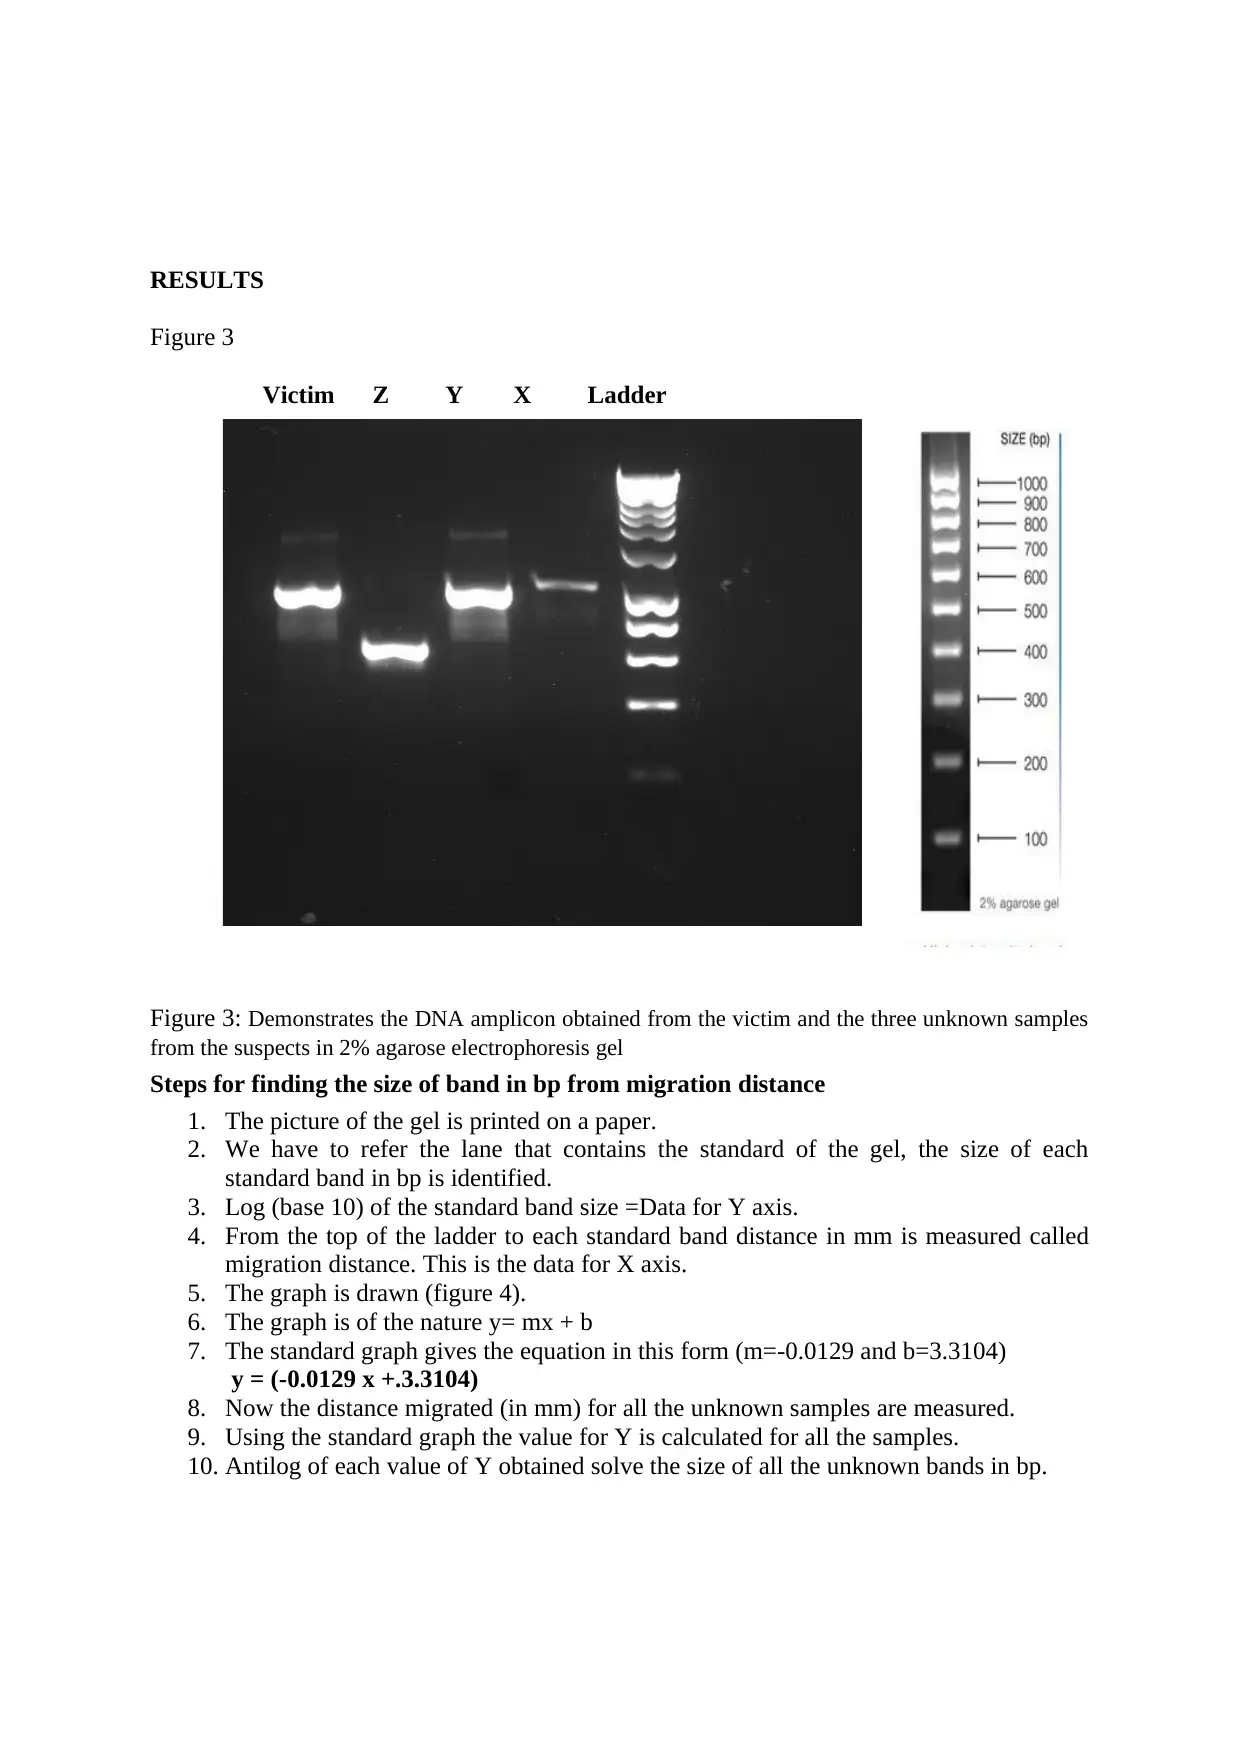
The results of a PCR reaction is visualized using gel electrophoresis, the technique that
separates fragments of DNA according to size in presence of electric field. Using DNA
ladder (fig 3) the size of fragments in PCR sample can be found out.
The resolved DNA fragments form a "band" on the gel, which can be observed under UV
light if the gel is stained with Ethidium bromide dye. as per figure 3.10
36 Current Issues Molec.(1999) Biol. 1(1): 47-52.
7 Randall Saiki , ’Primer-directed enzymatic amplification of DNA with a thermostable DNA polymerase’ , Science. 239
(4839): 487–491,(1988) doi:10.1126/science.2448875
8 Joseph Sambrook and others, Molecular Cloning: A Laboratory Manual (3rd ed.). Cold Spring Harbor, N.Y.: Cold Spring
Harbor Laboratory Press.(1998) ISBN 978- 0-879-69576-7. Chapter 8 In vitro Amplification of DNA by the Polymerase
Chain Reaction ).
9Jeff Caswell and others ‘A Diagnostic Laboratory Perspective,Veterinary' Pathology.51(March 2014) (2): 341–
350.doi:10.1177/0300985813511132.PMID24569613.
10 Henrik Berg and others ‘Restriction fragment length polymorphism analysis of PCR-amplified fragments
(PCR-RFLP) and gel electrophoresis-valuable tool for genotyping and genetic fingerprinting. Gel
electrophoresis-principles and basics.’ InTech, 2012.
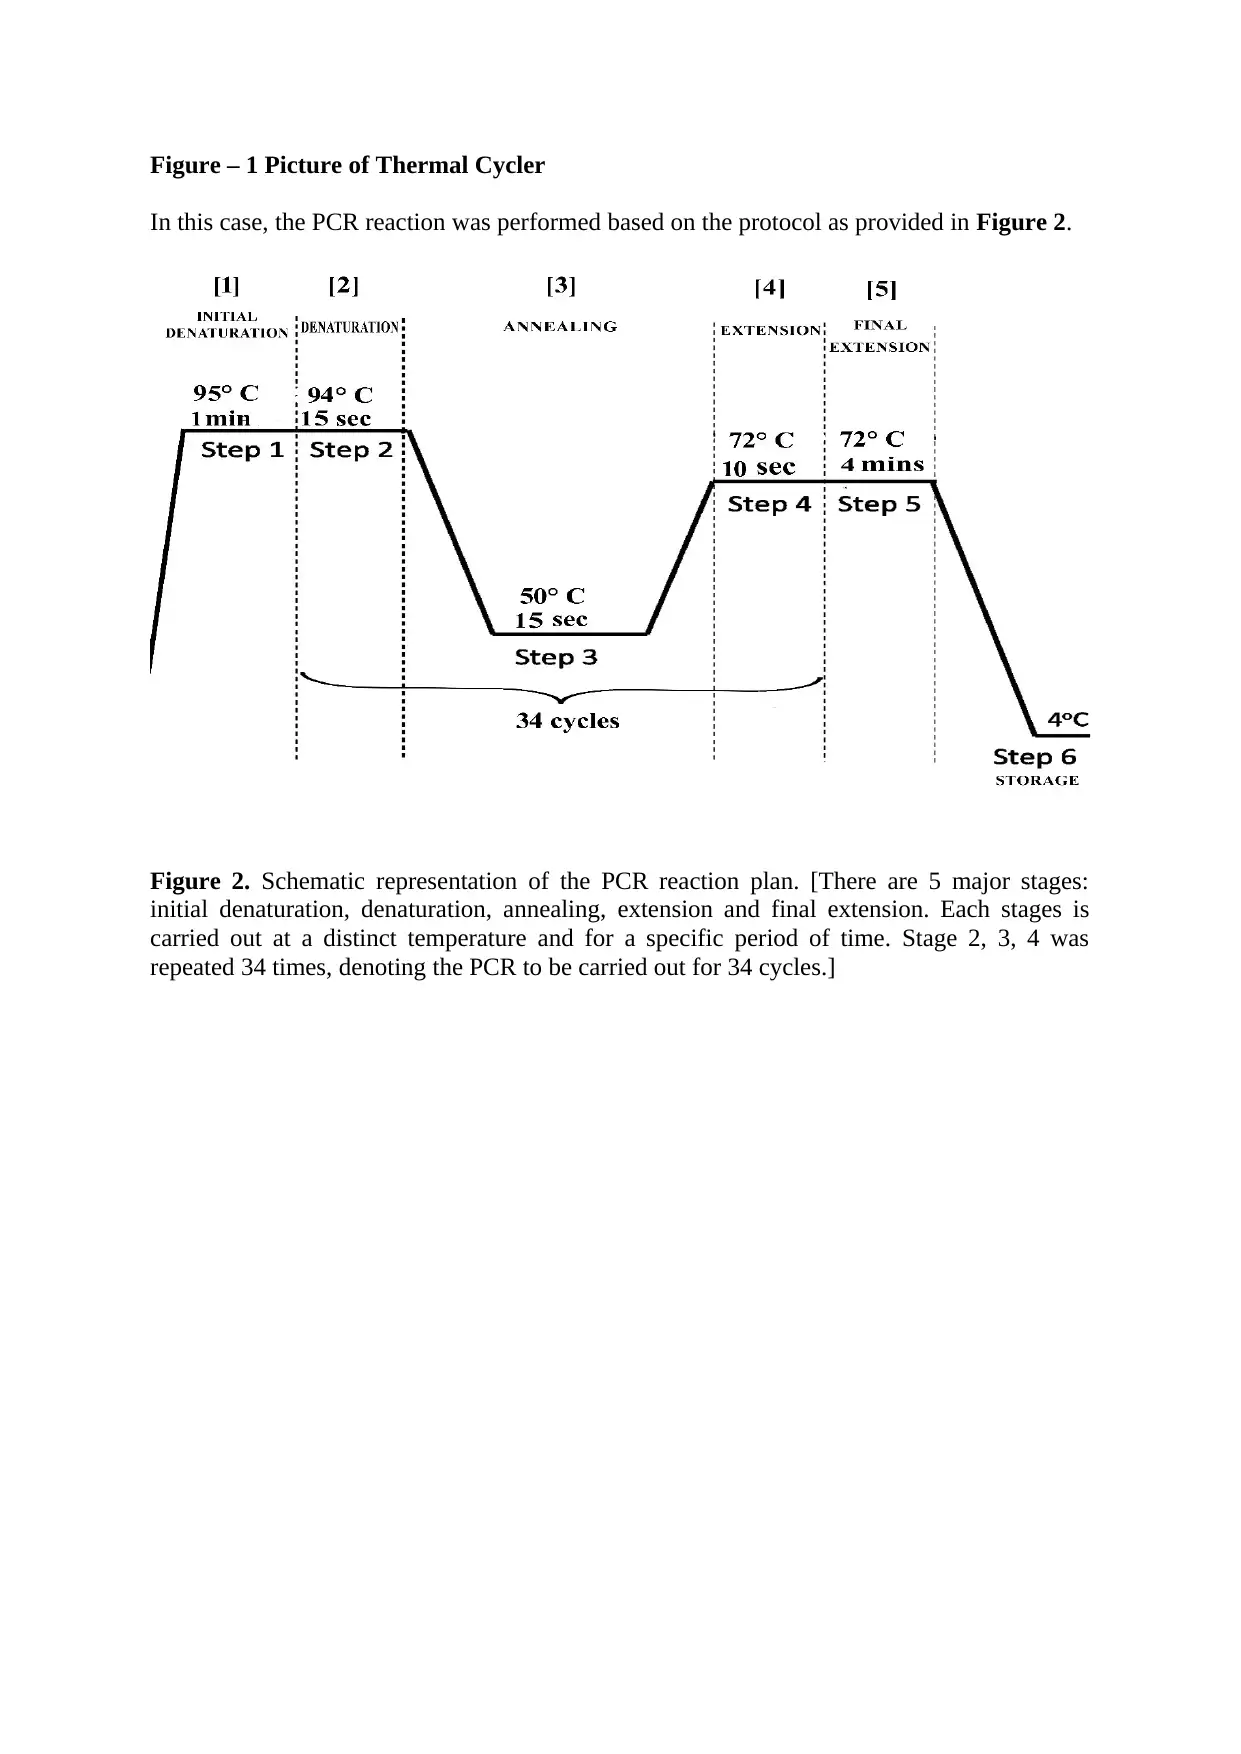
Figure – 1 Picture of Thermal Cycler
In this case, the PCR reaction was performed based on the protocol as provided in Figure 2.
Figure 2. Schematic representation of the PCR reaction plan. [There are 5 major stages:
initial denaturation, denaturation, annealing, extension and final extension. Each stages is
carried out at a distinct temperature and for a specific period of time. Stage 2, 3, 4 was
repeated 34 times, denoting the PCR to be carried out for 34 cycles.]
RESULTS
Figure 3
Victim Z Y X Ladder
Figure 3: Demonstrates the DNA amplicon obtained from the victim and the three unknown samples
from the suspects in 2% agarose electrophoresis gel
Steps for finding the size of band in bp from migration distance
1. The picture of the gel is printed on a paper.
2. We have to refer the lane that contains the standard of the gel, the size of each
standard band in bp is identified.
3. Log (base 10) of the standard band size =Data for Y axis.
4. From the top of the ladder to each standard band distance in mm is measured called
migration distance. This is the data for X axis.
5. The graph is drawn (figure 4).
6. The graph is of the nature y= mx + b
7. The standard graph gives the equation in this form (m=-0.0129 and b=3.3104)
y = (-0.0129 x +.3.3104)
8. Now the distance migrated (in mm) for all the unknown samples are measured.
9. Using the standard graph the value for Y is calculated for all the samples.
10. Antilog of each value of Y obtained solve the size of all the unknown bands in bp.
Secure Best Marks with AI Grader
Need help grading? Try our AI Grader for instant feedback on your assignments.
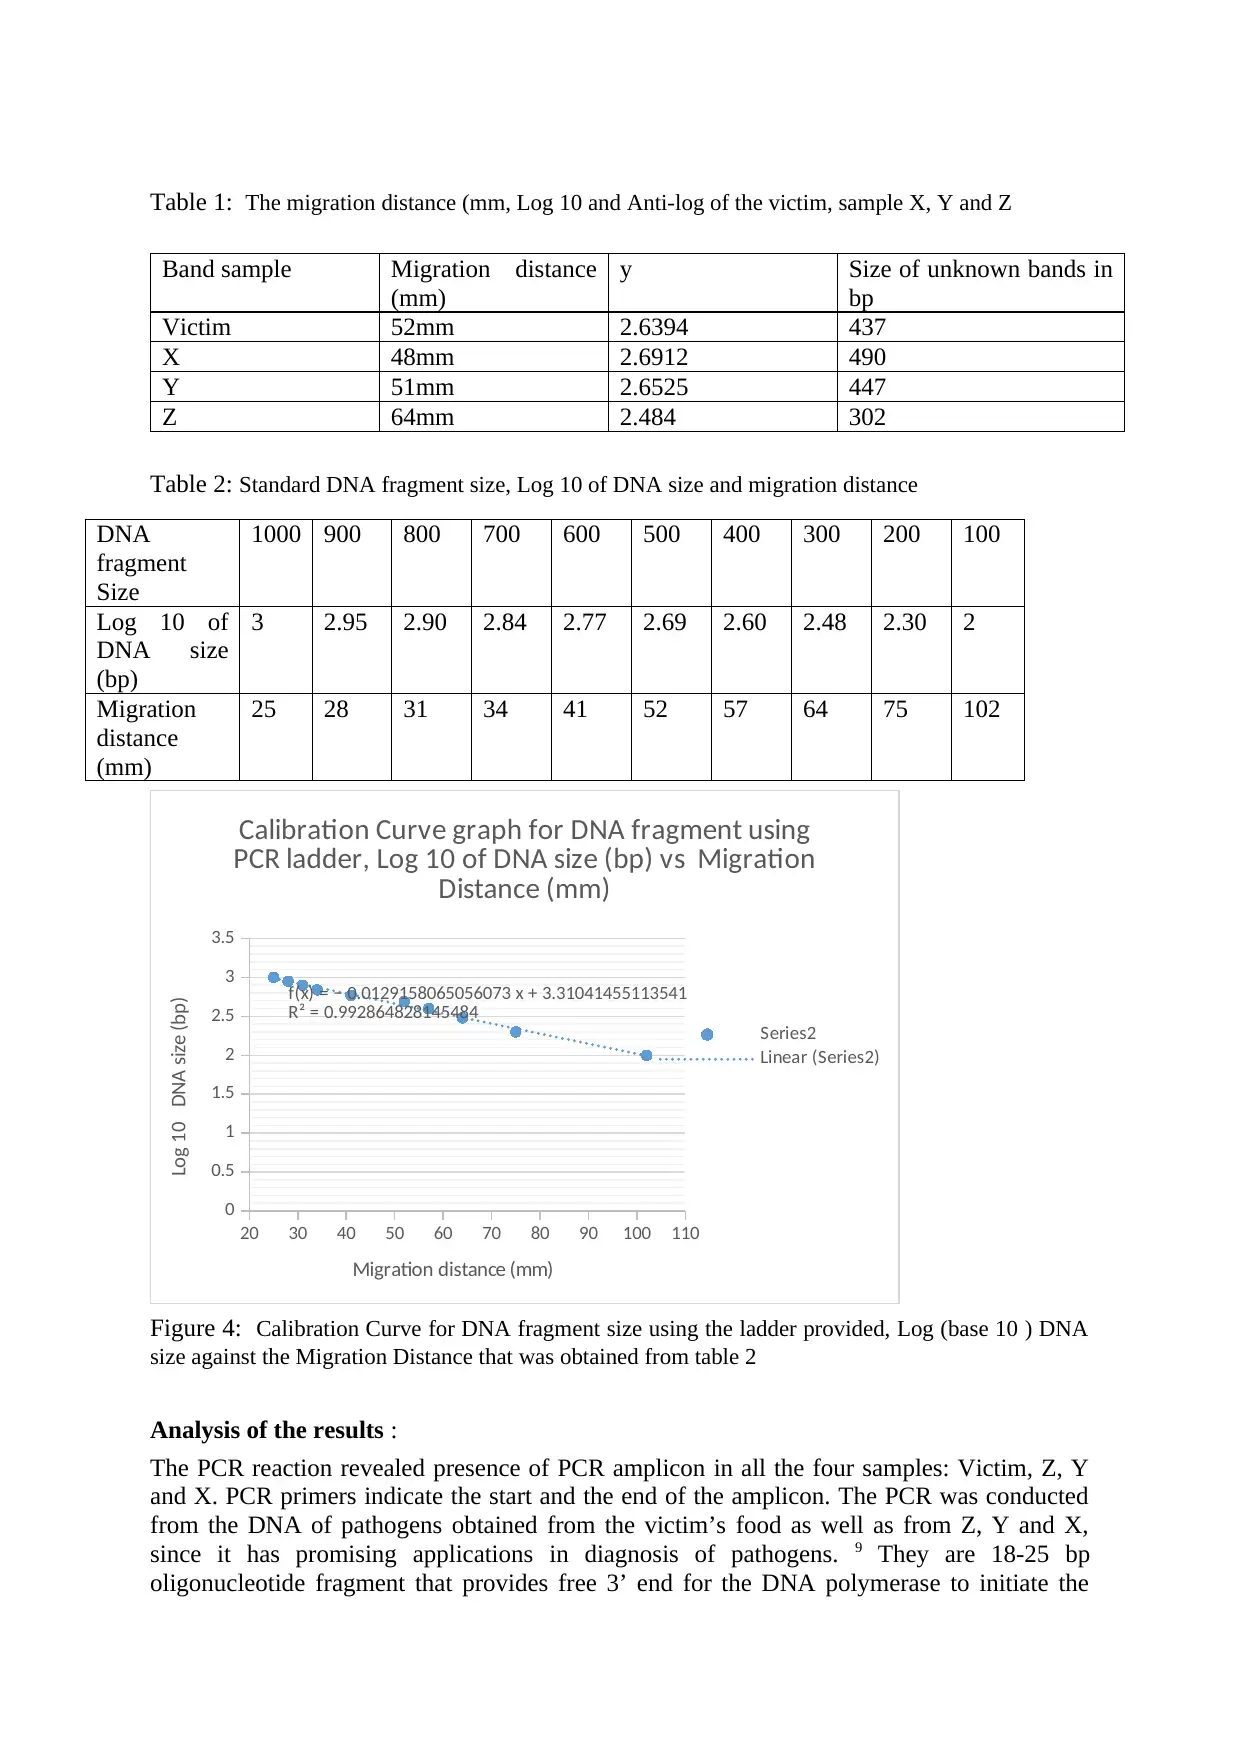
Table 1: The migration distance (mm, Log 10 and Anti-log of the victim, sample X, Y and Z
Band sample Migration distance
(mm)
y Size of unknown bands in
bp
Victim 52mm 2.6394 437
X 48mm 2.6912 490
Y 51mm 2.6525 447
Z 64mm 2.484 302
Table 2: Standard DNA fragment size, Log 10 of DNA size and migration distance
20 30 40 50 60 70 80 90 100 110
0
0.5
1
1.5
2
2.5
3
3.5
f(x) = − 0.0129158065056073 x + 3.31041455113541
R² = 0.992864828145484
Calibration Curve graph for DNA fragment using
PCR ladder, Log 10 of DNA size (bp) vs Migration
Distance (mm)
Series2
Linear (Series2)
Migration distance (mm)
Log 10 DNA size (bp)
Figure 4: Calibration Curve for DNA fragment size using the ladder provided, Log (base 10 ) DNA
size against the Migration Distance that was obtained from table 2
Analysis of the results :
The PCR reaction revealed presence of PCR amplicon in all the four samples: Victim, Z, Y
and X. PCR primers indicate the start and the end of the amplicon. The PCR was conducted
from the DNA of pathogens obtained from the victim’s food as well as from Z, Y and X,
since it has promising applications in diagnosis of pathogens. 9 They are 18-25 bp
oligonucleotide fragment that provides free 3’ end for the DNA polymerase to initiate the
DNA
fragment
Size
1000 900 800 700 600 500 400 300 200 100
Log 10 of
DNA size
(bp)
3 2.95 2.90 2.84 2.77 2.69 2.60 2.48 2.30 2
Migration
distance
(mm)
25 28 31 34 41 52 57 64 75 102

reaction. Total two primers are used in PCR forward and reverse primer. Primers bind to
segments of DNA, where it finds complementary regions. The forward and reverse primers
denote the start and end point of the amplicon, which must be complimentary to the primer.
In each of the cases, primer’s amplified regions of DNA which lies between the
complementary sequence of forward and reverse primers. Since DNA sequence of the four
samples are different, different regions of DNA might have the complementary region of
primers and also number of nucleotides in between the two regions also vary with sample to
sample. So the amplicon generated from each of the DNA samples will have different
sequence and will be of different sizes, with their sequences at the ends similar, where the
primer bound in the PCR reaction .This is the reason, although the primers (forward and
reverse) used are same in all the four samples.
In this study, it has been observed that the amplicon size of the victim and sample Y are
almost identical. From this we can assume that the amplicons generated in both the cases will
be identical, since both amplicons are of same size. There is no chance for the other
amplicons for being identical with the amplicon of the victim, since their sizes are widely
different. Hence the suspect of X and Z being suspects are eliminated. So among the three
suspects, only Y shares similar sized amplicon with that of the victim. So from the results, it
has been evidently observed that drink obtained from sample Y actually contained pathogen
for the food poisoning. And the lady in the bar suspect.
LIST OF REFERENCES
Berg H and others ‘Restriction fragment length polymorphism analysis of PCR-amplified
fragments (PCR-RFLP) and gel electrophoresis-valuable tool for genotyping and genetic
fingerprinting. Gel electrophoresis-principles and basics.’ InTech, 2012.
Budowle B ,’ Analysis of the VNTR locus D1S80 by the PCR followed by high-resolution
PAGE.’(1991), Am. J. Hum. Genet . 48, 137–144
Caswell J and others ‘A Diagnostic Laboratory Perspective,Veterinary' Pathology.51(March
2014) (2): 341–350.doi:10.1177/0300985813511132.PMID24569613.
Current Issues Molec.(1999) Biol. 1(1): 47-52.
Current. Issues Mol. Biology Analysis of Specific Bacteria from Environmental Samples
using a Quantitative Polymerase Chain Reaction . 4: 13-18 , 2002
Gill P ,’An assessment of the utility of single nucleotide polymorphisms (SNPs) for forensic
purposes’. Int. J. Legal Med (2001) ,.114, 204–210
Kimpton C and others ‘Automated DNA profiling employing multiplex amplification of
short tandem repeat loci PCR Methods Appl.’,International Journal of Legal Medicine
(1993) 3, 13–22.
Mullis K, ‘Specific enzymatic amplification of DNA in vitro: the polymerase chain reaction.’
Cold Spring Harbor symposia on quantitative biology (1986) 51, 263–273.
Saiki R , ’Primer-directed enzymatic amplification of DNA with a thermostable DNA
polymerase’ , Science. 239 (4839): 487–491,(1988) doi:10.1126/science.2448875
Sambrook J and others, Molecular Cloning: A Laboratory Manual (3rd ed.). Cold Spring
Harbor, N.Y.: Cold Spring Harbor Laboratory Press.(1998) ISBN 978- 0-879-69576-7.
Chapter 8 In vitro Amplification of DNA by the Polymerase Chain Reaction ).
1 out of 7
Related Documents
Your All-in-One AI-Powered Toolkit for Academic Success.
+13062052269
info@desklib.com
Available 24*7 on WhatsApp / Email
![[object Object]](/_next/static/media/star-bottom.7253800d.svg)
Unlock your academic potential
© 2024 | Zucol Services PVT LTD | All rights reserved.


