Comparison of Barclays and Standard Chartered monthly stock return performance
VerifiedAdded on 2023/06/10
|16
|4094
|469
AI Summary
This article provides a brief description of Barclays and Standard Chartered Plc. It compares and contrasts their monthly stock return performance and provides stock recommendations. The article also includes portfolio formation and analysis, calculation of mean, variance, and standard deviation of portfolio returns, trade-off between mean return and standard deviation of the portfolio, and indicating efficient frontier in a trade-off graph. The subject of the article is finance and investments. No course code or college/university is mentioned.
Contribute Materials
Your contribution can guide someone’s learning journey. Share your
documents today.

INDIVIDUAL
ASSIGNMENT
ASSIGNMENT
Secure Best Marks with AI Grader
Need help grading? Try our AI Grader for instant feedback on your assignments.
Table of Contents
PART 1............................................................................................................................................3
Brief description of Company A and Company B.......................................................................3
Comparison and contrasting between Barclays and Standard Chartered monthly stock return
performance.................................................................................................................................4
Comment on result and Stock Recommendation.........................................................................5
2. Portfolio formation and analysis..............................................................................................5
a. Calculation of mean, variance and standard deviation of portfolio returns.............................5
b. Trade – Off between mean return and standard deviation of the portfolio.............................8
c. Indicating Efficient Frontier in a Trade – off graph................................................................9
d. Minimum Variance Portfolio.................................................................................................10
e. Advise to investor on the basis of above findings.................................................................12
PART 2..........................................................................................................................................13
1. Calculation of investor’s required rate of return on company A’s equity.............................13
2. Valuation of company A’s equity..........................................................................................14
3. Comparison of calculated equity value with market value (or current stock price) of the
company.....................................................................................................................................14
REFERENCES..............................................................................................................................15
Books and Journals....................................................................................................................15
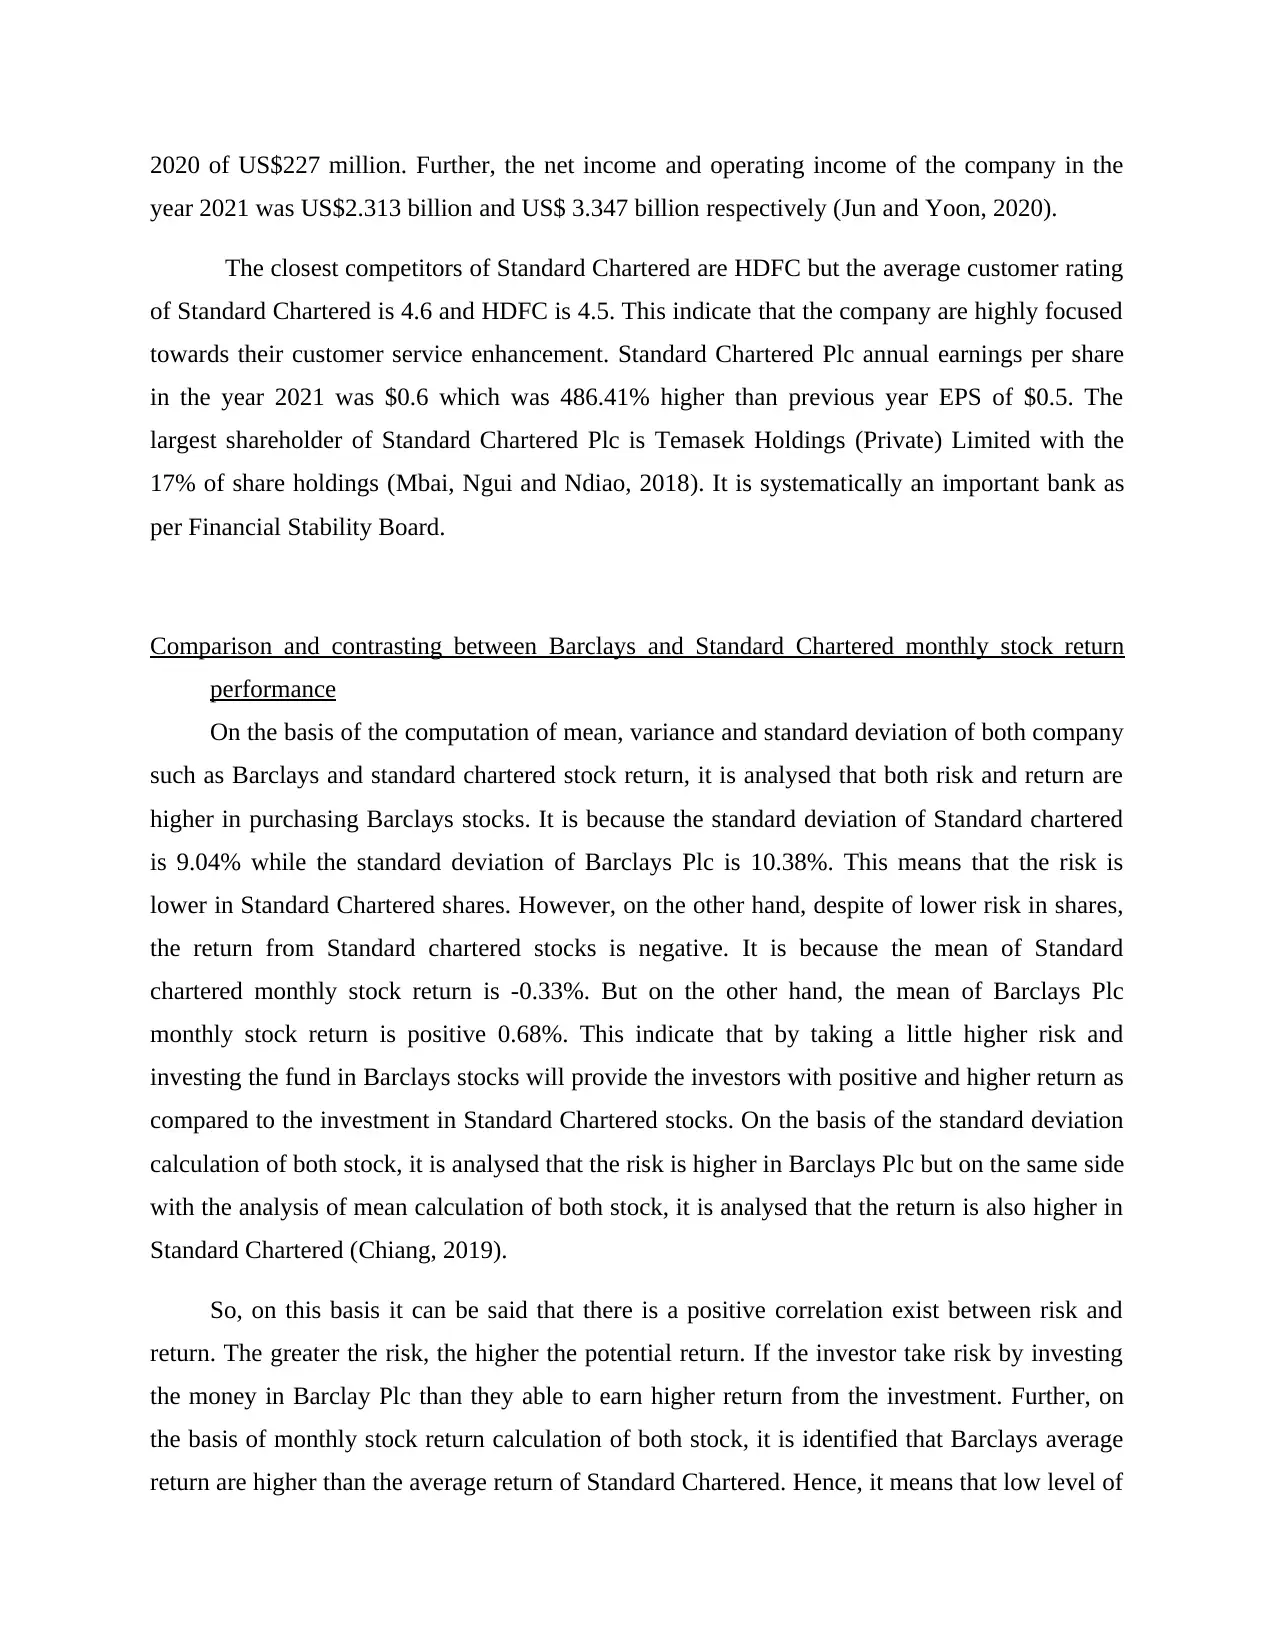
PART 1
Brief description of Company A and Company B
Company A: Barclays Plc
Barclays is a British multinational universal bank having its headquarter in London,
England which was founded in the year 1630. Barclay is basically operating as two divisions i.e.,
Barclays UK and Barclays International. The company is a public limited company and primarily
listed on London Stock Exchange (LSE). Secondly, Barclays is also listed on New York Stock
Exchange. The company generally operates in over 40 countries and provide employment to
more than 80000 people. It is one of the fifth largest bank in Europe because of its total assets
value of £1.384 trillion as per 2021 annual report (Augar, 2018). Basically, Barclays products &
comprises of retail banking, consumer credit cards, wealth management service, private banking,
wholesale banking, investment, commercial banking etc.
As per 2021 annual report, the total revenue of Barclays includes £21.940 billion which is
higher than the previous year total revenue of 21.766 billion. The net income and operating
income of the company in the year 2021 was £7.226 billion and 8.414 billion respectively.
Further, the earning per share of Barclays in the year 2021 is $2.01 that is higher than the year
2020 of $0.44 EPS. The company have market share of around 10.50% beside of the top
competitors such as HSBC, JP Morgan Securities Plc whose market shares is lower than
Barclays with 6.75% and 6.07% respectively (Nyanaro and Bett, 2018).
Company B: Standard Chartered Plc
Standard Chartered Plc is a British multinational banking and financial service public
limited company that was founded in the year 1853. The company have its headquarter in
London, England. The company basically operates a network of more than 1200 branches and
outlet in more than 70 countries in order to enhance their international presence. The products
and service of Standard Chartered Plc is comprising of credit cards, consumer banking, corporate
banking, investment, private, mortgage loan, wealth management etc. The company is primarily
listed on the London Stock Exchange (LSE). It is one of the largest international bank. The total
number of employees worked with Standard Chartered Plc is 85000 employees. The total
revenue of the company in the year 2021 is US$ 337 million which was higher than the year
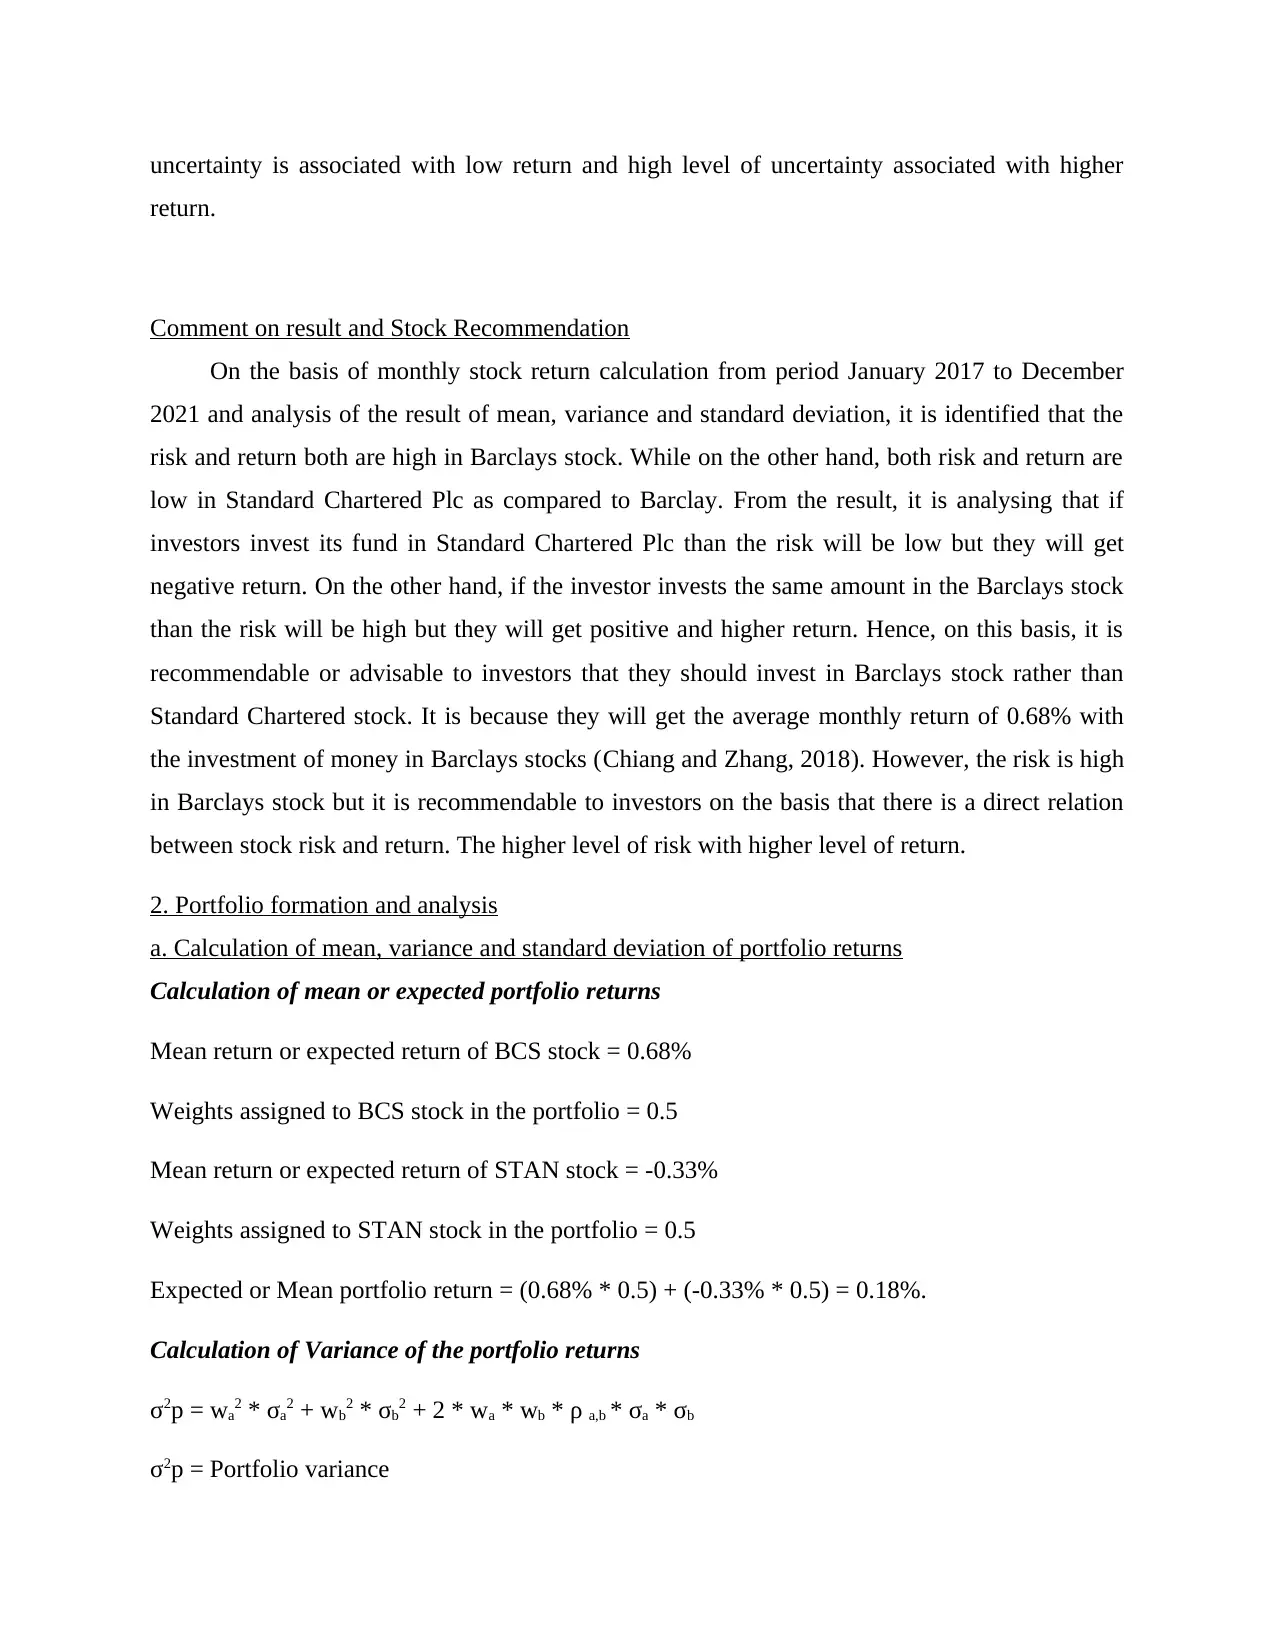
2020 of US$227 million. Further, the net income and operating income of the company in the
year 2021 was US$2.313 billion and US$ 3.347 billion respectively (Jun and Yoon, 2020).
The closest competitors of Standard Chartered are HDFC but the average customer rating
of Standard Chartered is 4.6 and HDFC is 4.5. This indicate that the company are highly focused
towards their customer service enhancement. Standard Chartered Plc annual earnings per share
in the year 2021 was $0.6 which was 486.41% higher than previous year EPS of $0.5. The
largest shareholder of Standard Chartered Plc is Temasek Holdings (Private) Limited with the
17% of share holdings (Mbai, Ngui and Ndiao, 2018). It is systematically an important bank as
per Financial Stability Board.
Comparison and contrasting between Barclays and Standard Chartered monthly stock return
performance
On the basis of the computation of mean, variance and standard deviation of both company
such as Barclays and standard chartered stock return, it is analysed that both risk and return are
higher in purchasing Barclays stocks. It is because the standard deviation of Standard chartered
is 9.04% while the standard deviation of Barclays Plc is 10.38%. This means that the risk is
lower in Standard Chartered shares. However, on the other hand, despite of lower risk in shares,
the return from Standard chartered stocks is negative. It is because the mean of Standard
chartered monthly stock return is -0.33%. But on the other hand, the mean of Barclays Plc
monthly stock return is positive 0.68%. This indicate that by taking a little higher risk and
investing the fund in Barclays stocks will provide the investors with positive and higher return as
compared to the investment in Standard Chartered stocks. On the basis of the standard deviation
calculation of both stock, it is analysed that the risk is higher in Barclays Plc but on the same side
with the analysis of mean calculation of both stock, it is analysed that the return is also higher in
Standard Chartered (Chiang, 2019).
So, on this basis it can be said that there is a positive correlation exist between risk and
return. The greater the risk, the higher the potential return. If the investor take risk by investing
the money in Barclay Plc than they able to earn higher return from the investment. Further, on
the basis of monthly stock return calculation of both stock, it is identified that Barclays average
return are higher than the average return of Standard Chartered. Hence, it means that low level of
Secure Best Marks with AI Grader
Need help grading? Try our AI Grader for instant feedback on your assignments.
uncertainty is associated with low return and high level of uncertainty associated with higher
return.
Comment on result and Stock Recommendation
On the basis of monthly stock return calculation from period January 2017 to December
2021 and analysis of the result of mean, variance and standard deviation, it is identified that the
risk and return both are high in Barclays stock. While on the other hand, both risk and return are
low in Standard Chartered Plc as compared to Barclay. From the result, it is analysing that if
investors invest its fund in Standard Chartered Plc than the risk will be low but they will get
negative return. On the other hand, if the investor invests the same amount in the Barclays stock
than the risk will be high but they will get positive and higher return. Hence, on this basis, it is
recommendable or advisable to investors that they should invest in Barclays stock rather than
Standard Chartered stock. It is because they will get the average monthly return of 0.68% with
the investment of money in Barclays stocks (Chiang and Zhang, 2018). However, the risk is high
in Barclays stock but it is recommendable to investors on the basis that there is a direct relation
between stock risk and return. The higher level of risk with higher level of return.
2. Portfolio formation and analysis
a. Calculation of mean, variance and standard deviation of portfolio returns
Calculation of mean or expected portfolio returns
Mean return or expected return of BCS stock = 0.68%
Weights assigned to BCS stock in the portfolio = 0.5
Mean return or expected return of STAN stock = -0.33%
Weights assigned to STAN stock in the portfolio = 0.5
Expected or Mean portfolio return = (0.68% * 0.5) + (-0.33% * 0.5) = 0.18%.
Calculation of Variance of the portfolio returns
σ2p = wa2 * σa2 + wb2 * σb2 + 2 * wa * wb * ρ a,b * σa * σb
σ2p = Portfolio variance
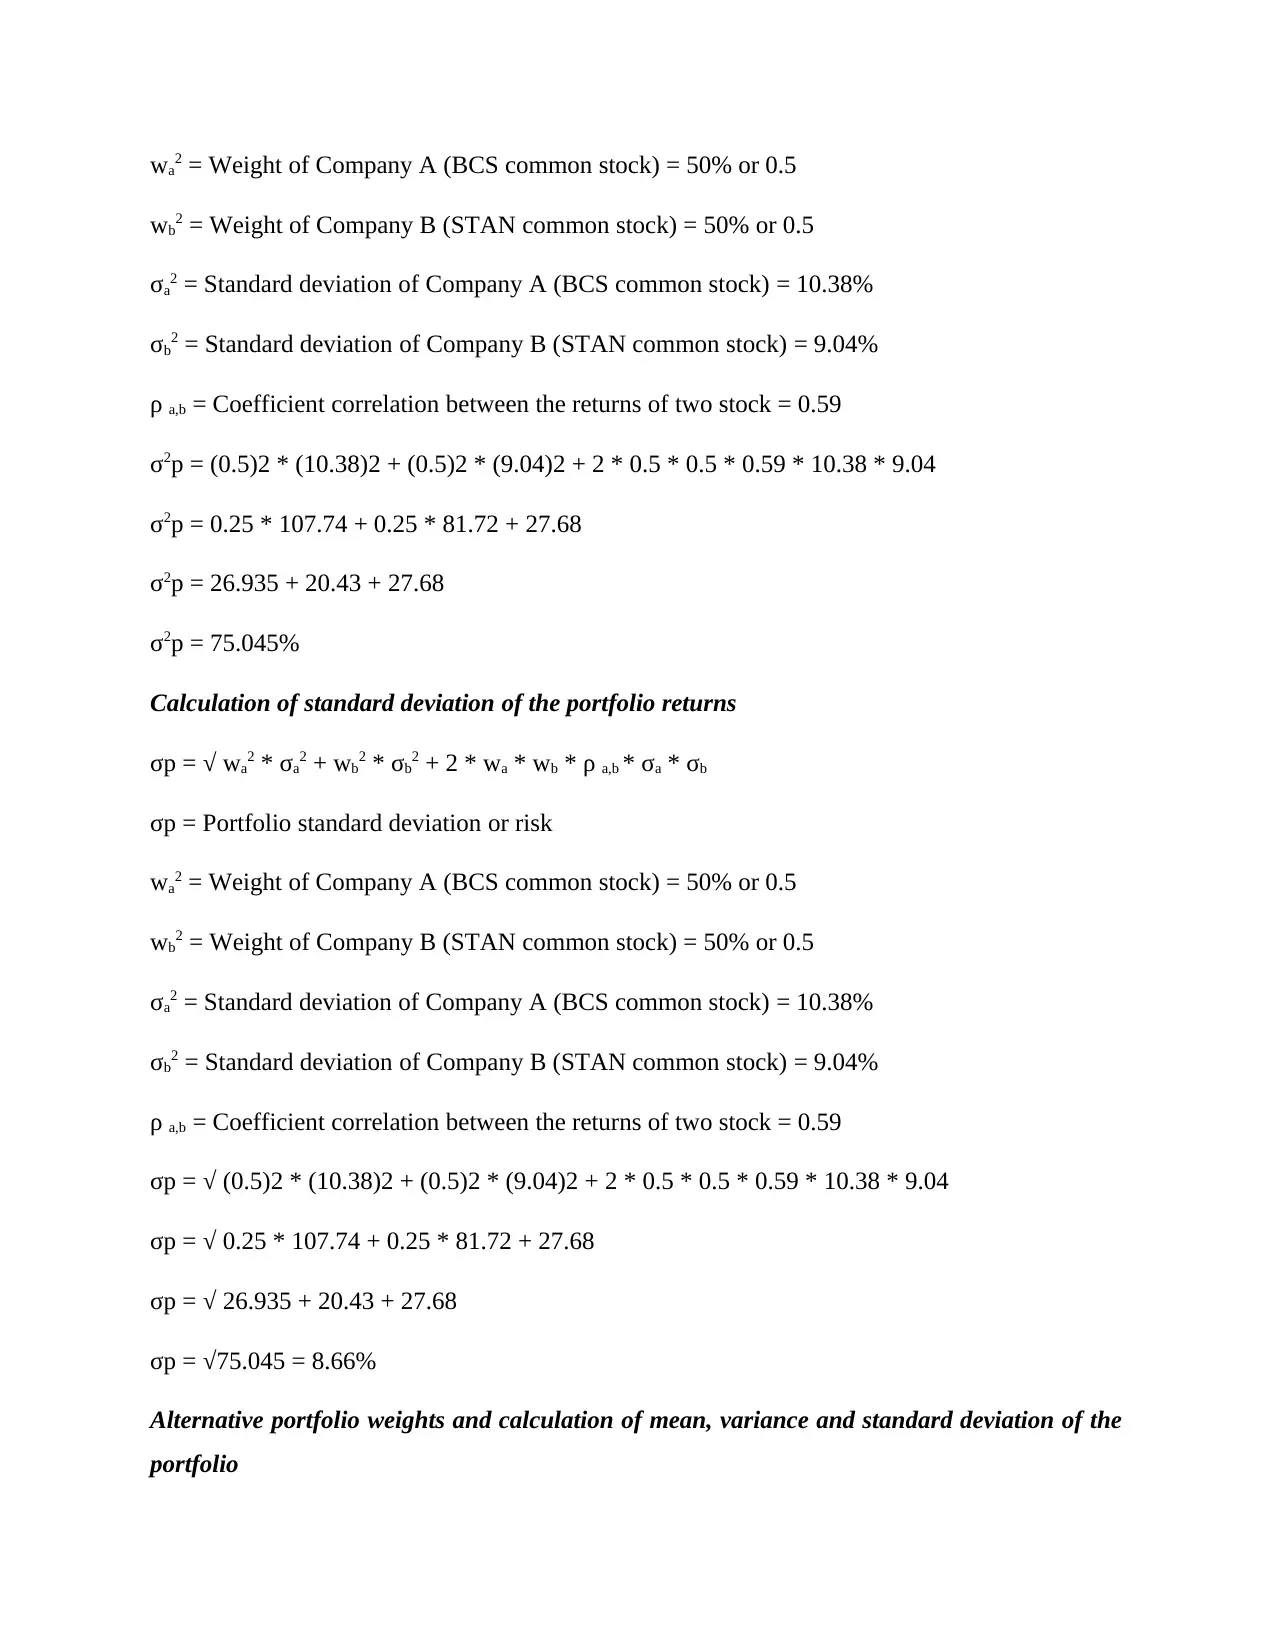
wa2 = Weight of Company A (BCS common stock) = 50% or 0.5
wb2 = Weight of Company B (STAN common stock) = 50% or 0.5
σa2 = Standard deviation of Company A (BCS common stock) = 10.38%
σb2 = Standard deviation of Company B (STAN common stock) = 9.04%
ρ a,b = Coefficient correlation between the returns of two stock = 0.59
σ2p = (0.5)2 * (10.38)2 + (0.5)2 * (9.04)2 + 2 * 0.5 * 0.5 * 0.59 * 10.38 * 9.04
σ2p = 0.25 * 107.74 + 0.25 * 81.72 + 27.68
σ2p = 26.935 + 20.43 + 27.68
σ2p = 75.045%
Calculation of standard deviation of the portfolio returns
σp = √ wa2 * σa2 + wb2 * σb2 + 2 * wa * wb * ρ a,b * σa * σb
σp = Portfolio standard deviation or risk
wa2 = Weight of Company A (BCS common stock) = 50% or 0.5
wb2 = Weight of Company B (STAN common stock) = 50% or 0.5
σa2 = Standard deviation of Company A (BCS common stock) = 10.38%
σb2 = Standard deviation of Company B (STAN common stock) = 9.04%
ρ a,b = Coefficient correlation between the returns of two stock = 0.59
σp = √ (0.5)2 * (10.38)2 + (0.5)2 * (9.04)2 + 2 * 0.5 * 0.5 * 0.59 * 10.38 * 9.04
σp = √ 0.25 * 107.74 + 0.25 * 81.72 + 27.68
σp = √ 26.935 + 20.43 + 27.68
σp = √75.045 = 8.66%
Alternative portfolio weights and calculation of mean, variance and standard deviation of the
portfolio
wb2 = Weight of Company B (STAN common stock) = 50% or 0.5
σa2 = Standard deviation of Company A (BCS common stock) = 10.38%
σb2 = Standard deviation of Company B (STAN common stock) = 9.04%
ρ a,b = Coefficient correlation between the returns of two stock = 0.59
σ2p = (0.5)2 * (10.38)2 + (0.5)2 * (9.04)2 + 2 * 0.5 * 0.5 * 0.59 * 10.38 * 9.04
σ2p = 0.25 * 107.74 + 0.25 * 81.72 + 27.68
σ2p = 26.935 + 20.43 + 27.68
σ2p = 75.045%
Calculation of standard deviation of the portfolio returns
σp = √ wa2 * σa2 + wb2 * σb2 + 2 * wa * wb * ρ a,b * σa * σb
σp = Portfolio standard deviation or risk
wa2 = Weight of Company A (BCS common stock) = 50% or 0.5
wb2 = Weight of Company B (STAN common stock) = 50% or 0.5
σa2 = Standard deviation of Company A (BCS common stock) = 10.38%
σb2 = Standard deviation of Company B (STAN common stock) = 9.04%
ρ a,b = Coefficient correlation between the returns of two stock = 0.59
σp = √ (0.5)2 * (10.38)2 + (0.5)2 * (9.04)2 + 2 * 0.5 * 0.5 * 0.59 * 10.38 * 9.04
σp = √ 0.25 * 107.74 + 0.25 * 81.72 + 27.68
σp = √ 26.935 + 20.43 + 27.68
σp = √75.045 = 8.66%
Alternative portfolio weights and calculation of mean, variance and standard deviation of the
portfolio
Weight assigned
to BCS
Weight Assigned
to STAN
Portfolio
expected return
Portfolio
variance
Portfolio Standard
Deviation
0 1 -0.33% 81.63% 9.04%
0.1 0.9 -0.23% 78.65% 8.87%
0.2 0.8 -0.13% 76.91% 8.77%
0.3 0.7 -0.03% 76.41% 8.74%
0.4 0.6 0.07% 77.16% 8.78%
0.5 0.5 0.18% 79.15% 8.90%
0.6 0.4 0.28% 82.38% 9.08%
0.7 0.3 0.38% 86.86% 9.32%
0.8 0.2 0.48% 92.58% 9.62%
0.9 0.1 0.58% 99.54% 9.98%
1 0 0.68% 107.75% 10.38%
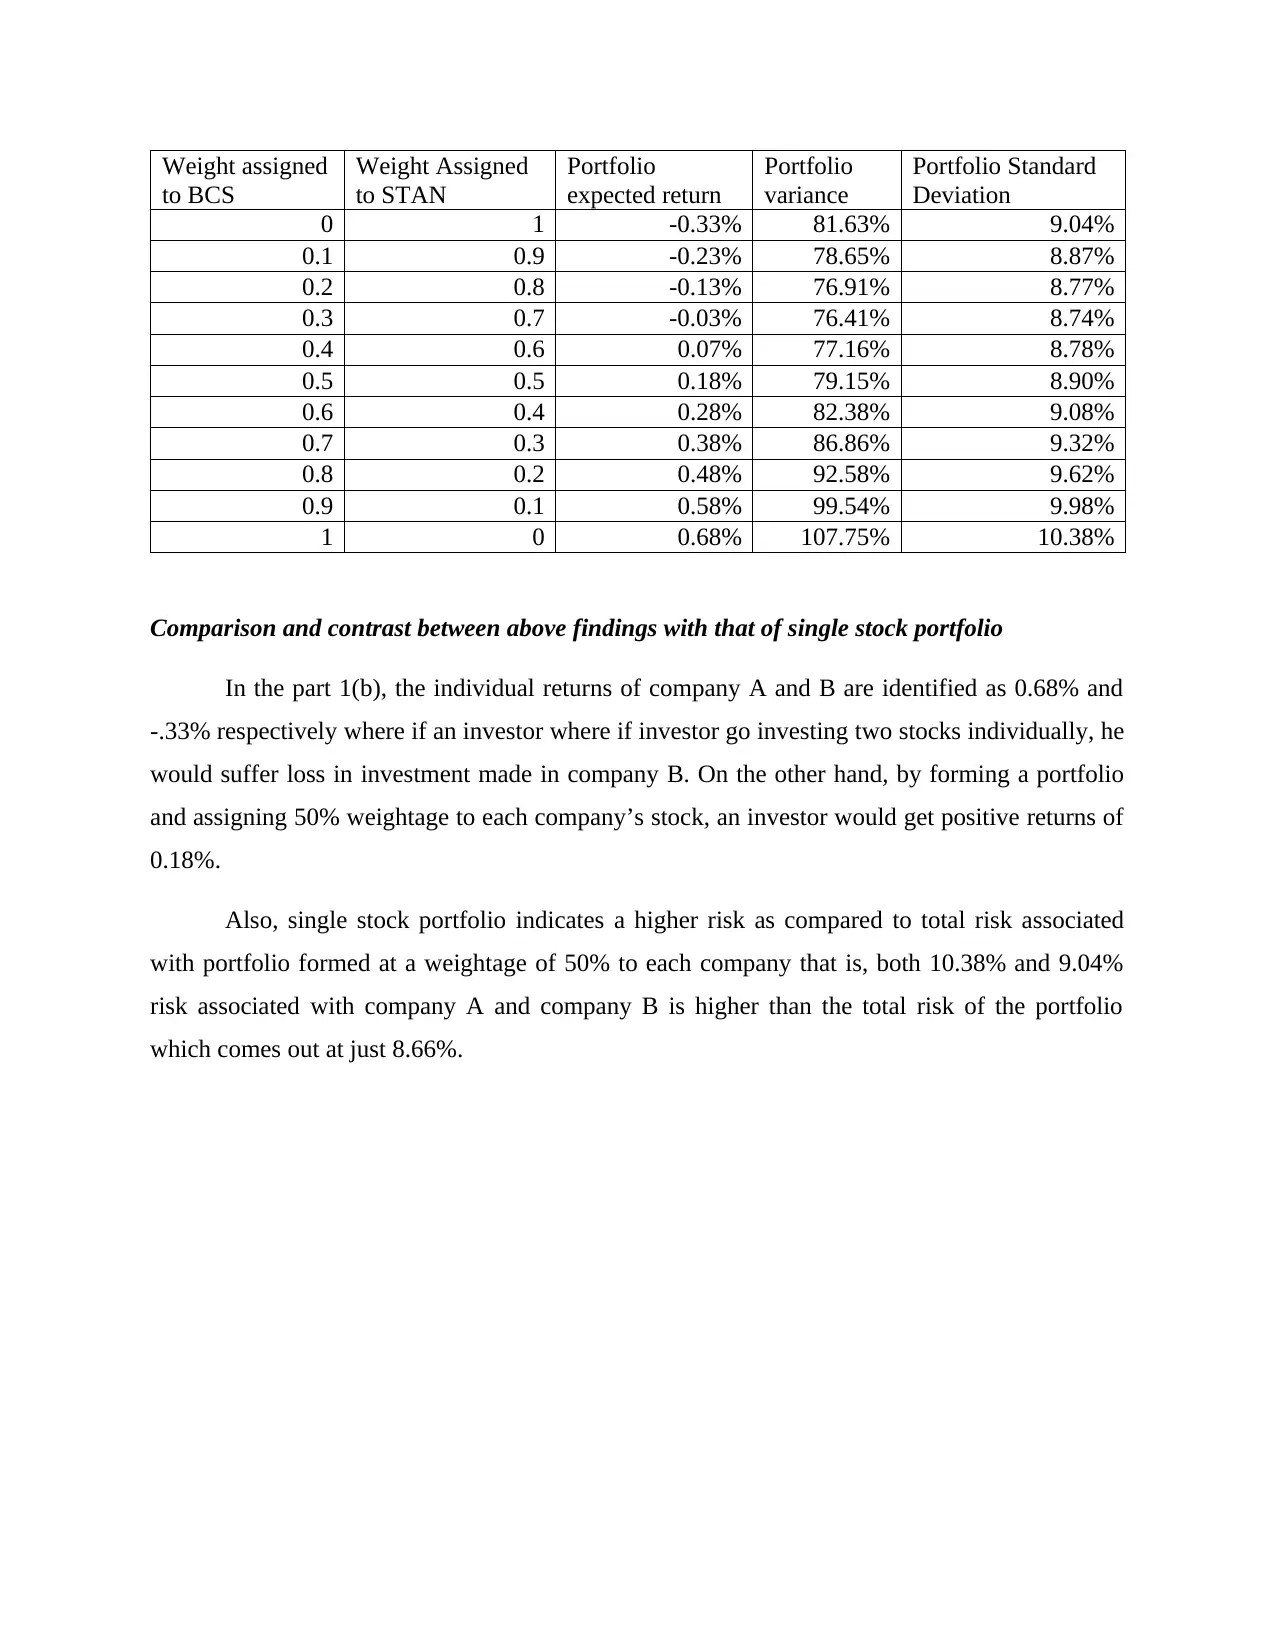
Comparison and contrast between above findings with that of single stock portfolio
In the part 1(b), the individual returns of company A and B are identified as 0.68% and
-.33% respectively where if an investor where if investor go investing two stocks individually, he
would suffer loss in investment made in company B. On the other hand, by forming a portfolio
and assigning 50% weightage to each company’s stock, an investor would get positive returns of
0.18%.
Also, single stock portfolio indicates a higher risk as compared to total risk associated
with portfolio formed at a weightage of 50% to each company that is, both 10.38% and 9.04%
risk associated with company A and company B is higher than the total risk of the portfolio
which comes out at just 8.66%.
to BCS
Weight Assigned
to STAN
Portfolio
expected return
Portfolio
variance
Portfolio Standard
Deviation
0 1 -0.33% 81.63% 9.04%
0.1 0.9 -0.23% 78.65% 8.87%
0.2 0.8 -0.13% 76.91% 8.77%
0.3 0.7 -0.03% 76.41% 8.74%
0.4 0.6 0.07% 77.16% 8.78%
0.5 0.5 0.18% 79.15% 8.90%
0.6 0.4 0.28% 82.38% 9.08%
0.7 0.3 0.38% 86.86% 9.32%
0.8 0.2 0.48% 92.58% 9.62%
0.9 0.1 0.58% 99.54% 9.98%
1 0 0.68% 107.75% 10.38%
Comparison and contrast between above findings with that of single stock portfolio
In the part 1(b), the individual returns of company A and B are identified as 0.68% and
-.33% respectively where if an investor where if investor go investing two stocks individually, he
would suffer loss in investment made in company B. On the other hand, by forming a portfolio
and assigning 50% weightage to each company’s stock, an investor would get positive returns of
0.18%.
Also, single stock portfolio indicates a higher risk as compared to total risk associated
with portfolio formed at a weightage of 50% to each company that is, both 10.38% and 9.04%
risk associated with company A and company B is higher than the total risk of the portfolio
which comes out at just 8.66%.
Paraphrase This Document
Need a fresh take? Get an instant paraphrase of this document with our AI Paraphraser
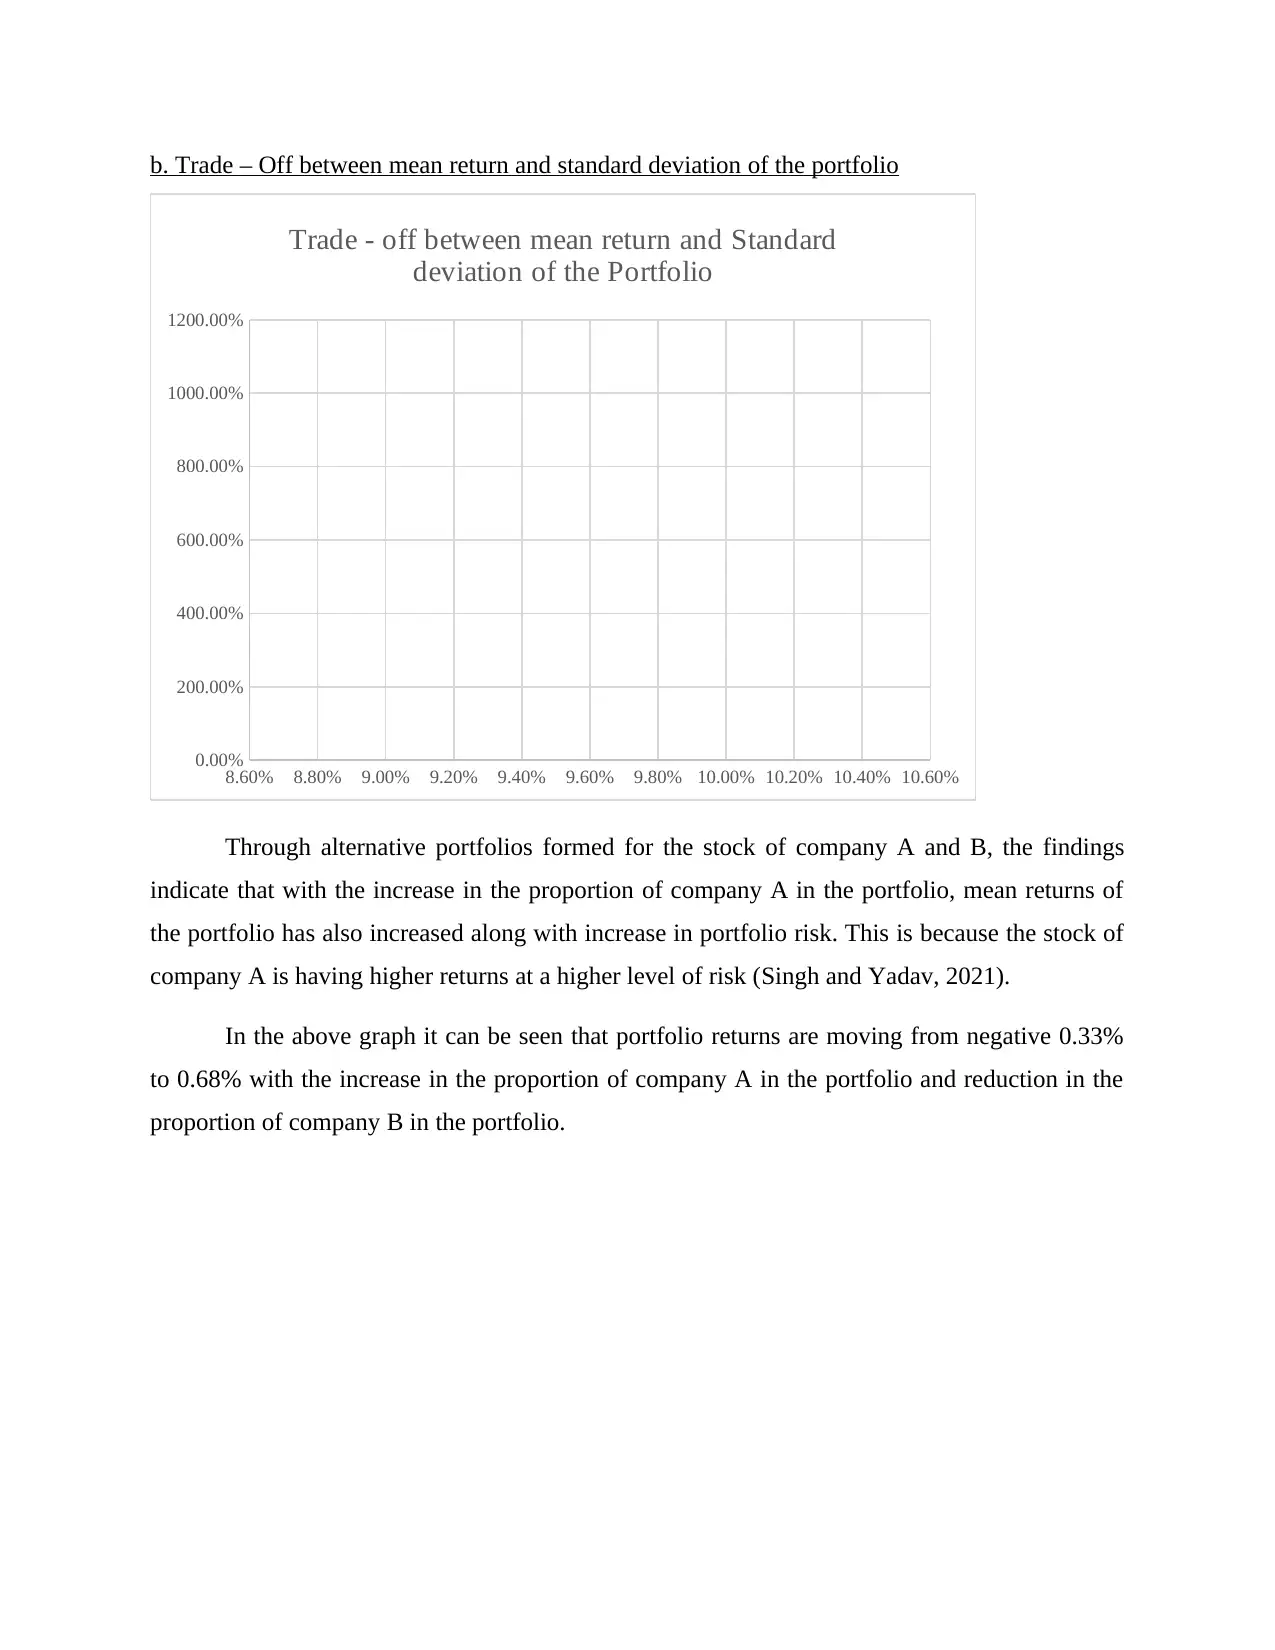
b. Trade – Off between mean return and standard deviation of the portfolio
8.60% 8.80% 9.00% 9.20% 9.40% 9.60% 9.80% 10.00% 10.20% 10.40% 10.60%
0.00%
200.00%
400.00%
600.00%
800.00%
1000.00%
1200.00%
Trade - off between mean return and Standard
deviation of the Portfolio
Through alternative portfolios formed for the stock of company A and B, the findings
indicate that with the increase in the proportion of company A in the portfolio, mean returns of
the portfolio has also increased along with increase in portfolio risk. This is because the stock of
company A is having higher returns at a higher level of risk (Singh and Yadav, 2021).
In the above graph it can be seen that portfolio returns are moving from negative 0.33%
to 0.68% with the increase in the proportion of company A in the portfolio and reduction in the
proportion of company B in the portfolio.
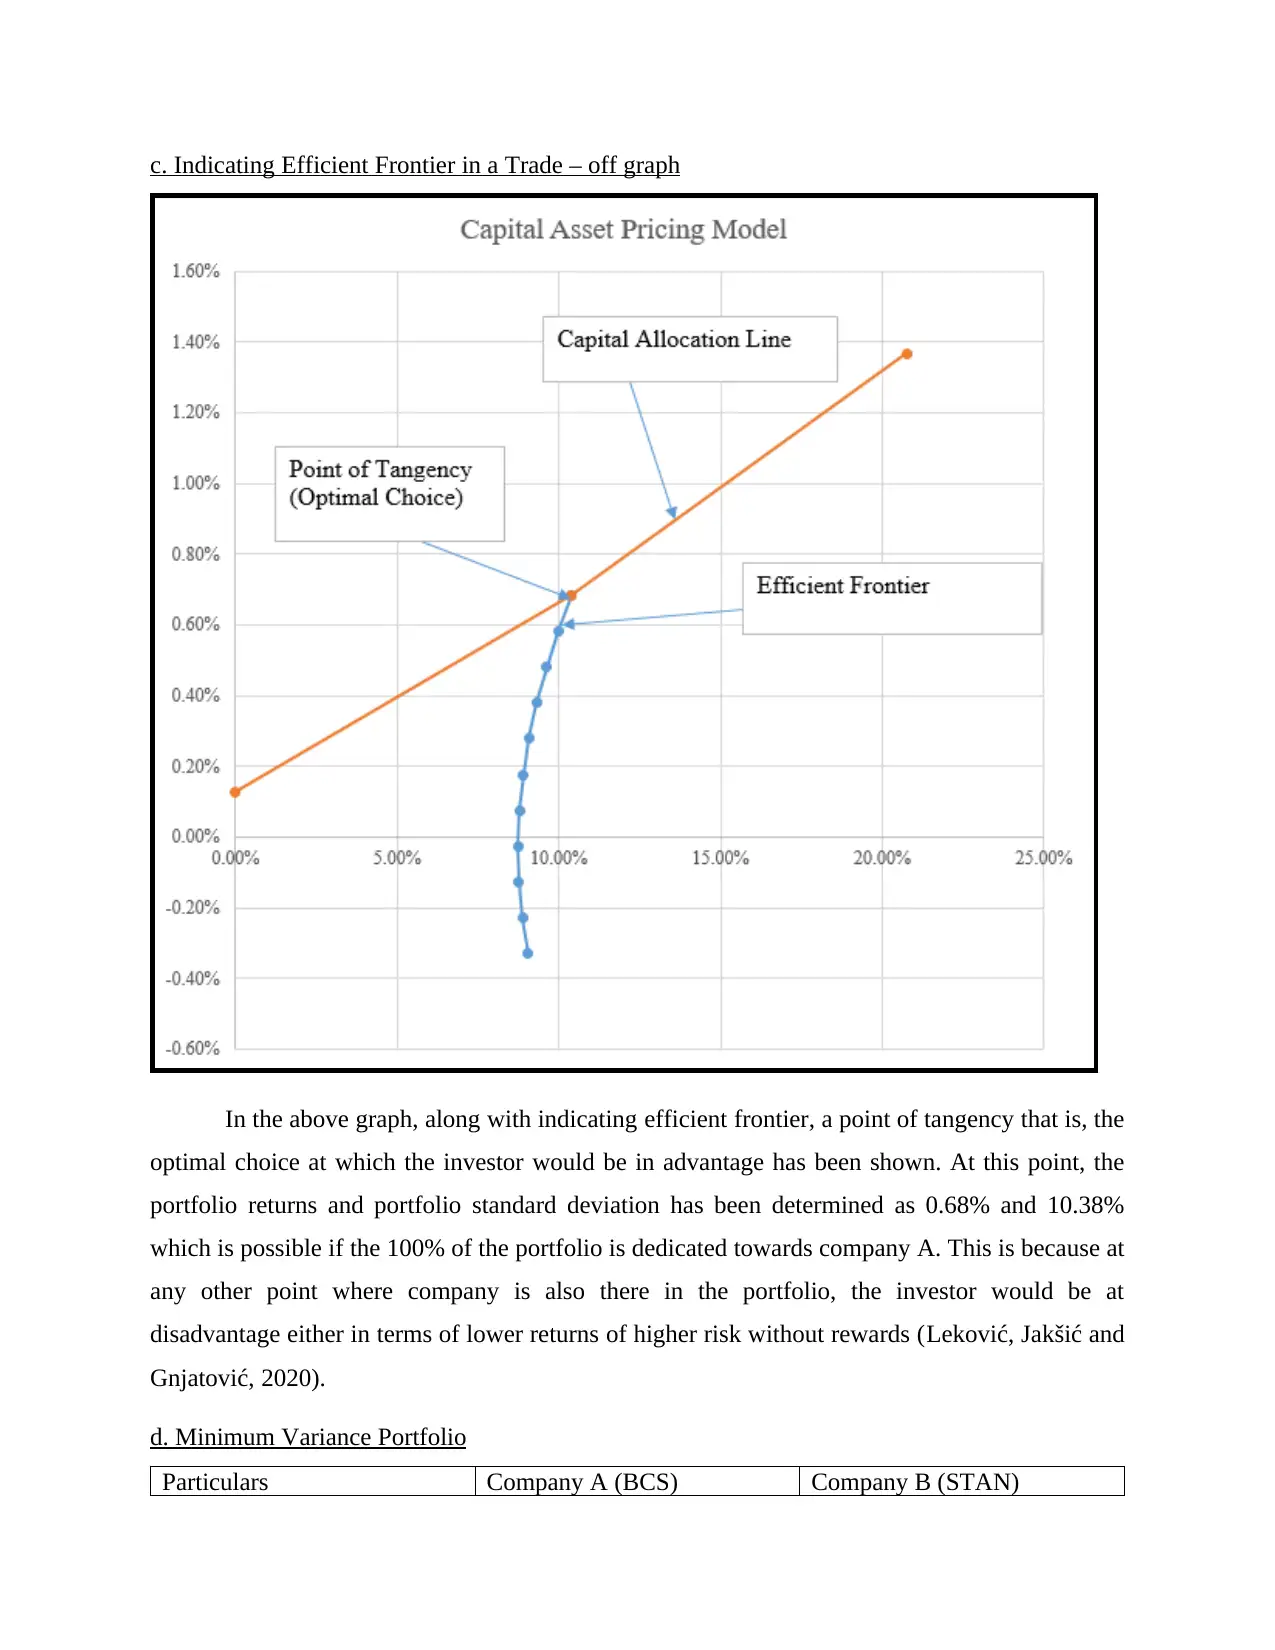
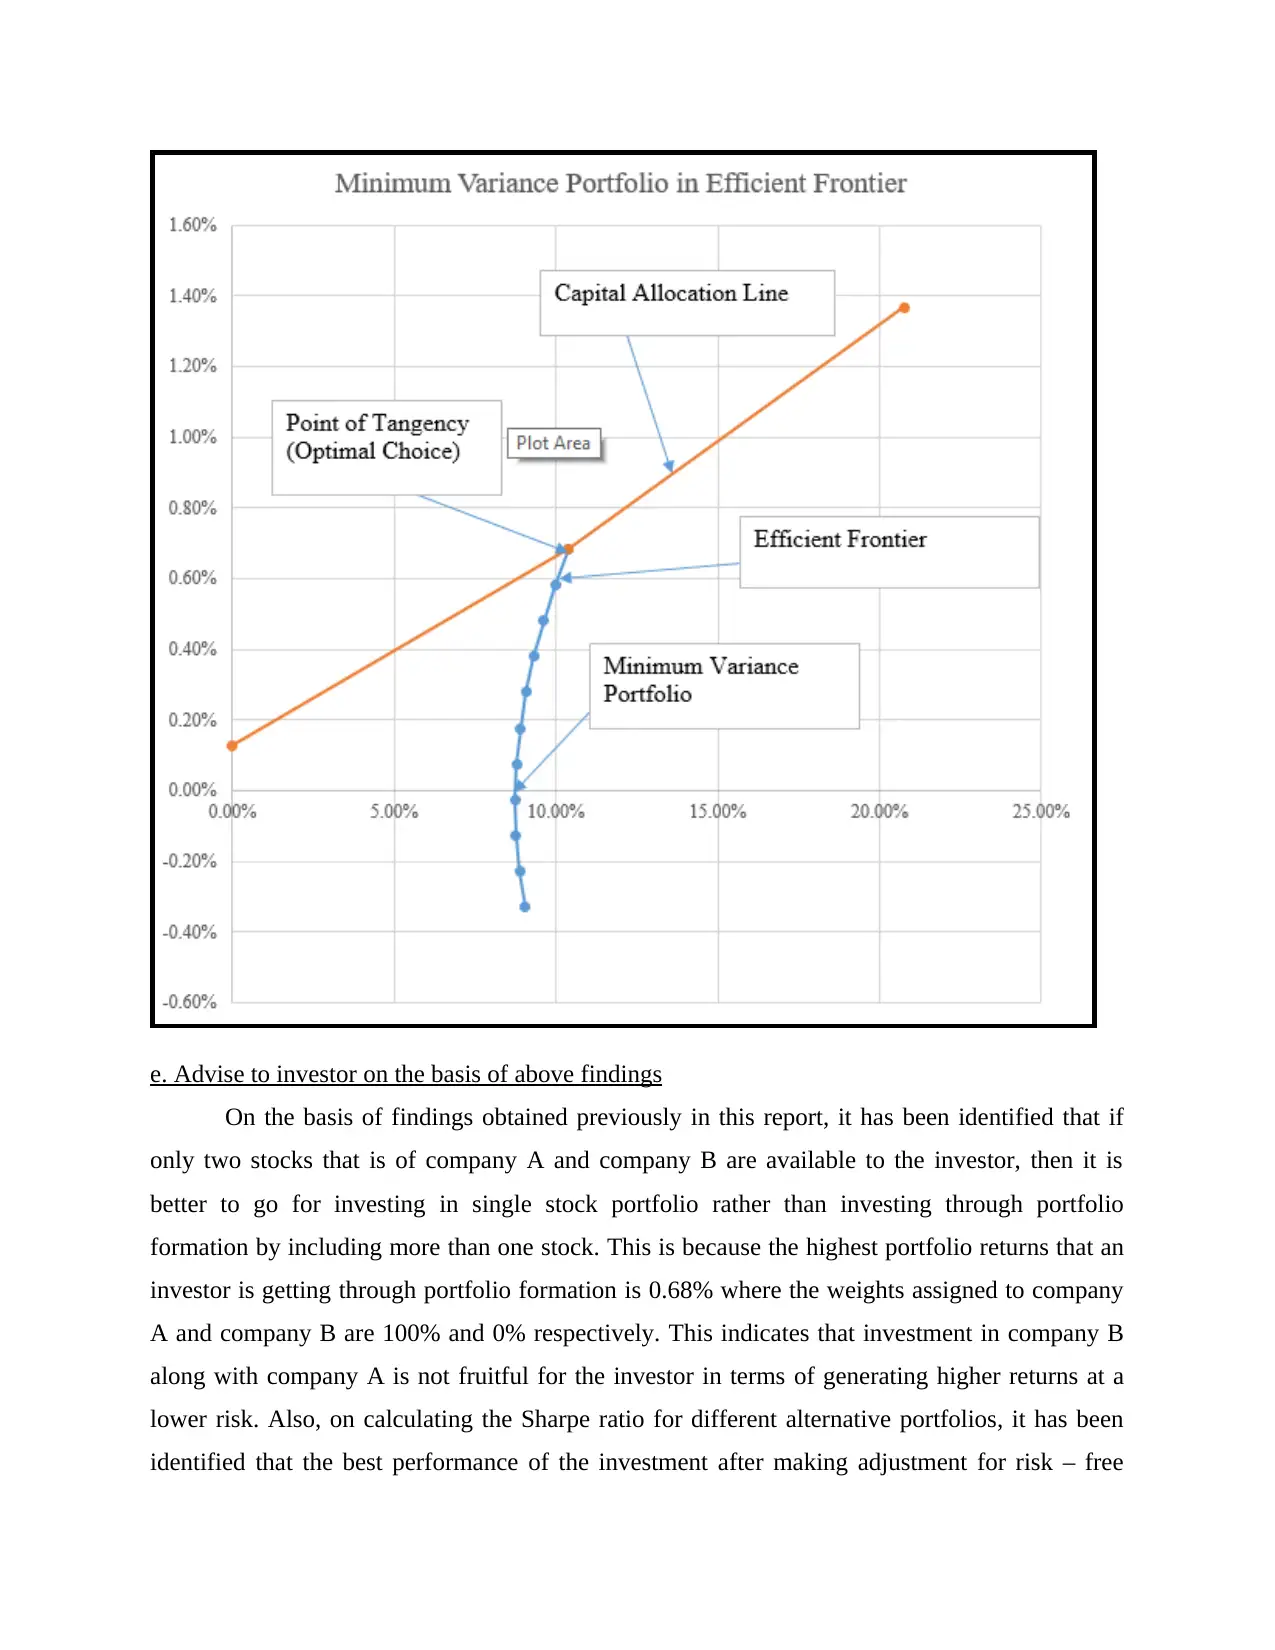
c. Indicating Efficient Frontier in a Trade – off graph
In the above graph, along with indicating efficient frontier, a point of tangency that is, the
optimal choice at which the investor would be in advantage has been shown. At this point, the
portfolio returns and portfolio standard deviation has been determined as 0.68% and 10.38%
which is possible if the 100% of the portfolio is dedicated towards company A. This is because at
any other point where company is also there in the portfolio, the investor would be at
disadvantage either in terms of lower returns of higher risk without rewards (Leković, Jakšić and
Gnjatović, 2020).
d. Minimum Variance Portfolio
Particulars Company A (BCS) Company B (STAN)
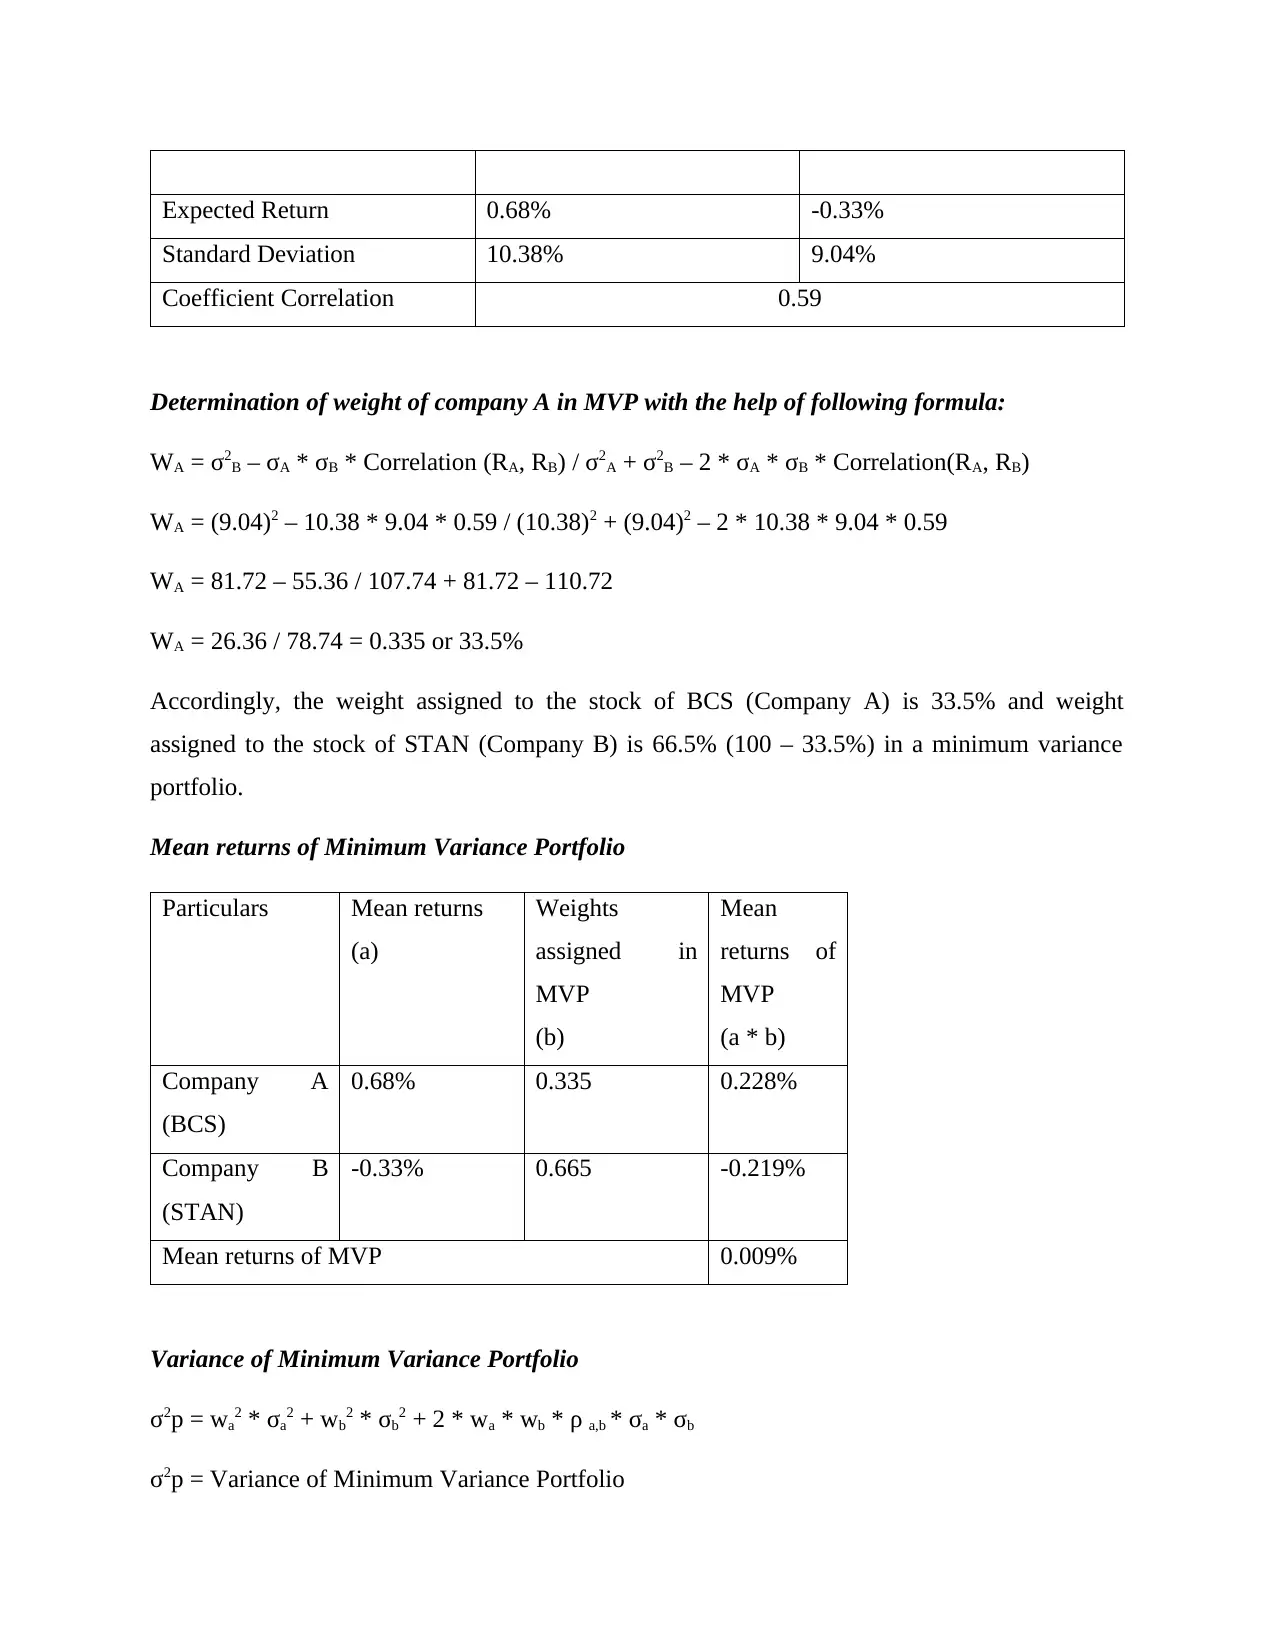
Expected Return 0.68% -0.33%
Standard Deviation 10.38% 9.04%
Coefficient Correlation 0.59
Determination of weight of company A in MVP with the help of following formula:
WA = σ2B – σA * σB * Correlation (RA, RB) / σ2A + σ2B – 2 * σA * σB * Correlation(RA, RB)
WA = (9.04)2 – 10.38 * 9.04 * 0.59 / (10.38)2 + (9.04)2 – 2 * 10.38 * 9.04 * 0.59
WA = 81.72 – 55.36 / 107.74 + 81.72 – 110.72
WA = 26.36 / 78.74 = 0.335 or 33.5%
Accordingly, the weight assigned to the stock of BCS (Company A) is 33.5% and weight
assigned to the stock of STAN (Company B) is 66.5% (100 – 33.5%) in a minimum variance
portfolio.
Mean returns of Minimum Variance Portfolio
Particulars Mean returns
(a)
Weights
assigned in
MVP
(b)
Mean
returns of
MVP
(a * b)
Company A
(BCS)
0.68% 0.335 0.228%
Company B
(STAN)
-0.33% 0.665 -0.219%
Mean returns of MVP 0.009%
Variance of Minimum Variance Portfolio
σ2p = wa2 * σa2 + wb2 * σb2 + 2 * wa * wb * ρ a,b * σa * σb
σ2p = Variance of Minimum Variance Portfolio
Secure Best Marks with AI Grader
Need help grading? Try our AI Grader for instant feedback on your assignments.
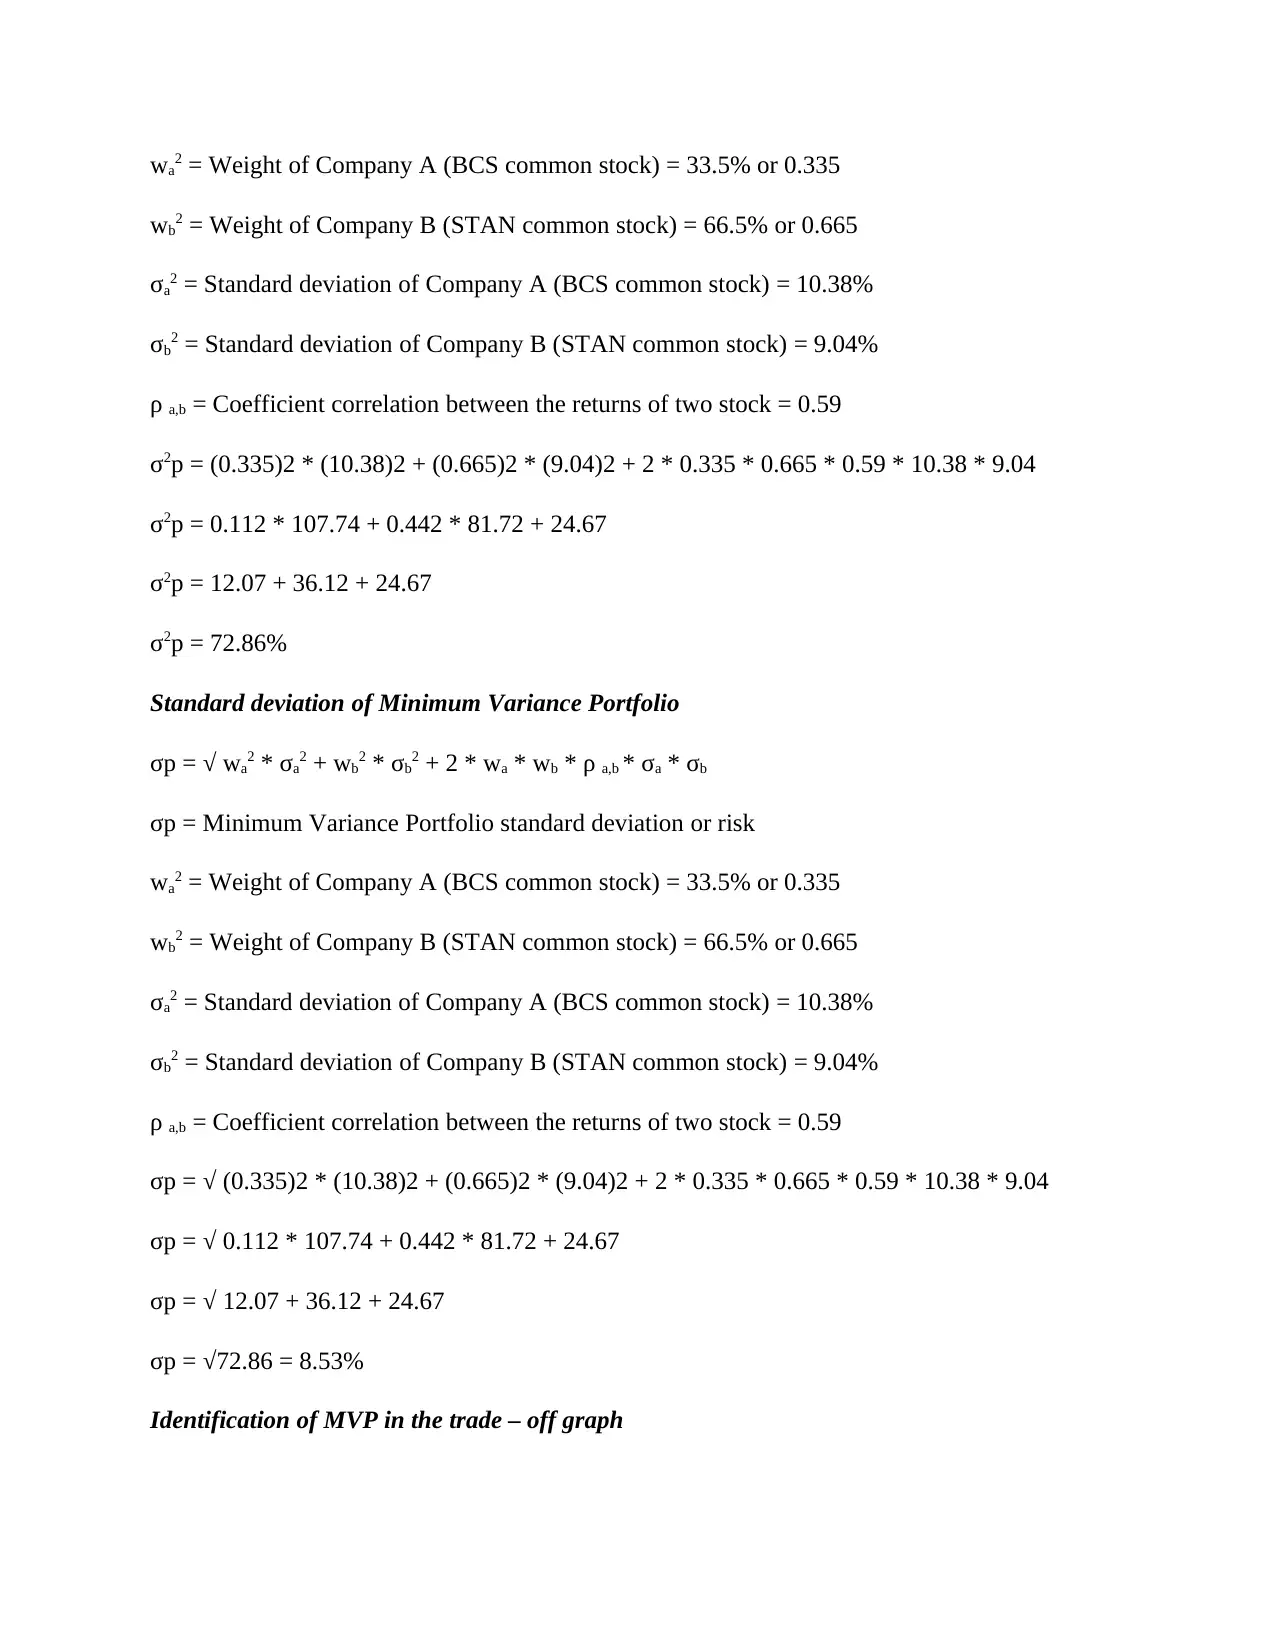
wa2 = Weight of Company A (BCS common stock) = 33.5% or 0.335
wb2 = Weight of Company B (STAN common stock) = 66.5% or 0.665
σa2 = Standard deviation of Company A (BCS common stock) = 10.38%
σb2 = Standard deviation of Company B (STAN common stock) = 9.04%
ρ a,b = Coefficient correlation between the returns of two stock = 0.59
σ2p = (0.335)2 * (10.38)2 + (0.665)2 * (9.04)2 + 2 * 0.335 * 0.665 * 0.59 * 10.38 * 9.04
σ2p = 0.112 * 107.74 + 0.442 * 81.72 + 24.67
σ2p = 12.07 + 36.12 + 24.67
σ2p = 72.86%
Standard deviation of Minimum Variance Portfolio
σp = √ wa2 * σa2 + wb2 * σb2 + 2 * wa * wb * ρ a,b * σa * σb
σp = Minimum Variance Portfolio standard deviation or risk
wa2 = Weight of Company A (BCS common stock) = 33.5% or 0.335
wb2 = Weight of Company B (STAN common stock) = 66.5% or 0.665
σa2 = Standard deviation of Company A (BCS common stock) = 10.38%
σb2 = Standard deviation of Company B (STAN common stock) = 9.04%
ρ a,b = Coefficient correlation between the returns of two stock = 0.59
σp = √ (0.335)2 * (10.38)2 + (0.665)2 * (9.04)2 + 2 * 0.335 * 0.665 * 0.59 * 10.38 * 9.04
σp = √ 0.112 * 107.74 + 0.442 * 81.72 + 24.67
σp = √ 12.07 + 36.12 + 24.67
σp = √72.86 = 8.53%
Identification of MVP in the trade – off graph
wb2 = Weight of Company B (STAN common stock) = 66.5% or 0.665
σa2 = Standard deviation of Company A (BCS common stock) = 10.38%
σb2 = Standard deviation of Company B (STAN common stock) = 9.04%
ρ a,b = Coefficient correlation between the returns of two stock = 0.59
σ2p = (0.335)2 * (10.38)2 + (0.665)2 * (9.04)2 + 2 * 0.335 * 0.665 * 0.59 * 10.38 * 9.04
σ2p = 0.112 * 107.74 + 0.442 * 81.72 + 24.67
σ2p = 12.07 + 36.12 + 24.67
σ2p = 72.86%
Standard deviation of Minimum Variance Portfolio
σp = √ wa2 * σa2 + wb2 * σb2 + 2 * wa * wb * ρ a,b * σa * σb
σp = Minimum Variance Portfolio standard deviation or risk
wa2 = Weight of Company A (BCS common stock) = 33.5% or 0.335
wb2 = Weight of Company B (STAN common stock) = 66.5% or 0.665
σa2 = Standard deviation of Company A (BCS common stock) = 10.38%
σb2 = Standard deviation of Company B (STAN common stock) = 9.04%
ρ a,b = Coefficient correlation between the returns of two stock = 0.59
σp = √ (0.335)2 * (10.38)2 + (0.665)2 * (9.04)2 + 2 * 0.335 * 0.665 * 0.59 * 10.38 * 9.04
σp = √ 0.112 * 107.74 + 0.442 * 81.72 + 24.67
σp = √ 12.07 + 36.12 + 24.67
σp = √72.86 = 8.53%
Identification of MVP in the trade – off graph
e. Advise to investor on the basis of above findings
On the basis of findings obtained previously in this report, it has been identified that if
only two stocks that is of company A and company B are available to the investor, then it is
better to go for investing in single stock portfolio rather than investing through portfolio
formation by including more than one stock. This is because the highest portfolio returns that an
investor is getting through portfolio formation is 0.68% where the weights assigned to company
A and company B are 100% and 0% respectively. This indicates that investment in company B
along with company A is not fruitful for the investor in terms of generating higher returns at a
lower risk. Also, on calculating the Sharpe ratio for different alternative portfolios, it has been
identified that the best performance of the investment after making adjustment for risk – free
asset would be realised at a point where 100% allocation is being made to the stock of company
A keeping weight assigned to company B as 0%. This shows profitable and optimal investment
opportunity for an investor.
On including a risk free asset in the portfolio, investor would get comparatively higher
returns at no additional risk. Also, risk – free asset would provide safety to the investor’s wealth
and thus there are lower returns attached with such assets (Pavolova and et.al., 2021).
Accordingly, an investor would be better off in terms of securing higher risk – adjusted returns
as there is no correlation of risk – free asset with that of other risky assets in the portfolio.
PART 2
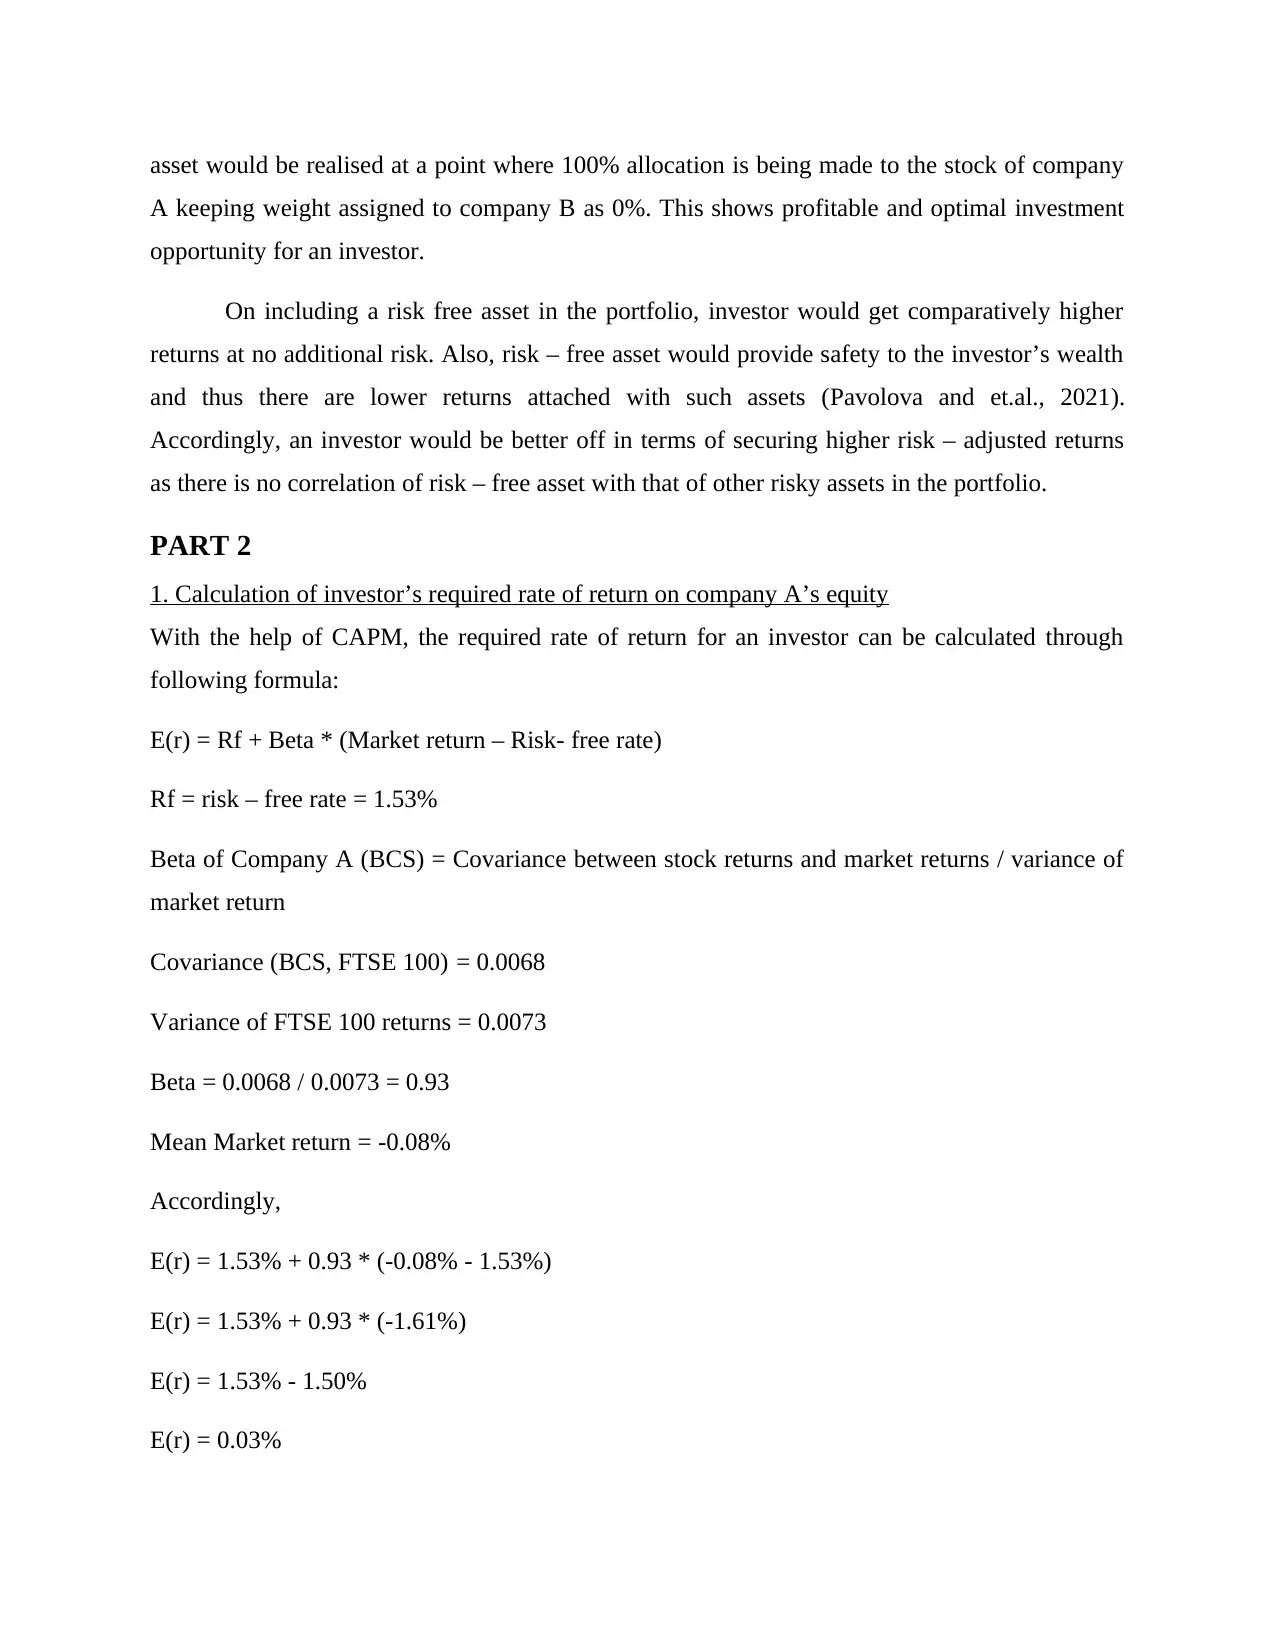
1. Calculation of investor’s required rate of return on company A’s equity
With the help of CAPM, the required rate of return for an investor can be calculated through
following formula:
E(r) = Rf + Beta * (Market return – Risk- free rate)
Rf = risk – free rate = 1.53%
Beta of Company A (BCS) = Covariance between stock returns and market returns / variance of
market return
Covariance (BCS, FTSE 100) = 0.0068
Variance of FTSE 100 returns = 0.0073
Beta = 0.0068 / 0.0073 = 0.93
Mean Market return = -0.08%
Accordingly,
E(r) = 1.53% + 0.93 * (-0.08% - 1.53%)
E(r) = 1.53% + 0.93 * (-1.61%)
E(r) = 1.53% - 1.50%
E(r) = 0.03%
A keeping weight assigned to company B as 0%. This shows profitable and optimal investment
opportunity for an investor.
On including a risk free asset in the portfolio, investor would get comparatively higher
returns at no additional risk. Also, risk – free asset would provide safety to the investor’s wealth
and thus there are lower returns attached with such assets (Pavolova and et.al., 2021).
Accordingly, an investor would be better off in terms of securing higher risk – adjusted returns
as there is no correlation of risk – free asset with that of other risky assets in the portfolio.
PART 2
1. Calculation of investor’s required rate of return on company A’s equity
With the help of CAPM, the required rate of return for an investor can be calculated through
following formula:
E(r) = Rf + Beta * (Market return – Risk- free rate)
Rf = risk – free rate = 1.53%
Beta of Company A (BCS) = Covariance between stock returns and market returns / variance of
market return
Covariance (BCS, FTSE 100) = 0.0068
Variance of FTSE 100 returns = 0.0073
Beta = 0.0068 / 0.0073 = 0.93
Mean Market return = -0.08%
Accordingly,
E(r) = 1.53% + 0.93 * (-0.08% - 1.53%)
E(r) = 1.53% + 0.93 * (-1.61%)
E(r) = 1.53% - 1.50%
E(r) = 0.03%
Paraphrase This Document
Need a fresh take? Get an instant paraphrase of this document with our AI Paraphraser
2. Valuation of company A’s equity
In order to determine the equity value of company A, dividend discount model has been
chosen. It is the method of stock evaluation where by predicting future dividends and
discounting them at an investor’s required rate of return, the present value of company’s equity
can be determined (Bulkley and et.al., 2021). The dividend policy of the company is such where
dividends are declared on half yearly basis that is in February & August, while the payment of
this declared dividend is done on annual basis at the end of year. Also, the company has variable
dividend growth model which get changed with the market and company own condition.
Therefore, the expected dividend to be declared by Barclays for the year 2022 is 6p. On the
basis of this dividend, the present equity value of company can be determined as follows:
PV0 = D1 / (1 + r)1
D1 = 6p
r = investor’s required rate of return = 0.03%
PV0 = = 6 / (1 + 0.03%)1
PV0 = 6 / 1.0003 = 5.998 or 6.
Therefore, the equity value of company A based on their expected dividend payment for the
upcoming year is 6.
3. Comparison of calculated equity value with market value (or current stock price) of the
company
The determined equity value of company A on the basis of dividend discount model is $6
while the current market price of company A’s stock is 7.28. Therefore, it can be said that the
stock is little bit overvalued. This indicates that investors are ready to pay more for company’s
stock may be due to their earning potential or better growth prospects in the future (Liu, 2021).
REFERENCES
Books and Journals
Augar, P., 2018. The bank that lived a little: Barclays in the age of the very free market. Penguin
UK.
Bulkley, K. E., and et.al., 2021. Challenging the One Best System: The portfolio management
model and urban school governance. Harvard Education Press.
Chiang, T. C. and Zhang, Y., 2018. An empirical investigation of risk-return relations in chinese
equity markets: Evidence from aggregate and sectoral data. International Journal of
Financial Studies. 6(2). p.35.
Chiang, T. C., 2019. Economic policy uncertainty, risk and stock returns: Evidence from G7
stock markets. Finance Research Letters. 29(C). pp.41-49.
Jun, B. W. and Yoon, S. M., 2020. Foreign banks acquisition strategy and the business approach
of domestic bank: a case of standard chartered bank. Asian Economic and Financial
Review. 10(7). pp.861-874.
Leković, M., Jakšić, M. M. and Gnjatović, D., 2020. Portfolio performance evaluation of mutual
funds in the Republic of Serbia. Serbian Journal of Management.
Liu, W., 2021. Risk-Aware Financial Portfolio Management with Distributional Deep
Deterministic Policy Gradient (Doctoral dissertation, University of Toronto (Canada)).
Mbai, E., Ngui, T. and Ndiao, O., 2018. Competitive strategies implementation and quality
service delivery in Standard Chartered Bank (K) Ltd. International Academic Journal of
Human Resource and Business Administration. 3(1). pp.246-265.
Nyanaro, N. N. and Bett, S., 2018. Influence of strategic planning on performance of commercial
banks in Kenya: Case of Barclays Bank of Kenya. International Academic Journal of
Human Resource and Business Administration. 3(2). pp.235-255.
Pavolova, H., and et.al., 2021. The analysis of investment into industries based on portfolio
managers. Acta Montanistica Slovaca, 26(1).

Singh, S. and Yadav, S. S., 2021. Diversification of Risk. In Security Analysis and Portfolio
Management (pp. 255-294). Springer, Singapore.
Management (pp. 255-294). Springer, Singapore.
1 out of 16
Related Documents


Your All-in-One AI-Powered Toolkit for Academic Success.
+13062052269
info@desklib.com
Available 24*7 on WhatsApp / Email
![[object Object]](/_next/static/media/star-bottom.7253800d.svg)
Unlock your academic potential
© 2024 | Zucol Services PVT LTD | All rights reserved.