Data Analysis of MLB Baseball Performance: BA1530 Report

Verified

Added on  2022/08/20

|20
|3524
|378
Report
AI Summary
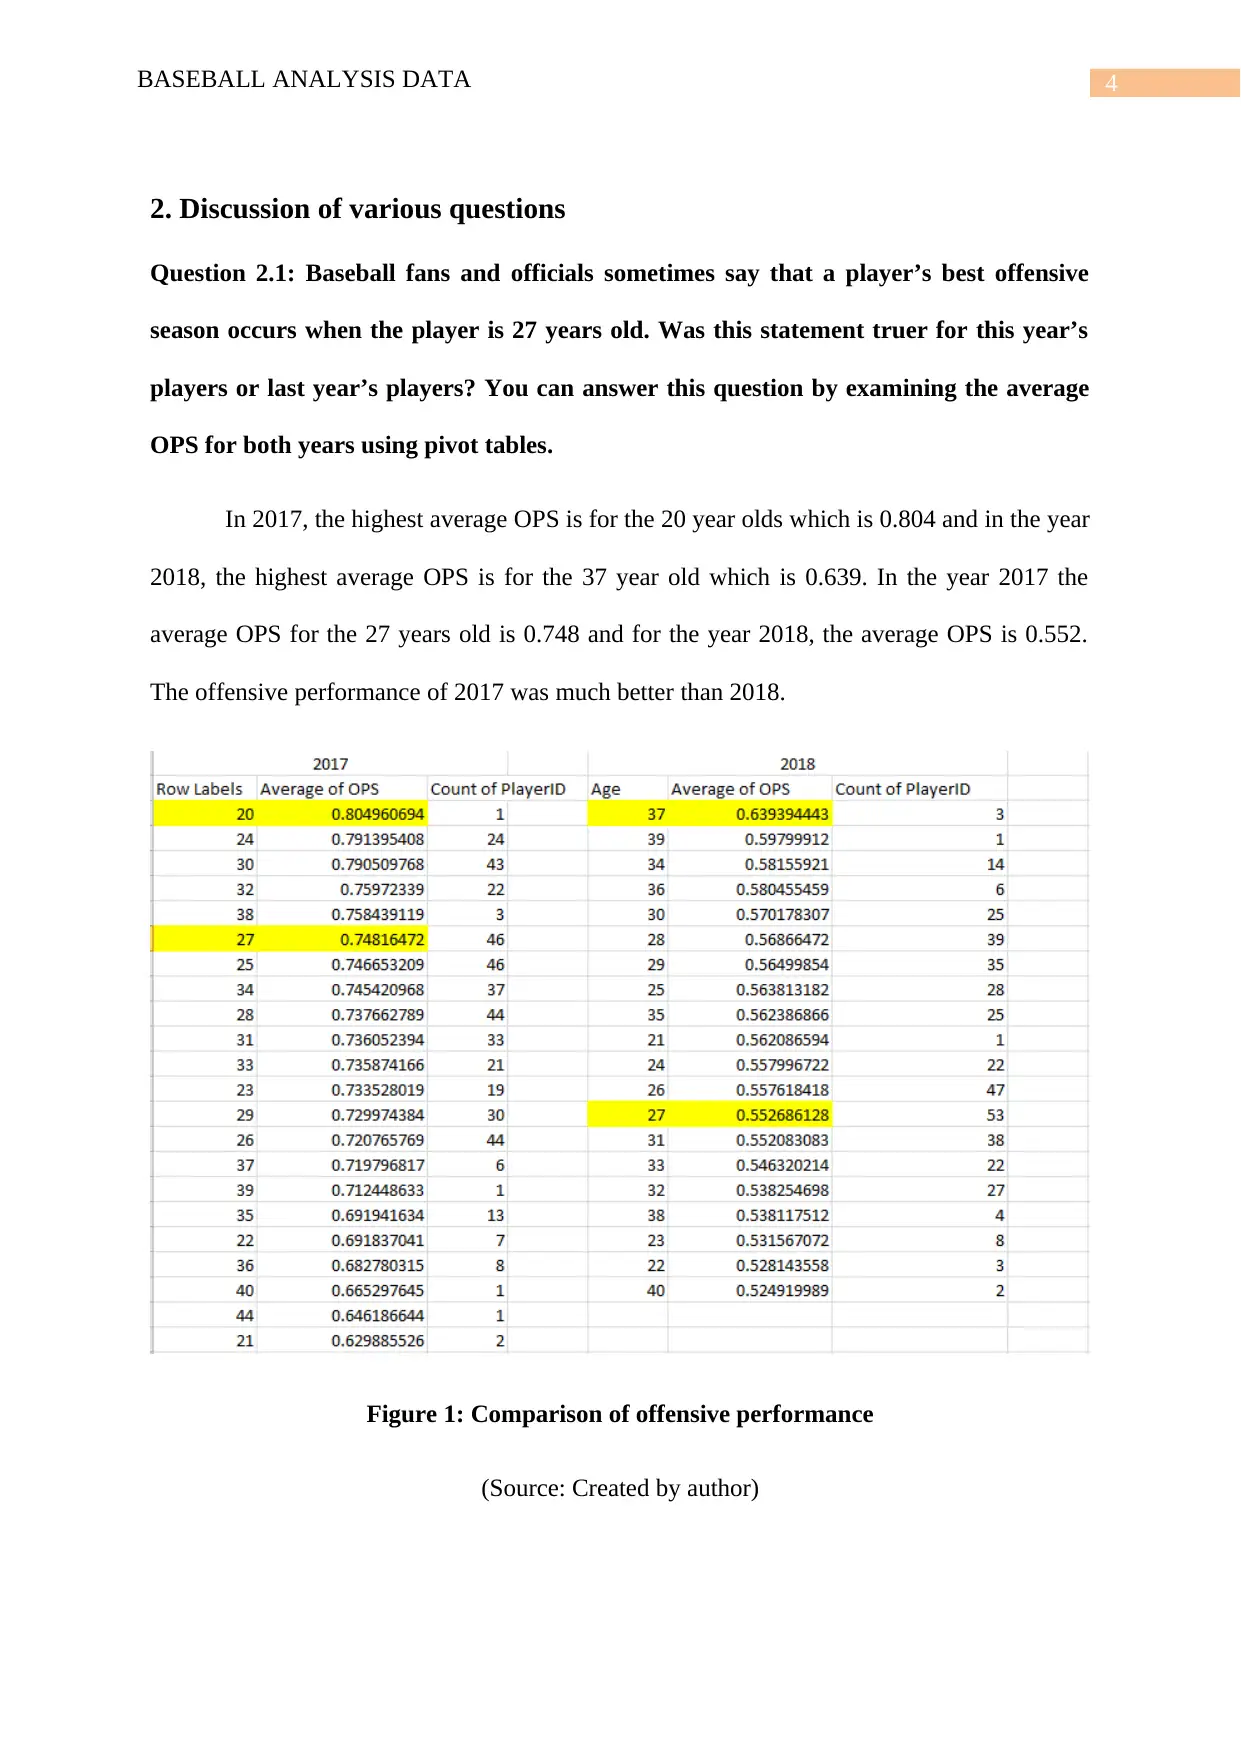
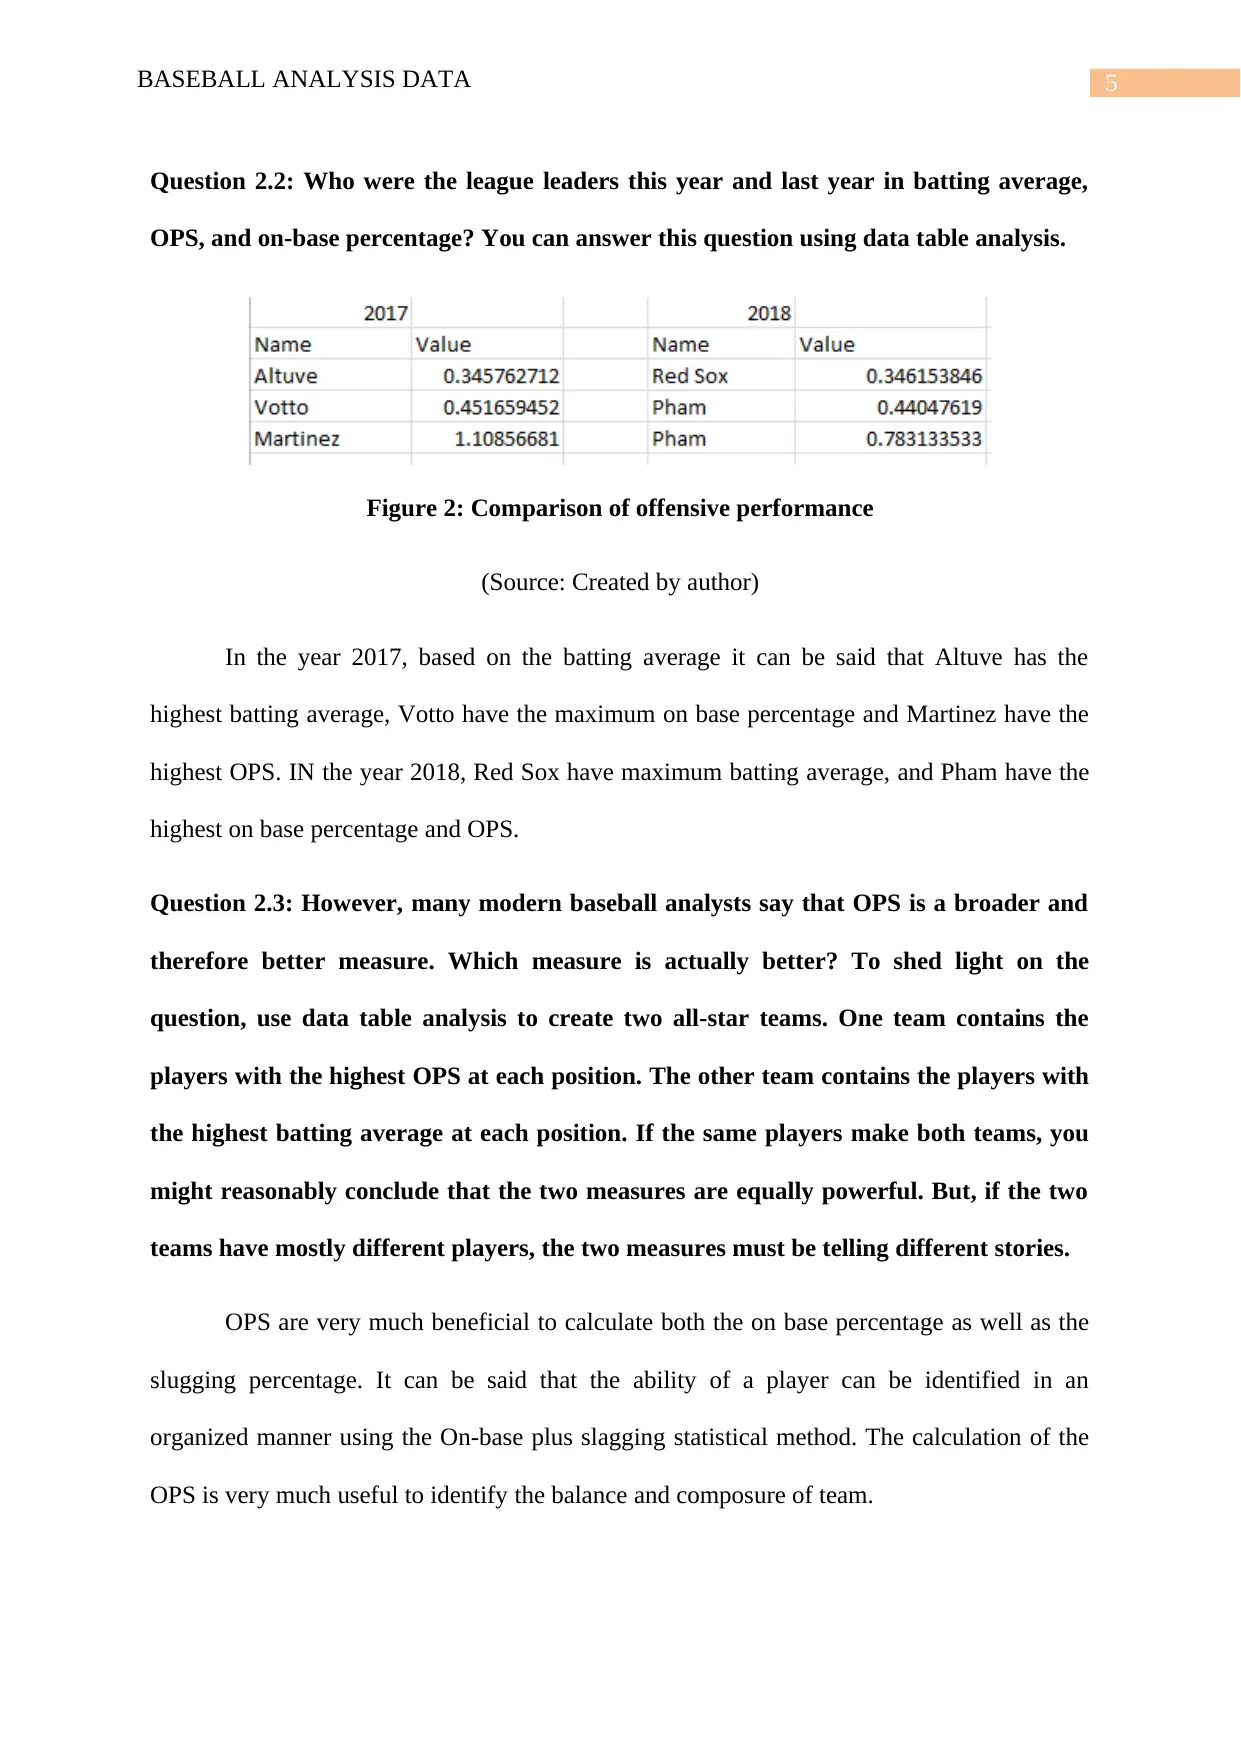
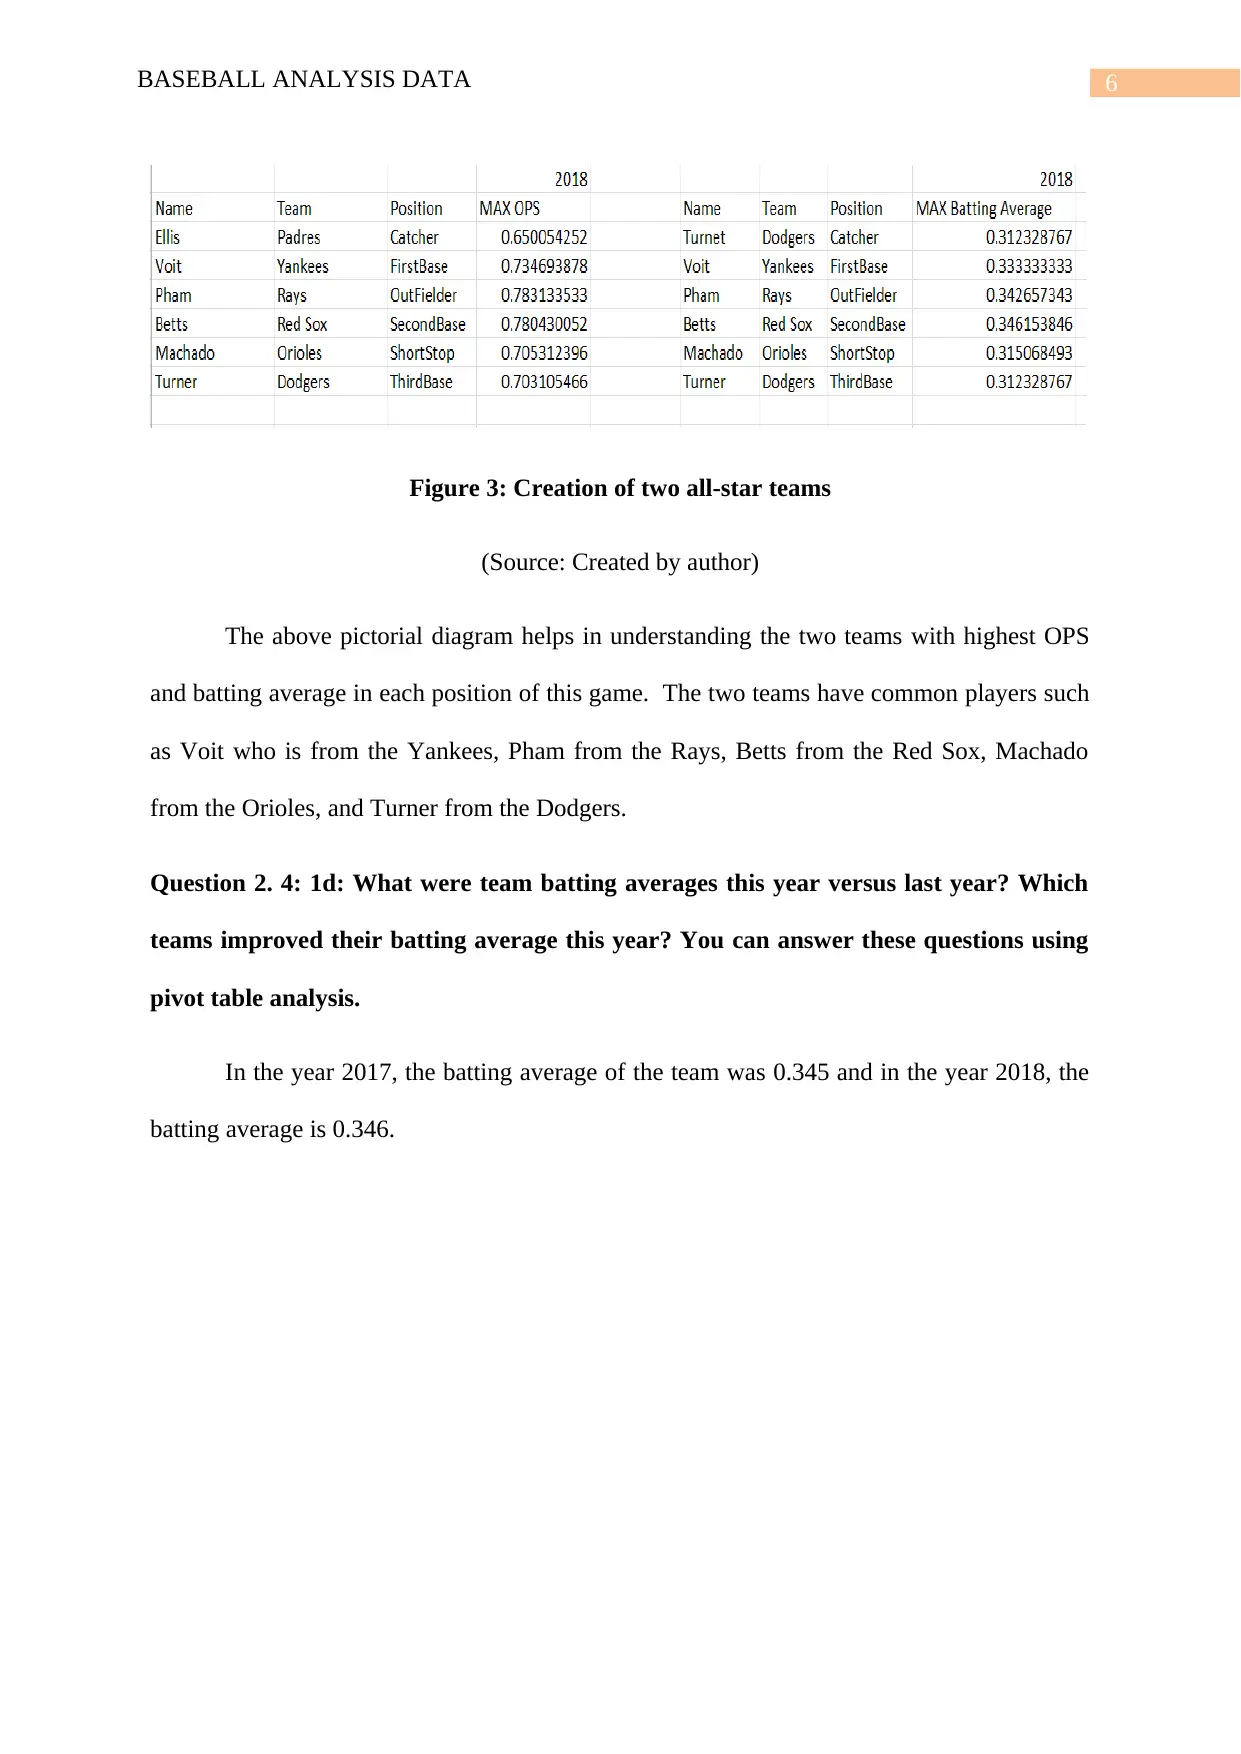
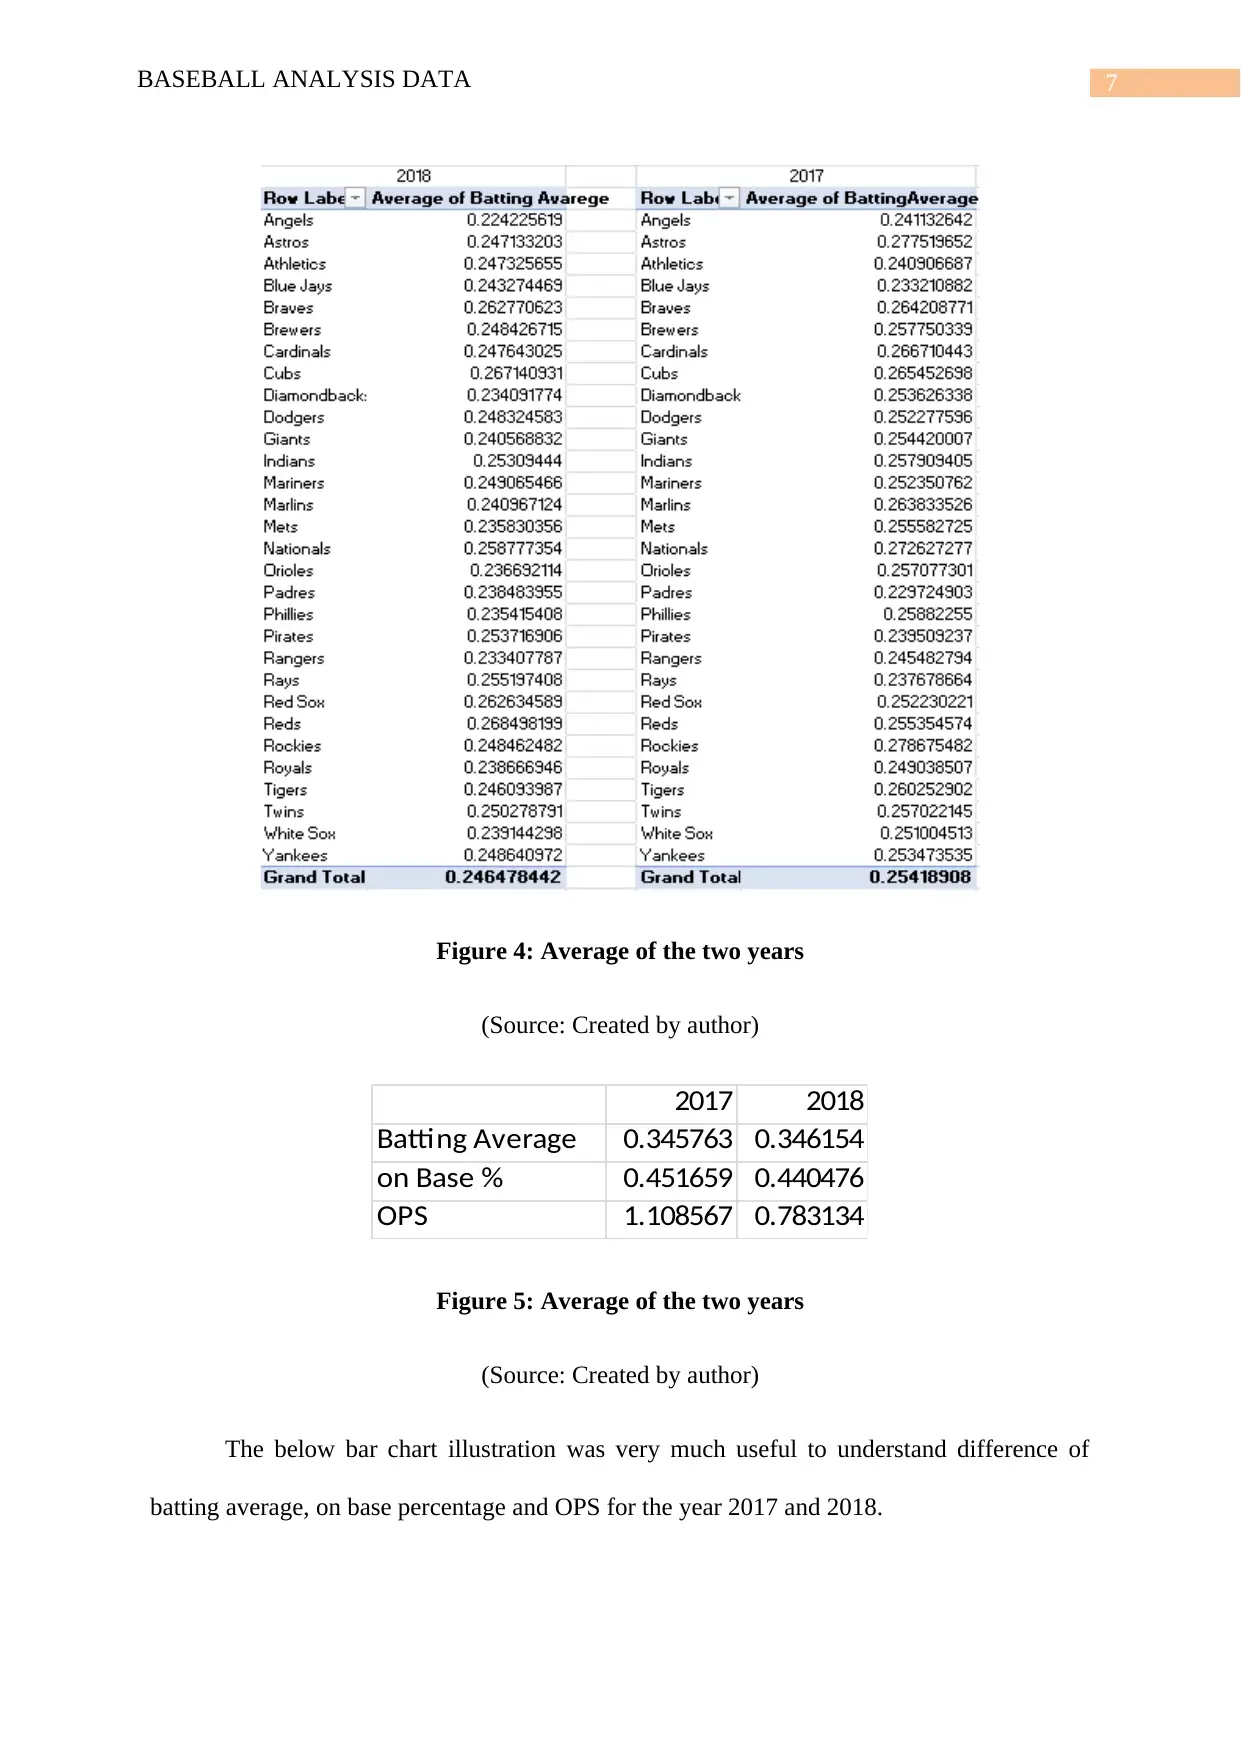
This report provides a comprehensive analysis of MLB baseball data, focusing on offensive performance between 2017 and 2018. The analysis utilizes MS Excel to evaluate various aspects, including batting averages, on-base percentages, and OPS, to answer key questions about player and team performance. The report examines the impact of age on offensive output, identifies league leaders in different statistical categories, and compares the effectiveness of different performance measures. Furthermore, it explores team batting averages, identifies teams that improved, and delves into year-to-year offensive performance changes. The study also discusses policy implications for baseball and explores the enactment of an Information System (IS) to track rule changes and automate analysis. The results indicate that Red Sox have the maximum average rate of batting while Pham have reached the highest in terms of base percentage. The report concludes with an assessment of the limitations of the analysis and provides recommendations for future studies. This assignment is a valuable resource for students seeking insights into baseball data analysis and related topics, offering a practical application of data analytics techniques.
Document Page
Running head: BASEBALL ANALYSIS DATA
Baseball Analysis Data
tabler-icon-diamond-filled.svg

Paraphrase This Document

Need a fresh take? Get an instant paraphrase of this document with our AI Paraphraser
Document Page
1BASEBALL ANALYSIS DATA
Executive Summary
The discussion within the business report is primarily focused on performing a brief analysis
over the decreasing performance within the MLB players association. The initial part of
discussion within the report focuses on the purpose of performing the analysis and the
analytical method that would be used for the chosen case. The discussion then proceeds with
answering some critical questions based on analysing over the presented data set. Further,
policy implications have been presented over baseball and analysis over data. In the next
sections of the report, a discussion over the enactment of IS has been discussed. It presents a
purpose of the used analytical method and defines the scope of the proposal. A timeline for
completion of the entire data analysis has been presented in a chart form. Limitations of
performing the data analysis have also been presented based on the data set. Thus, based on
the analysis over the presented data set, the results generated have shown that Red Sox have
the maximum average rate of batting while Pham have reached the highest in terms of base
percentage. From the results, it can be discussed that 8 teams have increased their
performance level since 2017, which has led to increase in the overall team performance.
Document Page
2BASEBALL ANALYSIS DATA
Table of Contents
1. Introduction............................................................................................................................3
1.1 Outline the situation.........................................................................................................3
1.2 Purpose of the analysis.....................................................................................................3
1.3 Purpose of analytical method...........................................................................................3
2. Discussion of various questions.............................................................................................4
2.1 Data Table Analysis.........................................................................................................9
3. Policy implication for baseball.............................................................................................11
4. Enactment of IS....................................................................................................................12
4.1 Introduction................................................................................................................12
4.2 Purpose of the analytical method...............................................................................12
4.3 Scope of the proposal.................................................................................................13
4.5 Significance of office information systems................................................................13
4.7 Ways to enact the IS...................................................................................................14
4.8 Timeline of the project...............................................................................................14
4.9 Summary....................................................................................................................15
4.10 Limitations...............................................................................................................15
5. Conclusion............................................................................................................................15
6. References............................................................................................................................17
Document Page
3BASEBALL ANALYSIS DATA
1. Introduction
The science of analysing a complex raw data can be termed as data analytics. There
are diverse categories of tools which are used in data analytics such as Excel and Apache
Spark (Kermanshach and Rouhanizadeh 2018). The data set provided from the university
shall be evaluated using Excel.
1.1 Outline the situation
The balls in play as well as the runs of this game were decreasing in the last two years
which was a huge source of concern for the MLB players association and the Major League
Baseball.
1.2 Purpose of the analysis
The prime objective of this analysis is to enhance the pace of play and the offensive
performance (OP) during the season. This analysis will be very much useful for this
association as it will reflect the performance of the teams on two consecutive seasons. The
data which will be obtained after the analysis can be very much useful for the strategic
planners of this organization to deal with the performance issue of the players of this
association.
1.3 Purpose of analytical method
The major purpose of the analytical method which was done using MS Excel was to
compare the offensive performance of two baseball seasons. This analytical method shall also
be very much useful to answer the questions connected with this OP of the players for the
year 2017 and 2018.
tabler-icon-diamond-filled.svg

Paraphrase This Document

Need a fresh take? Get an instant paraphrase of this document with our AI Paraphraser
Document Page
4BASEBALL ANALYSIS DATA
2. Discussion of various questions
Question 2.1: Baseball fans and officials sometimes say that a player’s best offensive
season occurs when the player is 27 years old. Was this statement truer for this year’s
players or last year’s players? You can answer this question by examining the average
OPS for both years using pivot tables.
In 2017, the highest average OPS is for the 20 year olds which is 0.804 and in the year
2018, the highest average OPS is for the 37 year old which is 0.639. In the year 2017 the
average OPS for the 27 years old is 0.748 and for the year 2018, the average OPS is 0.552.
The offensive performance of 2017 was much better than 2018.
Figure 1: Comparison of offensive performance
(Source: Created by author)
Document Page
5BASEBALL ANALYSIS DATA
Question 2.2: Who were the league leaders this year and last year in batting average,
OPS, and on-base percentage? You can answer this question using data table analysis.
Figure 2: Comparison of offensive performance
(Source: Created by author)
In the year 2017, based on the batting average it can be said that Altuve has the
highest batting average, Votto have the maximum on base percentage and Martinez have the
highest OPS. IN the year 2018, Red Sox have maximum batting average, and Pham have the
highest on base percentage and OPS.
Question 2.3: However, many modern baseball analysts say that OPS is a broader and
therefore better measure. Which measure is actually better? To shed light on the
question, use data table analysis to create two all-star teams. One team contains the
players with the highest OPS at each position. The other team contains the players with
the highest batting average at each position. If the same players make both teams, you
might reasonably conclude that the two measures are equally powerful. But, if the two
teams have mostly different players, the two measures must be telling different stories.
OPS are very much beneficial to calculate both the on base percentage as well as the
slugging percentage. It can be said that the ability of a player can be identified in an
organized manner using the On-base plus slagging statistical method. The calculation of the
OPS is very much useful to identify the balance and composure of team.
Document Page
6BASEBALL ANALYSIS DATA
Figure 3: Creation of two all-star teams
(Source: Created by author)
The above pictorial diagram helps in understanding the two teams with highest OPS
and batting average in each position of this game. The two teams have common players such
as Voit who is from the Yankees, Pham from the Rays, Betts from the Red Sox, Machado
from the Orioles, and Turner from the Dodgers.
Question 2. 4: 1d: What were team batting averages this year versus last year? Which
teams improved their batting average this year? You can answer these questions using
pivot table analysis.
In the year 2017, the batting average of the team was 0.345 and in the year 2018, the
batting average is 0.346.
tabler-icon-diamond-filled.svg

Paraphrase This Document

Need a fresh take? Get an instant paraphrase of this document with our AI Paraphraser
Document Page
7BASEBALL ANALYSIS DATA
Figure 4: Average of the two years
(Source: Created by author)
2017 2018
Batting Average 0.345763 0.346154
on Base % 0.451659 0.440476
OPS 1.108567 0.783134
Figure 5: Average of the two years
(Source: Created by author)
The below bar chart illustration was very much useful to understand difference of
batting average, on base percentage and OPS for the year 2017 and 2018.
Document Page
8BASEBALL ANALYSIS DATA
Batting Average on Base % OPS
2017
2018
Figure 6: Comparative Analysis
(Source: Created by author)
Document Page
9BASEBALL ANALYSIS DATA
2e. Use of countif ()
Figure 6: Performance improvement
(Source: Created by author)
The above pictorial illustration highlights the whether the batting average of the teams
enhanced in 2018 from 2017 or not. The team which have not improved in 2018 are Astros,
Angels, Cardinals, Brewers, Braves, Yankees, White Sox, Twins, Tigers, Royals, Rockies,
Rangers, Phillies, Orioles, Nationals, Mets, Marlins, Mariners, Indian, Giants, and Dodgers.
On the other hand, there are few teams like Blue Jays, Cubs, Padres, Pirates, Rays, Red Sox,
Reds. And out of each of this team only 8 of them have enhanced their performance in 2018.
2.1 Data Table Analysis
Question 2.2.5 3C: Enter a note below the data that describes the change in year-to-year
offensive performance. You should note averages for plate appearances (PA), Total
tabler-icon-diamond-filled.svg

Paraphrase This Document

Need a fresh take? Get an instant paraphrase of this document with our AI Paraphraser
Document Page
10BASEBALL ANALYSIS DATA
Bases, Batting Average and OPS are positive indicators of offensive performance, while
strikeouts(SO) is a negative indicator of offensive performance.
The following table will be very much useful to identify the averages strikeouts PA,
total bases, batting average and strike outs of the year 2017 and 2018.
Year PA Total Base Batting Avarege OPS SO
2017 375.71 148.29 0.25 0.74 78.77
2018 386.84 88.07 0.25 0.56 82.25
Figure 7: Year to year offensive performance
(Source: Created by author)
The plate average of 2018 is more than 2017, whereas the total base of 2017 is much
better than 2018. The battering average of both the year is similar to each other. The strikeout
of 2018 is found to be 82.25 whereas the strikeout for the year 2017 was 78.77.
Document Page
11BASEBALL ANALYSIS DATA
1D: Enter a note below the all-star team data that states your conclusion. Do the two
performance measures essentially lead to the same teams or not?
Most of the players are from the same team, the lists of names of the common players are
Voit from the Yankees, Pham from the Rays, Betts from the Red Sox, Machado from Orioles,
and Turner from Dodger’s. The below pictorial descriptions helps in understanding that
considering the two performance measures like OPS and batting average can lead to same
Teams.
Figure 8: Year to year
(Source: Created by author)
3. Policy implication for baseball
It can be said that the enactment of a professional policy is very much required for the
enactment of a new IS (Mingyi 2018). It can also be said that the role of the government and
its regulations are also very much significant for the incorporation of a new IS (Newman et
al. 2018). The introduction of the anti-trust laws is also very much useful to deal with the
issues which are generally faced by the user of the system (Dubbs 2018). The concept of pay
and performance can be also be beneficial to control both the fluctuation of the sports market
as well.
chevron_up_icon
1 out of 20
circle_padding
hide_on_mobile
zoom_out_icon
[object Object]