BEA1009 Introduction to Quantitative Methods: Assignment 3 Analysis
VerifiedAdded on 2023/01/20
|10
|1843
|25
Homework Assignment
AI Summary
This document presents a comprehensive solution to Assignment 3 for the BEA1009 Introduction to Quantitative Methods course. It addresses a range of quantitative concepts, including cost and revenue analysis, graphing techniques, and break-even point calculations. The solution includes detail...
BEA1009 Introduction to Quantitative Methods Due Date: Wednesday 1st May, 11:59pm
UPP075/XAB090 Bridging Maths (BUSINESS) Total marks: 50
NAME:
WRITTEN ASSIGNMENT 3: 2019 Semester 1 (BUSINESS)
Learning Objectives 5.1 – 7.6
Please read the instructions carefully before you begin this assessment task
For further information please see the Assessment Information folder in MyLO Content.
INSTRUCTIONS:
• Please hand-write your answers in the spaces provided.
• This assignment is marked out of 50
– 45 marks for the worked solutions to each question
– 5 marks for mathematical communication (see MyLO for more information)
• Attempt all questions and show all working out to gain full marks. Partial marks are
available for workings even where the correct answer is not given.
• Academic Honesty – when completing this assignment you are required to comply with the
University statement on Academic Integrity for Students on the University this
includes not copying the work of or working with other students/persons/3rd parties.
• If you need help please go to a Maths Help Session (on-campus and distance students) or
contact your distance tutor (distance students only)
• Scan in your assignment as a single PDF file (please do NOT upload separate pages –
these will not be marked)
• Submit your work to MyLO Assignments on or before the due date (see MyLO for late
submission information). Late assignments will have a 5% penalty per day applied.
Assignments more than 5 days late will not be accepted for marking.
• Keep a hardcopy of your assignment (just in case!)
• Complete this checklist before submitting your work:
Submission Checklist: Check (tick):
Pages are in the correct order
All pages are the right way up
All pages are clear and easy to read
Assignment is saved as a single PDF file
Paraphrase This Document
Need a fresh take? Get an instant paraphrase of this document with our AI Paraphraser
Marks for mathematical communication (out
of 5):
(To be completed by your tutor)
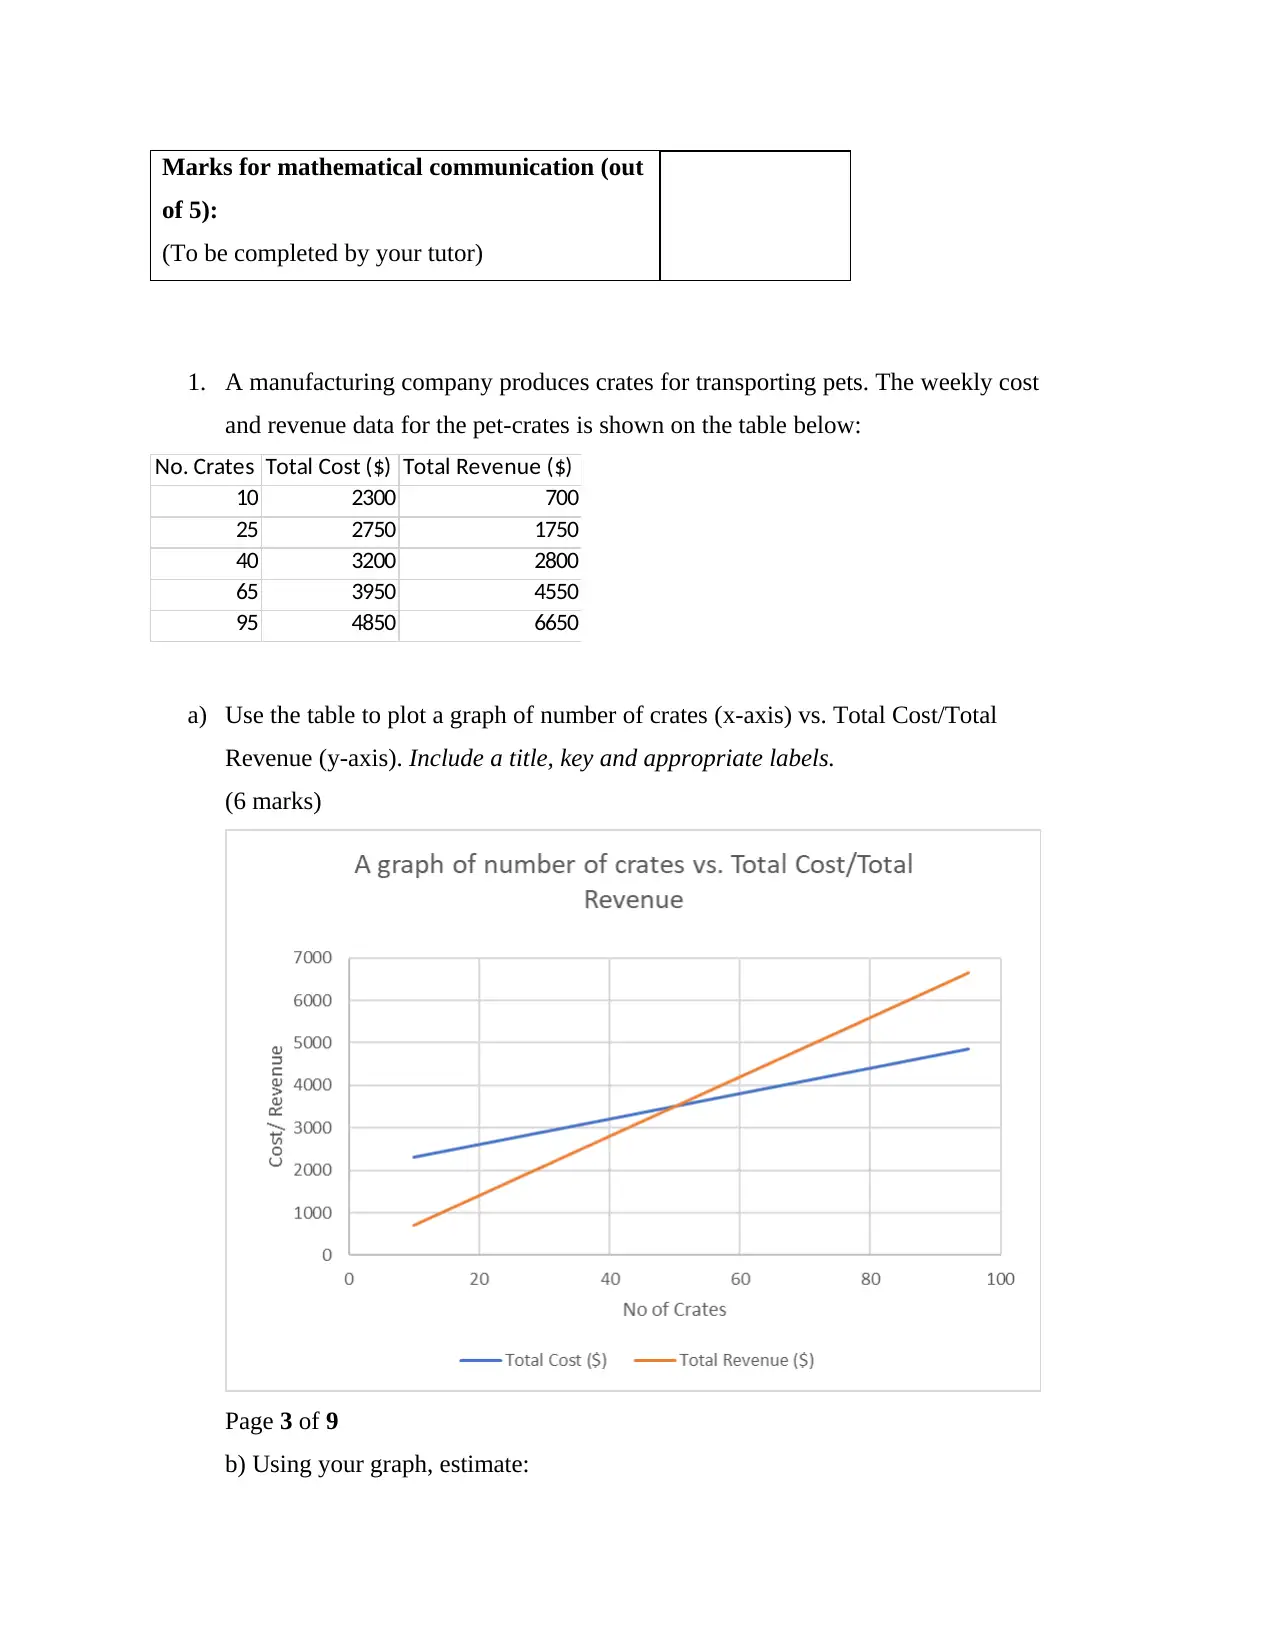
1. A manufacturing company produces crates for transporting pets. The weekly cost
and revenue data for the pet-crates is shown on the table below:
No. Crates Total Cost ($) Total Revenue ($)
10 2300 700
25 2750 1750
40 3200 2800
65 3950 4550
95 4850 6650
a) Use the table to plot a graph of number of crates (x-axis) vs. Total Cost/Total
Revenue (y-axis). Include a title, key and appropriate labels.
(6 marks)
Page 3 of 9
b) Using your graph, estimate:
of 5):
(To be completed by your tutor)
1. A manufacturing company produces crates for transporting pets. The weekly cost
and revenue data for the pet-crates is shown on the table below:
No. Crates Total Cost ($) Total Revenue ($)
10 2300 700
25 2750 1750
40 3200 2800
65 3950 4550
95 4850 6650
a) Use the table to plot a graph of number of crates (x-axis) vs. Total Cost/Total
Revenue (y-axis). Include a title, key and appropriate labels.
(6 marks)
Page 3 of 9
b) Using your graph, estimate:
i. The number of crates that need to be sold in a week for the
manufacturer to break-even.
At the breakeven point, the total revenue earned from the sales equals the total
cost of sales.
The number of crates at this point is 50 crates.
ii. The fixed costs associated with manufacturing the crates.
(2 marks)
Fixed cost is obtained when the number of crates equal to zero. To get this value
from the graph the total cost line graph is extended to touch the y axis at point (0,
2000). Hence the fixed cost is $ 2000
c) Find the variable cost for producing each crate. Give your answer to the
nearest dollar.
(2 marks)
The equation of the graph of cost is y=30 x +2000
This shows that 30 is the gradient if the line hence the varaible production cost us $ 30
per crate.
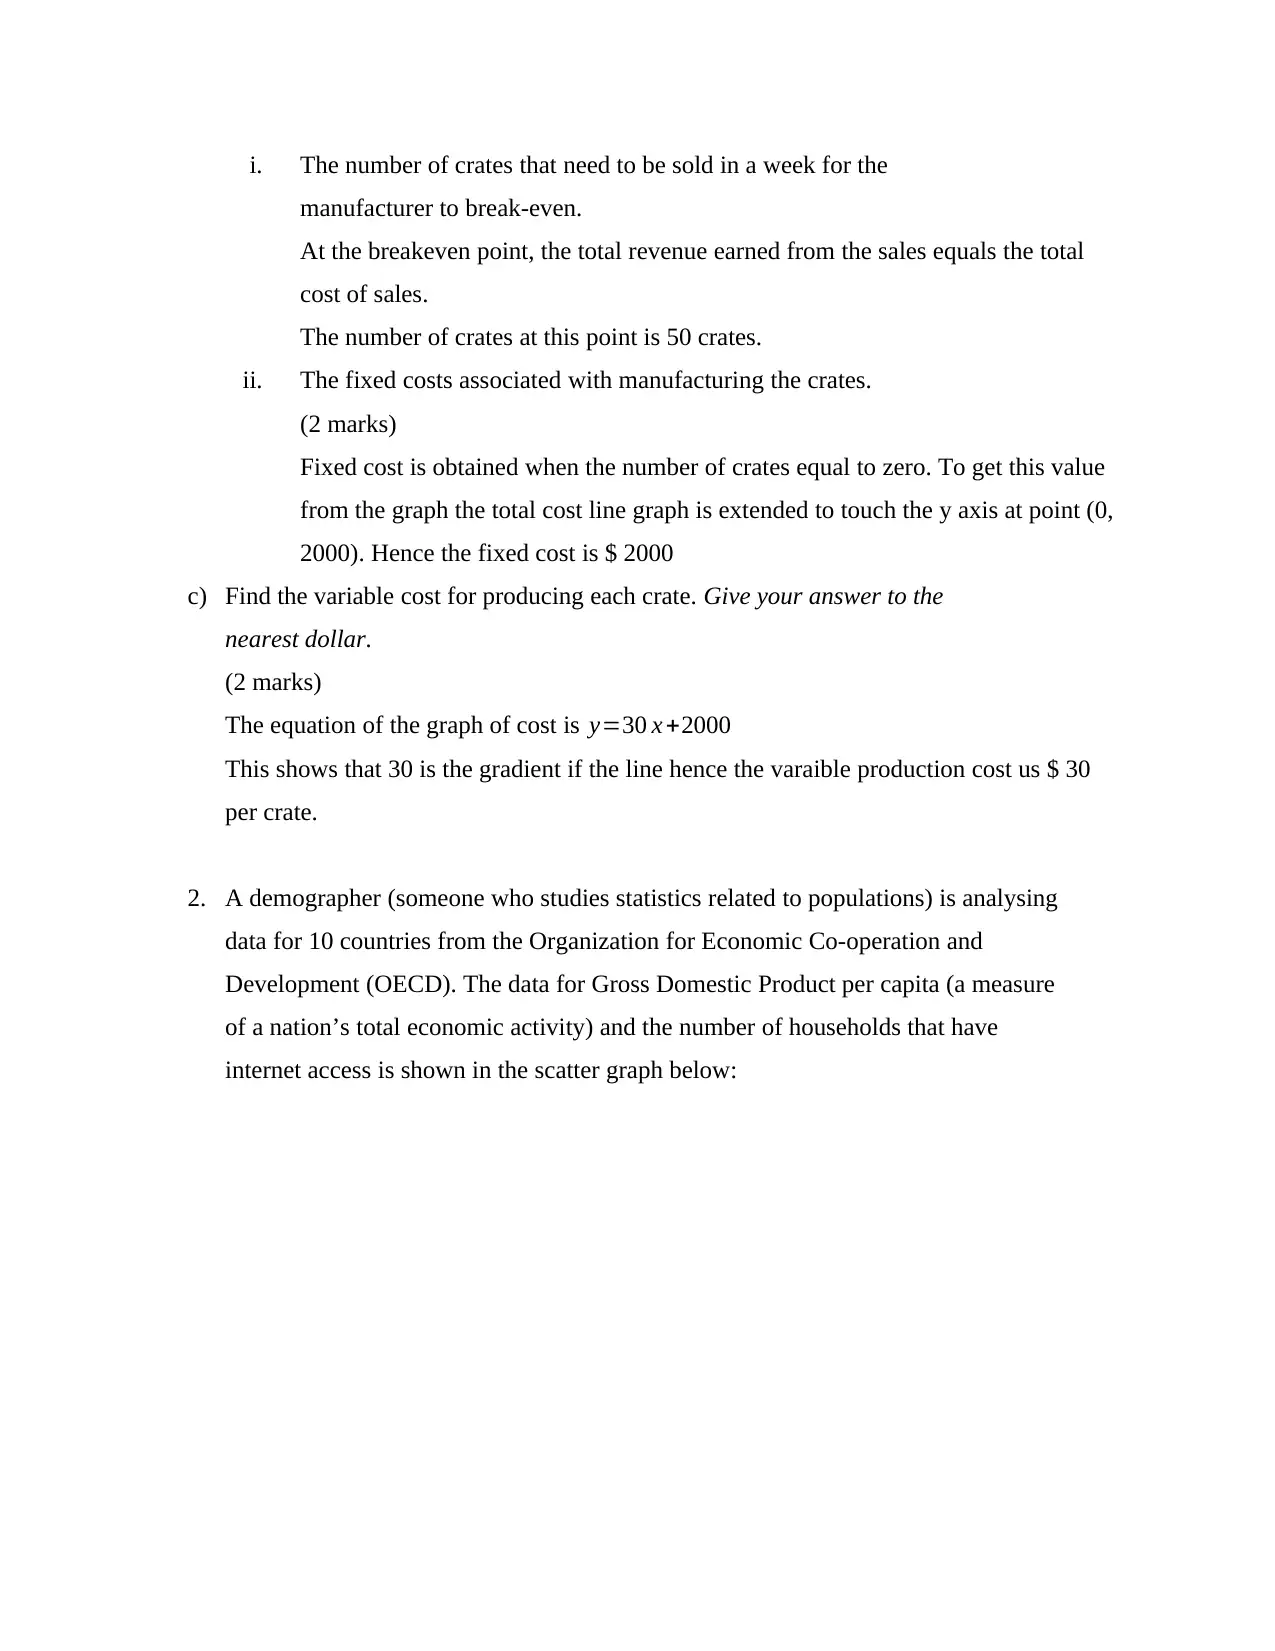
2. A demographer (someone who studies statistics related to populations) is analysing
data for 10 countries from the Organization for Economic Co-operation and
Development (OECD). The data for Gross Domestic Product per capita (a measure
of a nation’s total economic activity) and the number of households that have
internet access is shown in the scatter graph below:
manufacturer to break-even.
At the breakeven point, the total revenue earned from the sales equals the total
cost of sales.
The number of crates at this point is 50 crates.
ii. The fixed costs associated with manufacturing the crates.
(2 marks)
Fixed cost is obtained when the number of crates equal to zero. To get this value
from the graph the total cost line graph is extended to touch the y axis at point (0,
2000). Hence the fixed cost is $ 2000
c) Find the variable cost for producing each crate. Give your answer to the
nearest dollar.
(2 marks)
The equation of the graph of cost is y=30 x +2000
This shows that 30 is the gradient if the line hence the varaible production cost us $ 30
per crate.
2. A demographer (someone who studies statistics related to populations) is analysing
data for 10 countries from the Organization for Economic Co-operation and
Development (OECD). The data for Gross Domestic Product per capita (a measure
of a nation’s total economic activity) and the number of households that have
internet access is shown in the scatter graph below:
⊘ This is a preview!⊘
Do you want full access?
Subscribe today to unlock all pages.
Trusted by 1+ million students worldwide
a) Describe any trends in the data. (1 mark)
The dots are increasing from the left moving towards the right, this shows that the
two variables in the data have a positive correlation.
b) Estimate the correlation coefficient of the data. (1 mark)
From the line of best fit drawn below the correlation coefficient is 0.8052
c) Draw a line of best fit by sight on the graph. (1 mark)
Paraphrase This Document
Need a fresh take? Get an instant paraphrase of this document with our AI Paraphraser
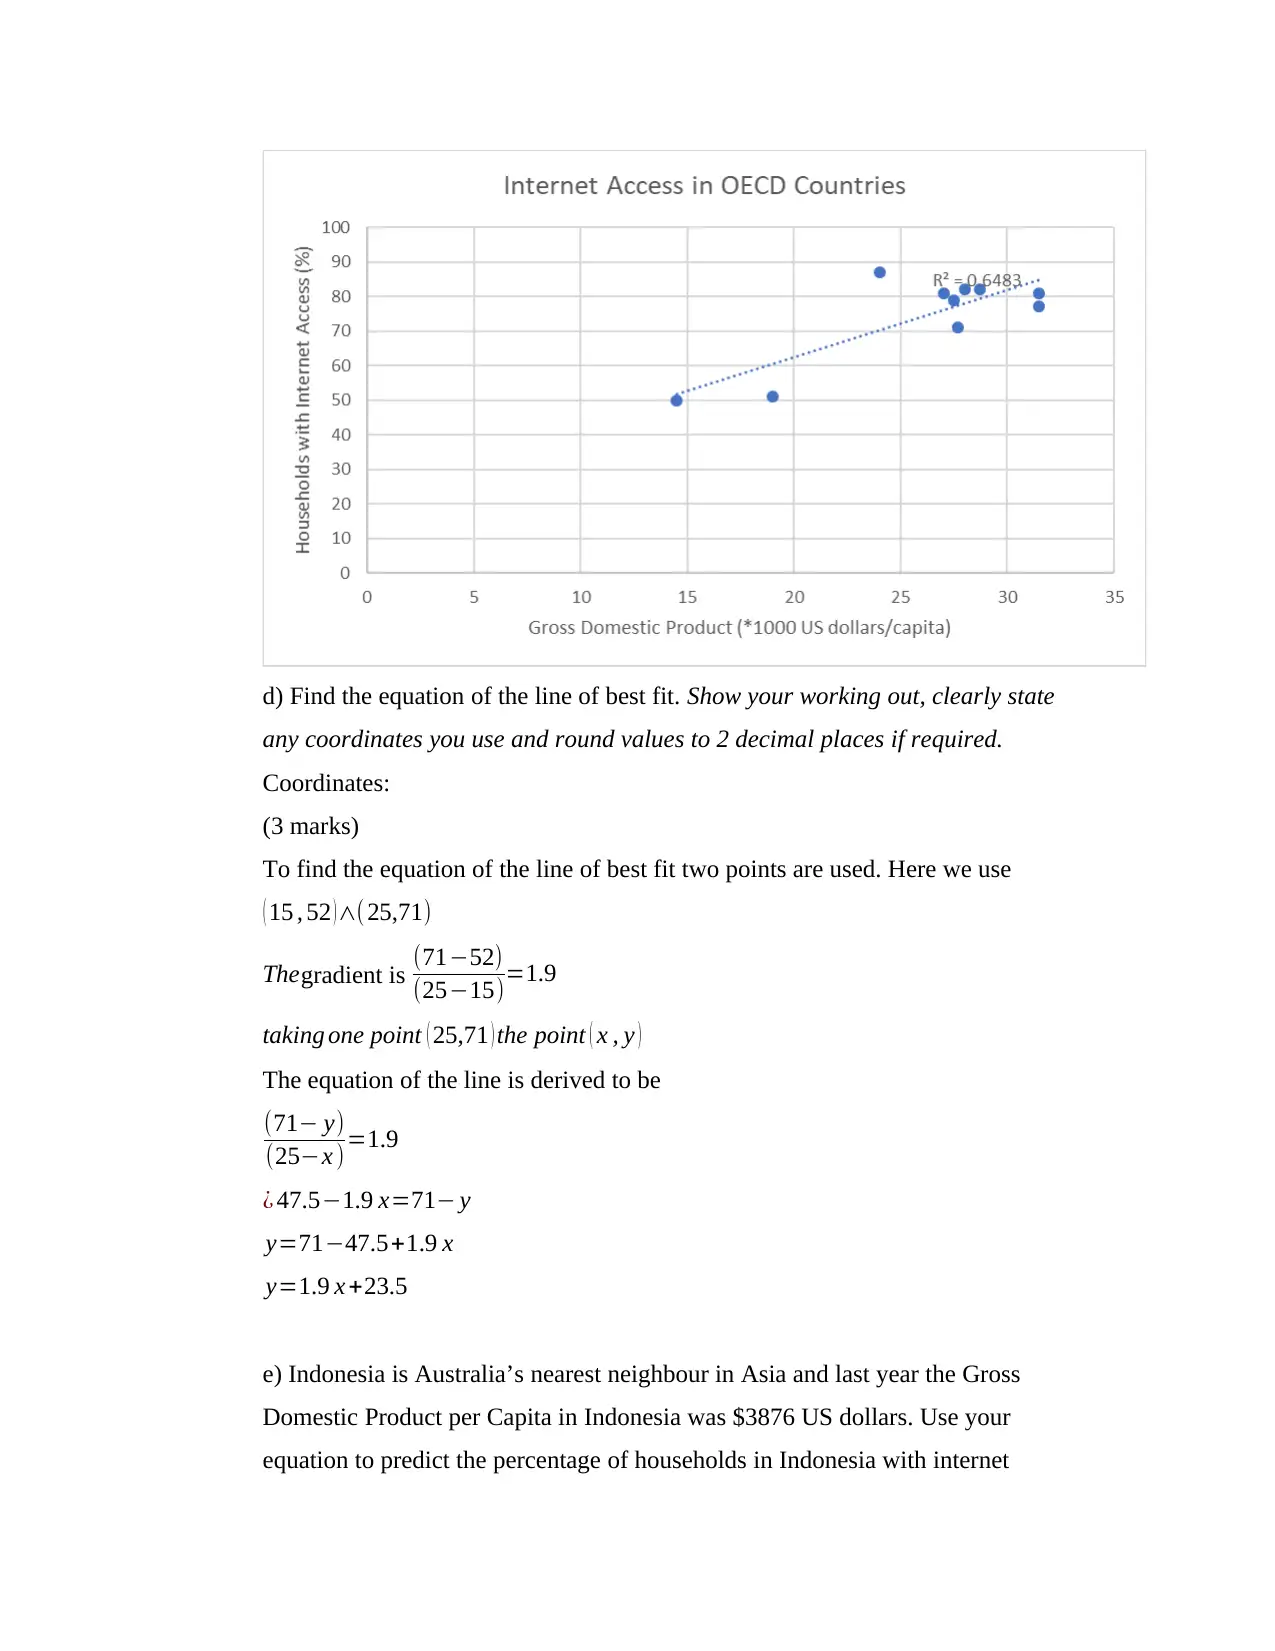
d) Find the equation of the line of best fit. Show your working out, clearly state
any coordinates you use and round values to 2 decimal places if required.
Coordinates:
(3 marks)
To find the equation of the line of best fit two points are used. Here we use
( 15 , 52 ) ∧( 25,71)
Thegradient is (71−52)
(25−15)=1.9
taking one point ( 25,71 ) the point ( x , y )
The equation of the line is derived to be
(71− y)
(25−x )=1.9
¿ 47.5−1.9 x=71− y
y=71−47.5+1.9 x
y=1.9 x +23.5
e) Indonesia is Australia’s nearest neighbour in Asia and last year the Gross
Domestic Product per Capita in Indonesia was $3876 US dollars. Use your
equation to predict the percentage of households in Indonesia with internet
access. Give your answer to the nearest whole percent.
(2 marks)
when the value of x is 3.876
y=1.9 ( 3.876 )+23.5=30.86 which is 31 %
f) Comment on the type and reliability of the prediction you made in part e). (1 mark)
The prediction made is called interpolation, it done using the linear trendline hence its
reliability is not 100%.
3. a) Expand and simplify:
(2 marks)
y=2(6 x+ 4)(x−9)
y=(12 x+8)( x−9)
y=12 x2−108 x+ 8 x −72
y=12 x2−100 x−72
b) Solve the equation in part a) above using the Null Factor Law. (2 marks)
2 ( 6 x+ 4 ) ( x−9 )=0
( 6 x +4 ) ( x −9 )=0
Hence
6 x +4=0which gives x= 4
6
And
( x−9 )=0 , which gives x=9
c) Fully factorize:
y=24 x2 −26 x – 8
(3 marks)
Using the quadratic equation
x=−b ± √ b2−4 ac
2 a
(2 marks)
when the value of x is 3.876
y=1.9 ( 3.876 )+23.5=30.86 which is 31 %
f) Comment on the type and reliability of the prediction you made in part e). (1 mark)
The prediction made is called interpolation, it done using the linear trendline hence its
reliability is not 100%.
3. a) Expand and simplify:
(2 marks)
y=2(6 x+ 4)(x−9)
y=(12 x+8)( x−9)
y=12 x2−108 x+ 8 x −72
y=12 x2−100 x−72
b) Solve the equation in part a) above using the Null Factor Law. (2 marks)
2 ( 6 x+ 4 ) ( x−9 )=0
( 6 x +4 ) ( x −9 )=0
Hence
6 x +4=0which gives x= 4
6
And
( x−9 )=0 , which gives x=9
c) Fully factorize:
y=24 x2 −26 x – 8
(3 marks)
Using the quadratic equation
x=−b ± √ b2−4 ac
2 a
⊘ This is a preview!⊘
Do you want full access?
Subscribe today to unlock all pages.
Trusted by 1+ million students worldwide
x= 26 ± √262−(4∗24∗−8)
2∗24
x= 26 ±38
48
This gives −0.25 ,∨ 4
3
Hence y= ( x + 1
4 )( x− 4
3 )= 1
4
( x+1 )∗4
3 (x−1)
y= 1
3 (x +1)(x −1)
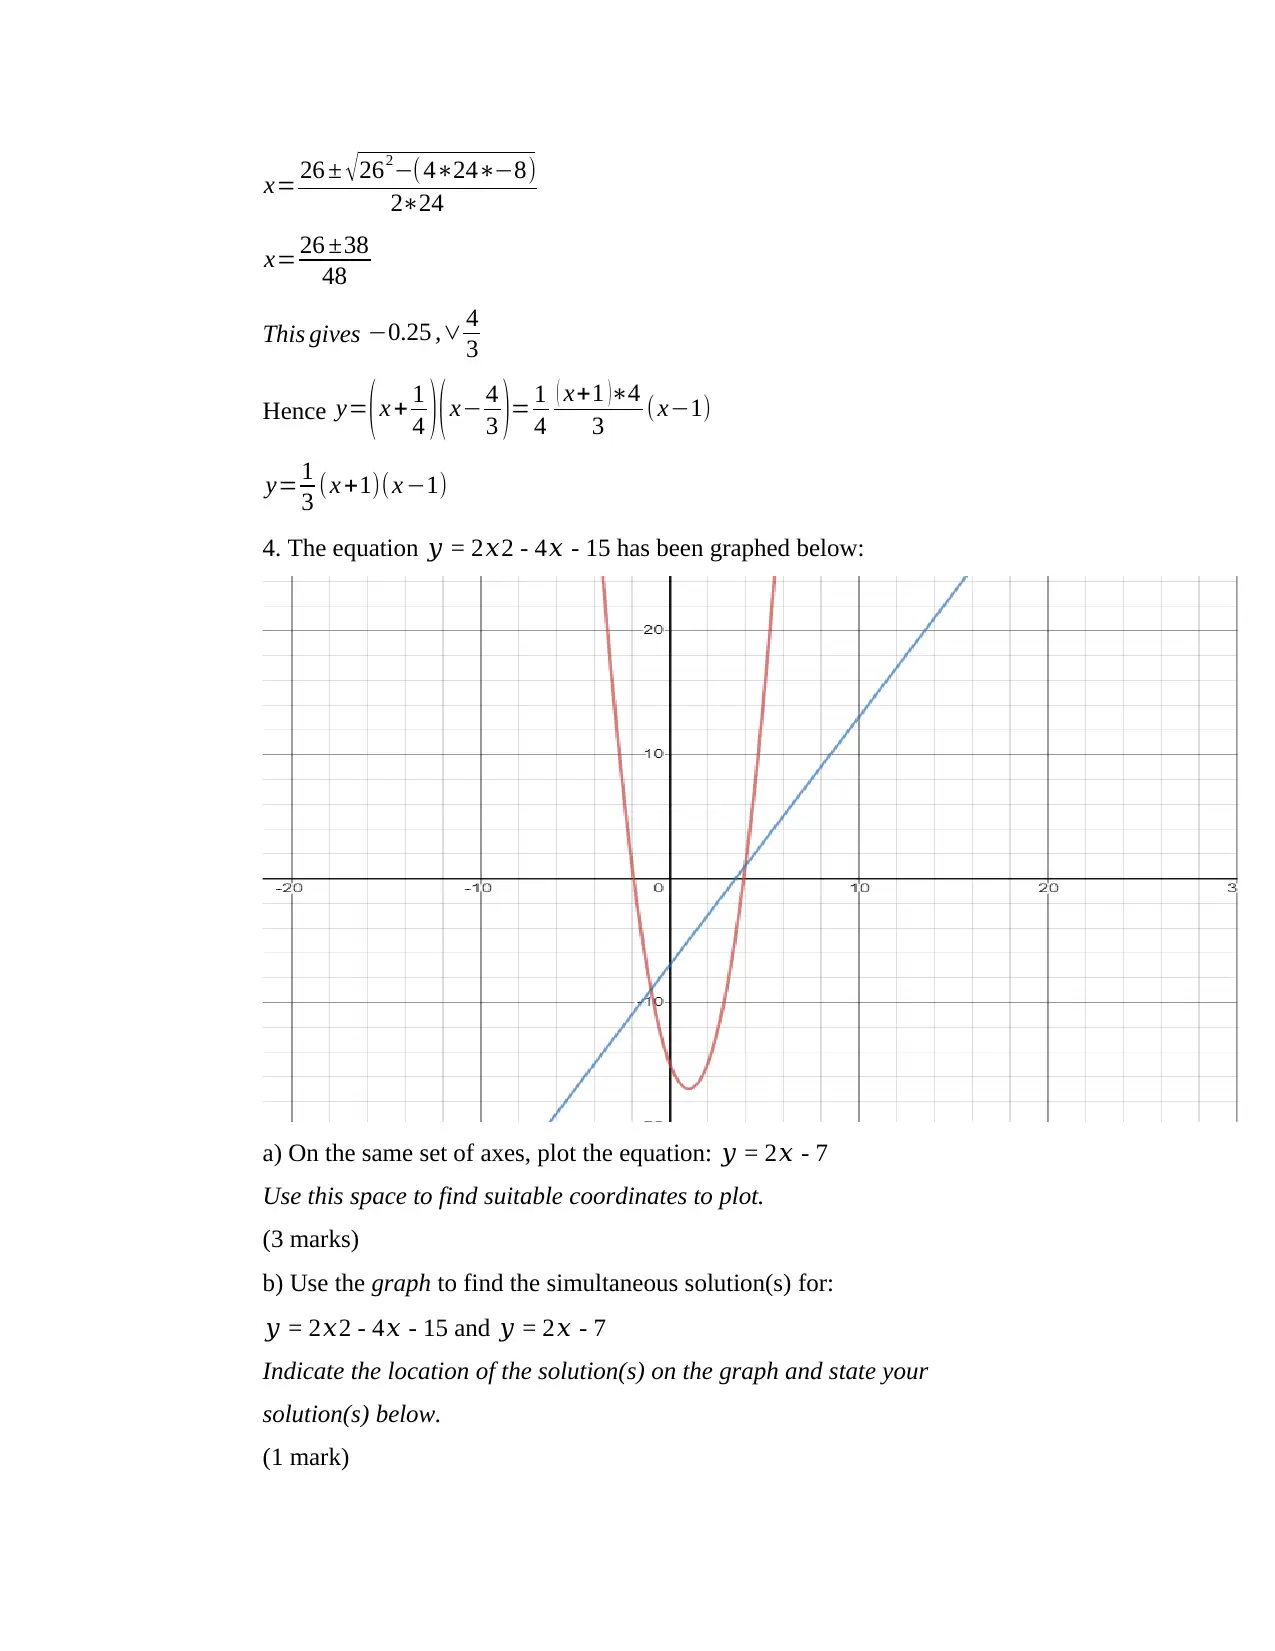
4. The equation 𝑦 = 2𝑥2 - 4𝑥 - 15 has been graphed below:
a) On the same set of axes, plot the equation: 𝑦 = 2𝑥 - 7
Use this space to find suitable coordinates to plot.
(3 marks)
b) Use the graph to find the simultaneous solution(s) for:
𝑦 = 2𝑥2 - 4𝑥 - 15 and 𝑦 = 2𝑥 - 7
Indicate the location of the solution(s) on the graph and state your
solution(s) below.
(1 mark)
2∗24
x= 26 ±38
48
This gives −0.25 ,∨ 4
3
Hence y= ( x + 1
4 )( x− 4
3 )= 1
4
( x+1 )∗4
3 (x−1)
y= 1
3 (x +1)(x −1)
4. The equation 𝑦 = 2𝑥2 - 4𝑥 - 15 has been graphed below:
a) On the same set of axes, plot the equation: 𝑦 = 2𝑥 - 7
Use this space to find suitable coordinates to plot.
(3 marks)
b) Use the graph to find the simultaneous solution(s) for:
𝑦 = 2𝑥2 - 4𝑥 - 15 and 𝑦 = 2𝑥 - 7
Indicate the location of the solution(s) on the graph and state your
solution(s) below.
(1 mark)
Paraphrase This Document
Need a fresh take? Get an instant paraphrase of this document with our AI Paraphraser
The solution is -1 and 3.9
c) Verify (check) your answer to part b) by solving the simultaneous equations
by substitution (e.g. solve 2 x2 −4 x−15=2 x−7using the Quadratic
(2 marks)
Formula.
2 x2 −4 x−15=2 x – 7
2 x2 −6 x−8=0
using thequadratic equation we have
x=−b ± √ b2−4 ac
2 a
x= 6 ± √(−6)2−4∗2∗−8
2∗2
¿ 6 ±10
4
this gives x as 4∨−1 this are the values obtained in the graph when given to 1
significant figure.
5. The value of an investment property, for the first 20 years of ownership, can be
modelled by the equation below:
V =−0.6 t2 +15 t+ 200
Where V is the value in thousands of dollars and 𝑡 is the time in years.
a) What is the maximum value of the investment property in the first 20 years? (2
marks)
At the maximum point v'=−1.2t +15=0
t=12.5 years
b) Sketch the general shape of the graph for the value of the investment property
with respect to time. Label the axes and the coordinates of the y-intercept and
the vertex only (no other coordinates are required).
(2 marks)
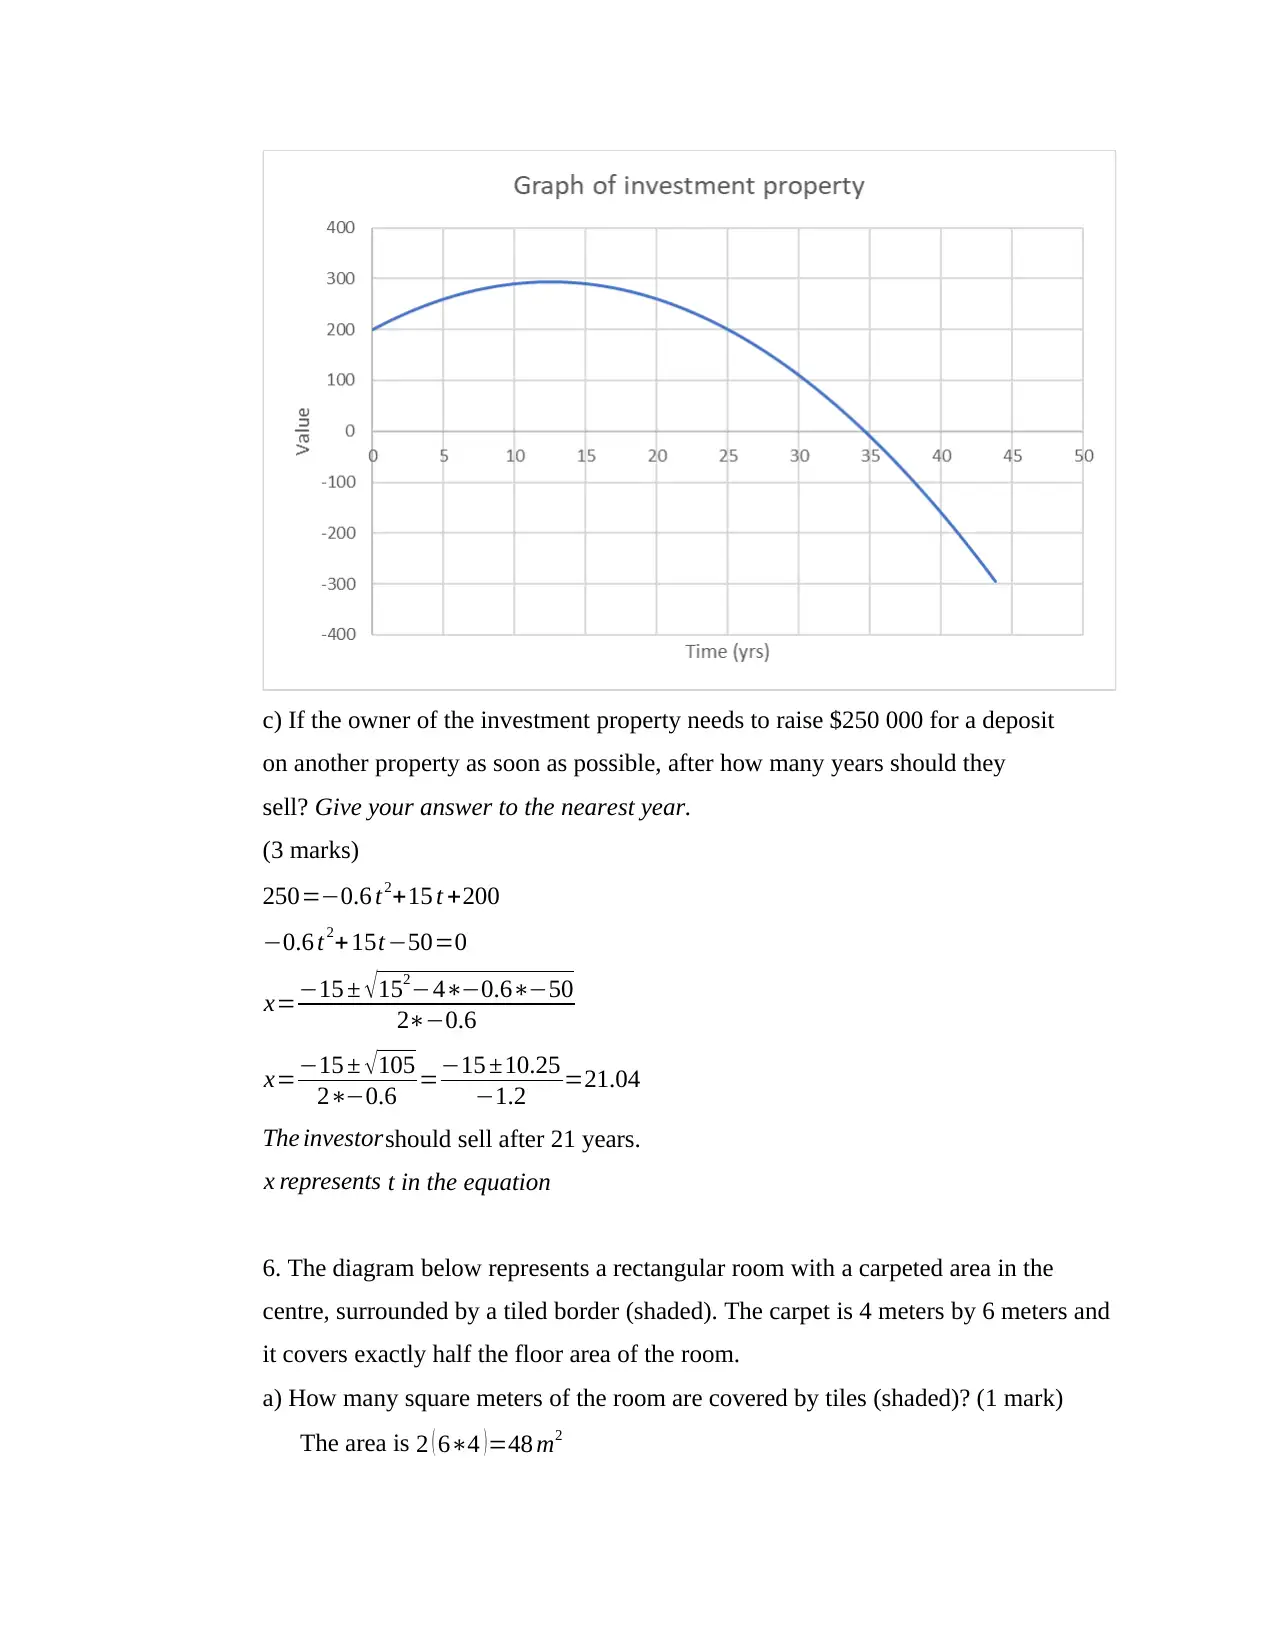
c) If the owner of the investment property needs to raise $250 000 for a deposit
on another property as soon as possible, after how many years should they
sell? Give your answer to the nearest year.
(3 marks)
250=−0.6 t2+15 t +200
−0.6 t 2+15t−50=0
x=−15 ± √152−4∗−0.6∗−50
2∗−0.6
x=−15 ± √105
2∗−0.6 =−15 ±10.25
−1.2 =21.04
The investorshould sell after 21 years.
x represents t in the equation
6. The diagram below represents a rectangular room with a carpeted area in the
centre, surrounded by a tiled border (shaded). The carpet is 4 meters by 6 meters and
it covers exactly half the floor area of the room.
a) How many square meters of the room are covered by tiles (shaded)? (1 mark)
The area is 2 ( 6∗4 )=48 m2
⊘ This is a preview!⊘
Do you want full access?
Subscribe today to unlock all pages.
Trusted by 1+ million students worldwide
b) Write an equation, in standard quadratic form, to describe the area covered by tiles
in terms of 𝑥.
(2 marks)
Bigger rectangle
(4+2x) by (6+2x)
Inner rectangle
6 by 4
Shaded area
( 4 +2 x ) ( 6+2 x )−24
24+8 x+12 x+4 x2−24
¿ 4 x2 +20 x
c) Using your equation in part ii), find the dimensions (length and width) of the room.
(3 marks)
4 x2 +20 x=48
4 x2 +20 x−48=0
Using quadratic formula
x=−b ± √ b2−4 ac
2 a
x=−20 ± √202 −(4∗4∗−48)
2∗4
x=−20 ±20.78
8
¿−5.098∨0.0975
Since x cannot be negative the value is 0.0975
Length of the room is
( 4 +2 x ) by (6 +2 x )
( 4 +0.195 ) by ( 6+0.195 )
This gives
4.195 by 6.195
1 out of 10
Related Documents


Your All-in-One AI-Powered Toolkit for Academic Success.
+13062052269
info@desklib.com
Available 24*7 on WhatsApp / Email
![[object Object]](/_next/static/media/star-bottom.7253800d.svg)
Unlock your academic potential
© 2024 | Zucol Services PVT LTD | All rights reserved.