Project Report: Portfolio Analysis of 9 Assets and Evaluation
VerifiedAdded on 2021/04/24
|12
|2142
|63
Project
AI Summary
This project report presents a comprehensive analysis of a nine-asset portfolio, evaluating each asset based on behavioral perspectives and performance metrics. The study aims to identify the top five assets for inclusion in a new, optimized portfolio. The report incorporates calculations and financial analysis to assess portfolio fluctuations and behavior, considering factors such as market position and investor awareness. The analysis covers various companies including Amazon, Netflix, Exxon Mobil, Apple, Starbucks, Alphabet, Microsoft, Boeing, and FedEx, examining their performance and correlation. The report also considers portfolio diversification, concluding that Alphabet, Netflix, Exxon Mobil, FedEx, and Starbucks offer superior investment potential. The findings highlight the importance of behavioral perspectives and diversification in portfolio management, offering insights into investment strategies and asset selection.
Running Head: Portfolio analysis
1
Project Report: Portfolio analysis
1
Project Report: Portfolio analysis
Paraphrase This Document
Need a fresh take? Get an instant paraphrase of this document with our AI Paraphraser
Portfolio analysis
2
Introduction
The report consist a portfolio of 9 assets which has been discussed and evaluated on
the basis of behavioural and performance point of view of the portfolio. The idea is to
manage the performance of the portfolio and evaluate the best 5 assets from the 9 assets to
make new portfolio. The evaluation and the analysis is based on the calculations which have
been shown in the appendix. The entire calculation explains that how the portfolio is
fluctuating and behaving. Further, it focuses on the failure or the success of the portfolio of 5
assets. The report considers the behaviour perspective as well as few theories to evaluate and
manage the portfolio of 5 assets.
Choosing the portfolio: Behaviour perspective
At initial level, nine companies have been taken into the consideration for preparing a
portfolio in relation to the investment. The portfolio has been prepared to evaluate and
analyze the investment position. The analysis evaluates that whether the portfolio is
successful or it would lead o the failure. The nine companies which have been considered
while preparing the portfolio are Amazon, Netflix, Exxon Mobil, Apple, Starbucks,
Alphabet, Microsoft, Boeing and FedEx. These companies are registered into various stock
exchanges (Mainik and Rüschendorf, 2010). The stock price of these assets has been
evaluated to identify the portfolio performance.
Behaviour perspective of investors regarding the portfolio explains that the
behavioural investors build and maintain the portfolios as pyramid of assts, layer by layer. In
this, layers are associated with specific goals and attitudes in relation with the risk. In terms
of the consumer experience, portfolio assets have been chosen on the basis of various factors
such as those companies which offer daily products, computers, smart phones, food etc. these
companies manages and enhances the value to services on rapid basis. The chosen companies
for the portfolio are providing better returns to their stockholders and thus the confidence
have been enhanced to choose these assets (Fogarty, 2010). The assets have been chosen after
evaluating the financial analysis report about the company and the performance of the
comapny in the market. It has been found that the In the third quarter, 65% of Amazon's e-
commerce sales came from North America, with the remaining 35% coming from
Portfolio analysis
3
international markets. Clearly, there are massive international e-commerce growth
opportunities.
Netflix is one of the largest stocks in NASDAQ. The price is increasing every year and
it keeps continuing. Exxon stock is one of the most profitable stocks in NASDAQ. The price
is increasing every month and the company does a great job innovating. Apple stock is one of
the largest capitalizations in the world. A company that never fails and the stock price
increases continuously. Starbucks is strongly increasing during the past two years and
continuing (Yang et al, 2014). The company is becoming the strongest in this market.
Alphabet: The petroleum business in Brazil is increasing massively. The stock is increasing a
lot in the past 6 months, especially in 2018. Microsoft: A brand that people can trust. The
price is the stock is increasing every year and continuing. Boeing: One of the most
technology increasing stocks in final 2017 and 2018. FedEx: The most increasing
communication / technology stock in 2018. Hence, these securities have been chosen (Brière,
Oosterlinck and Szafarz, 2015).
It has been found that at the domestic and local level, people are quite aware about
these companies and the market position of these companies are also well which is directly
impacting on the performance of the portfolio. The study explains that the position and the
performance of the portfolio are better in context with the domestic level. Further, it has been
found that at the international level, people are also aware about these companies and the
market position of these companies in well manner which is directly impacting on the
performance of the portfolio (Abreu and Mendes, 2010). The study explains that the position
and the performance of the portfolio are better in context with the international level. Hence,
behaviour perspective of investors about the assets and the portfolio explains that all the 9
assets are better and it would lead the portfolio towards success.
Portfolio diversification consideration
The evaluation on the portfolio diversification has been done to further. The study
explains that which 5 assets are better in the total of 9 assets. It has been evaluated through
the study that the position of Alphabet’s stock, Netflix, Exxon mobile, FedEx and starbucks
are far better than the other stock. All of these stocks are mainly registered into the US
⊘ This is a preview!⊘
Do you want full access?
Subscribe today to unlock all pages.
Trusted by 1+ million students worldwide
Portfolio analysis
4
market. These stocks are offering high return and the associate risk of these assets are quite
lesser. These stocks have been chosen after being confident about the portfolio position and
the portfolio success. No doubt has been found while preparing the portfolio and choosing the
5 assets out of 9 assets. These 5 assets represent a better portfolio and explain that the
investment into these securities would be more profitable for the investors. The amount of
news and the presence of the stocks have put the portfolio in a better position. International
level is quite aware about these assets.
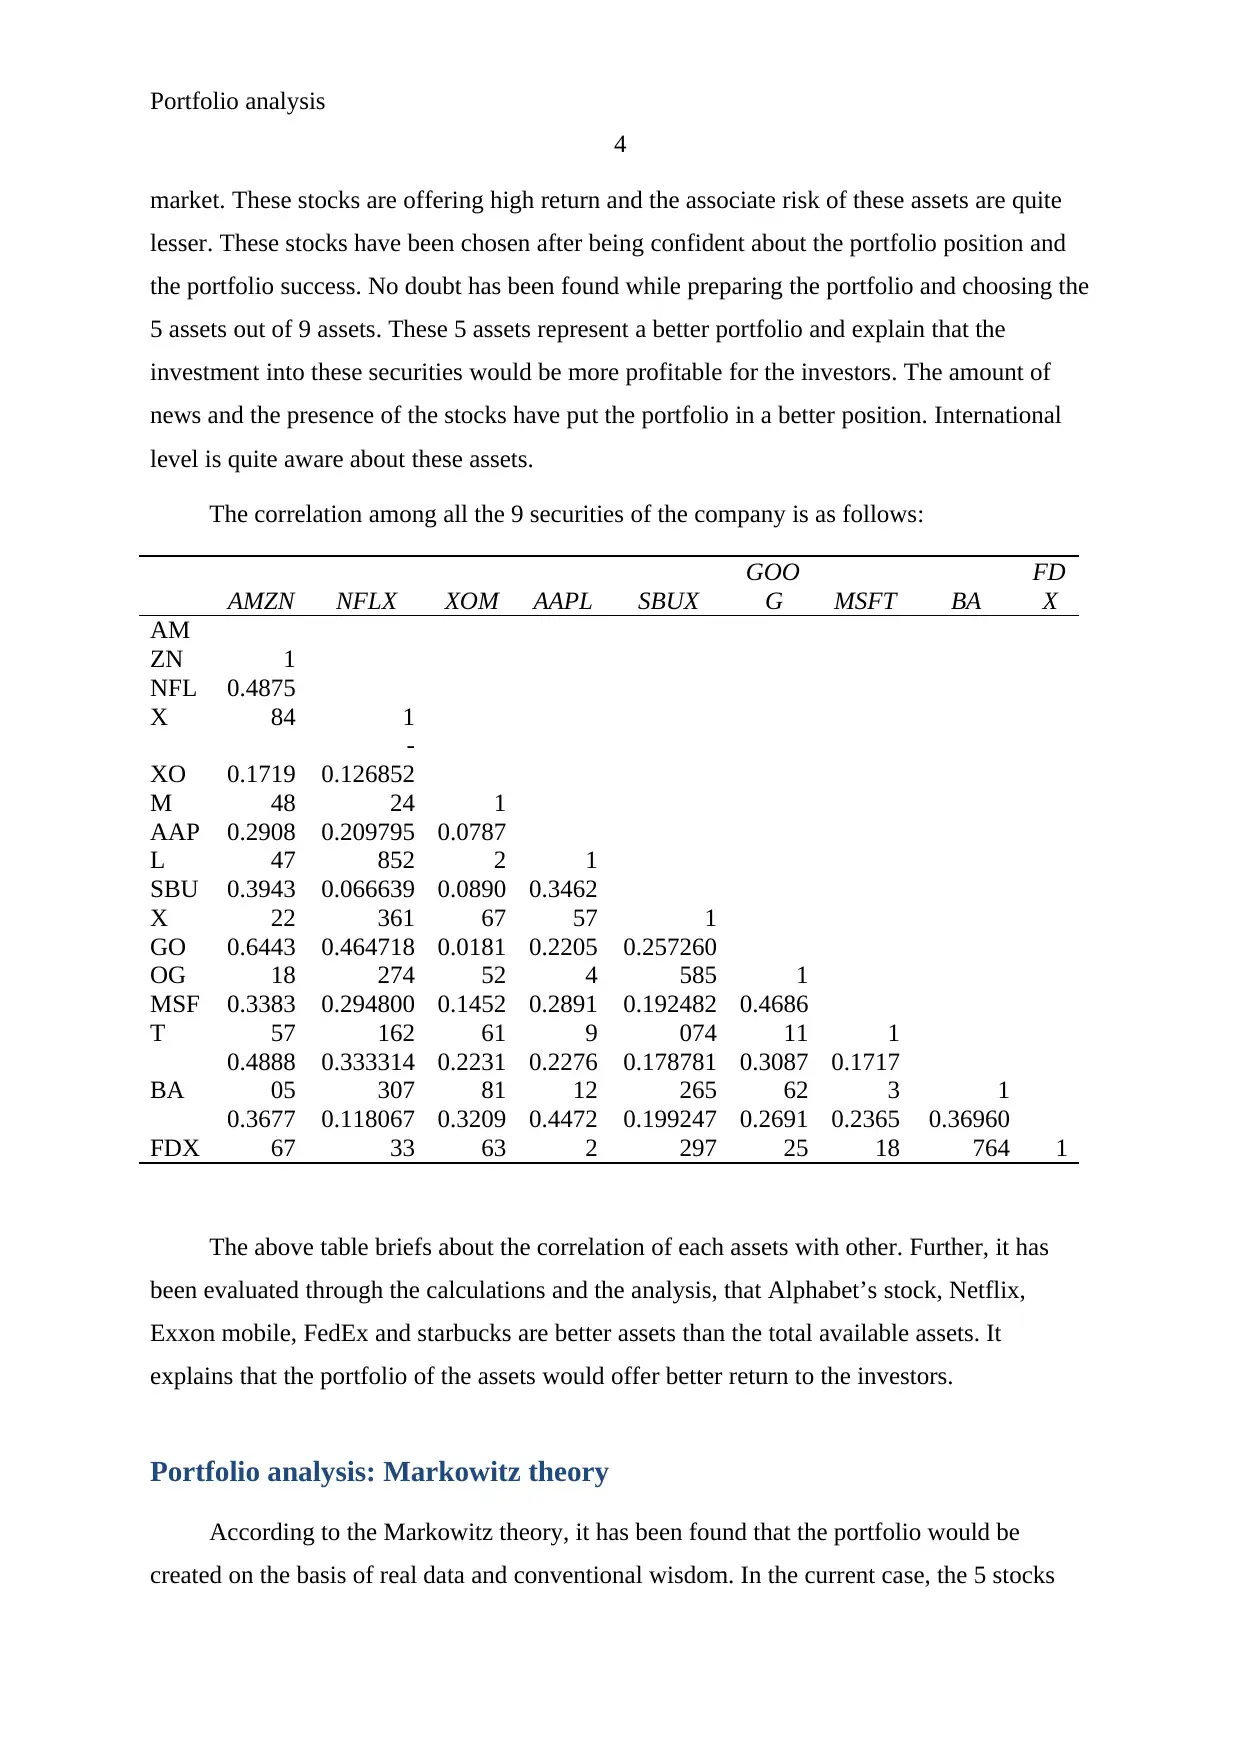
The correlation among all the 9 securities of the company is as follows:
AMZN NFLX XOM AAPL SBUX
GOO
G MSFT BA
FD
X
AM
ZN 1
NFL
X
0.4875
84 1
XO
M
0.1719
48
-
0.126852
24 1
AAP
L
0.2908
47
0.209795
852
0.0787
2 1
SBU
X
0.3943
22
0.066639
361
0.0890
67
0.3462
57 1
GO
OG
0.6443
18
0.464718
274
0.0181
52
0.2205
4
0.257260
585 1
MSF
T
0.3383
57
0.294800
162
0.1452
61
0.2891
9
0.192482
074
0.4686
11 1
BA
0.4888
05
0.333314
307
0.2231
81
0.2276
12
0.178781
265
0.3087
62
0.1717
3 1
FDX
0.3677
67
0.118067
33
0.3209
63
0.4472
2
0.199247
297
0.2691
25
0.2365
18
0.36960
764 1
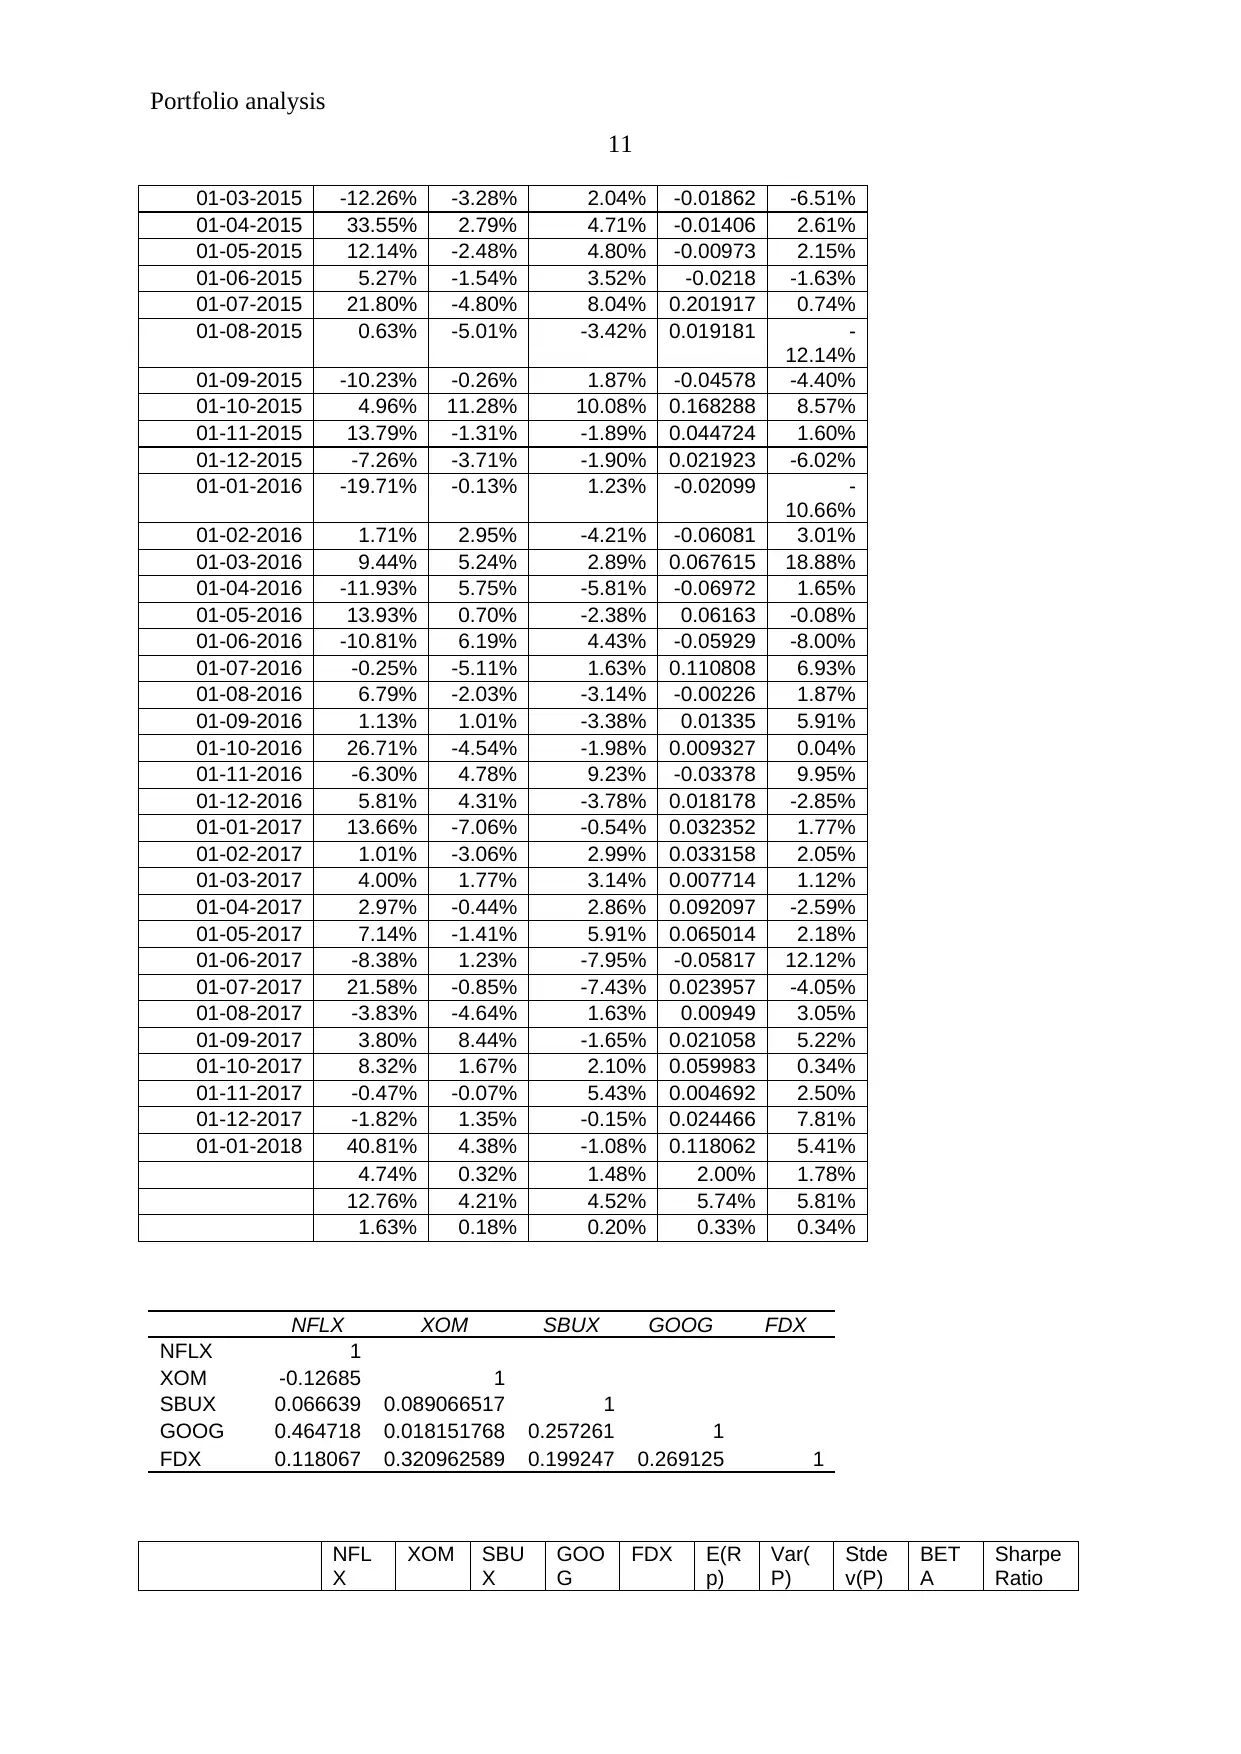
The above table briefs about the correlation of each assets with other. Further, it has
been evaluated through the calculations and the analysis, that Alphabet’s stock, Netflix,
Exxon mobile, FedEx and starbucks are better assets than the total available assets. It
explains that the portfolio of the assets would offer better return to the investors.
Portfolio analysis: Markowitz theory
According to the Markowitz theory, it has been found that the portfolio would be
created on the basis of real data and conventional wisdom. In the current case, the 5 stocks
4
market. These stocks are offering high return and the associate risk of these assets are quite
lesser. These stocks have been chosen after being confident about the portfolio position and
the portfolio success. No doubt has been found while preparing the portfolio and choosing the
5 assets out of 9 assets. These 5 assets represent a better portfolio and explain that the
investment into these securities would be more profitable for the investors. The amount of
news and the presence of the stocks have put the portfolio in a better position. International
level is quite aware about these assets.
The correlation among all the 9 securities of the company is as follows:
AMZN NFLX XOM AAPL SBUX
GOO
G MSFT BA
FD
X
AM
ZN 1
NFL
X
0.4875
84 1
XO
M
0.1719
48
-
0.126852
24 1
AAP
L
0.2908
47
0.209795
852
0.0787
2 1
SBU
X
0.3943
22
0.066639
361
0.0890
67
0.3462
57 1
GO
OG
0.6443
18
0.464718
274
0.0181
52
0.2205
4
0.257260
585 1
MSF
T
0.3383
57
0.294800
162
0.1452
61
0.2891
9
0.192482
074
0.4686
11 1
BA
0.4888
05
0.333314
307
0.2231
81
0.2276
12
0.178781
265
0.3087
62
0.1717
3 1
FDX
0.3677
67
0.118067
33
0.3209
63
0.4472
2
0.199247
297
0.2691
25
0.2365
18
0.36960
764 1
The above table briefs about the correlation of each assets with other. Further, it has
been evaluated through the calculations and the analysis, that Alphabet’s stock, Netflix,
Exxon mobile, FedEx and starbucks are better assets than the total available assets. It
explains that the portfolio of the assets would offer better return to the investors.
Portfolio analysis: Markowitz theory
According to the Markowitz theory, it has been found that the portfolio would be
created on the basis of real data and conventional wisdom. In the current case, the 5 stocks
Paraphrase This Document
Need a fresh take? Get an instant paraphrase of this document with our AI Paraphraser
Portfolio analysis
5
have been evaluated on the basis of Markowitz theory. It explains that the position and the
performance of portfolio could be evaluated easily on the basis of Markowitz theory.
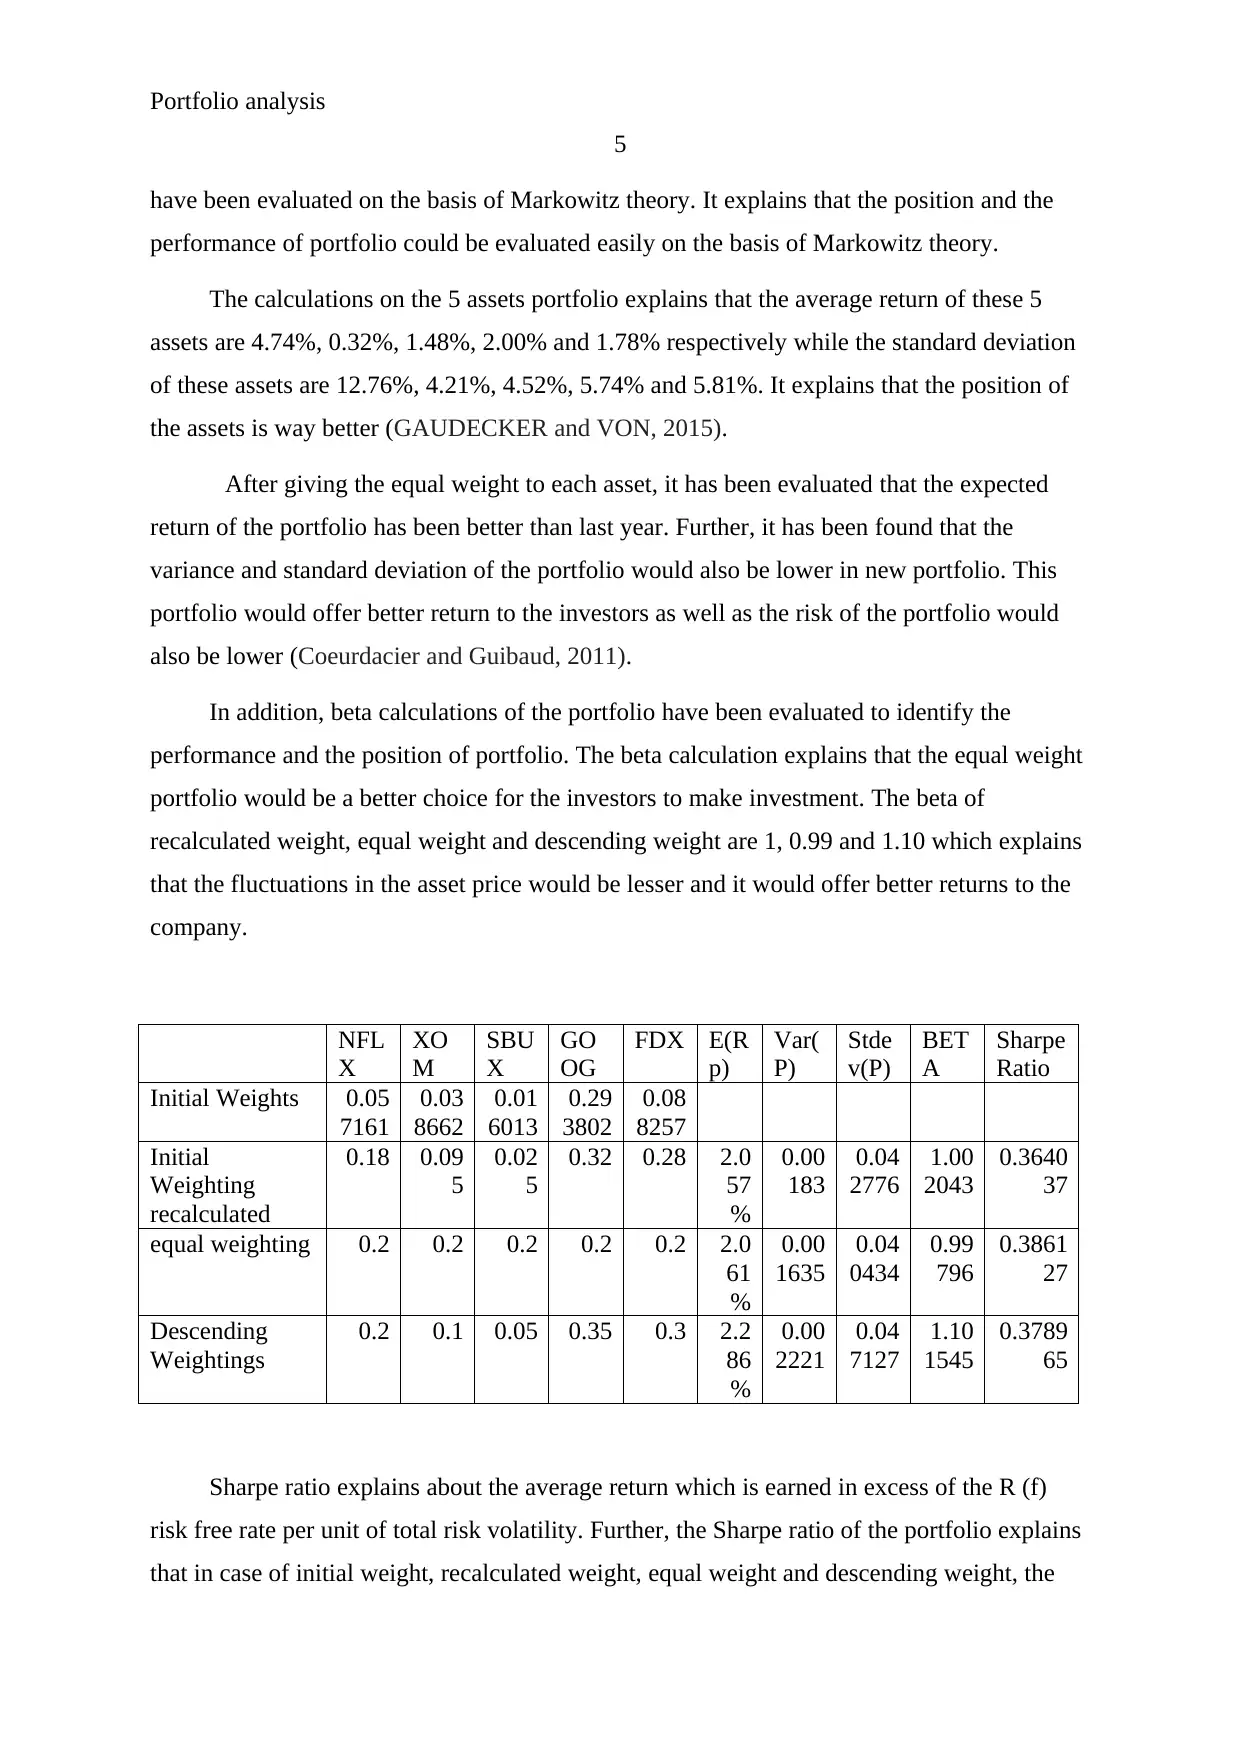
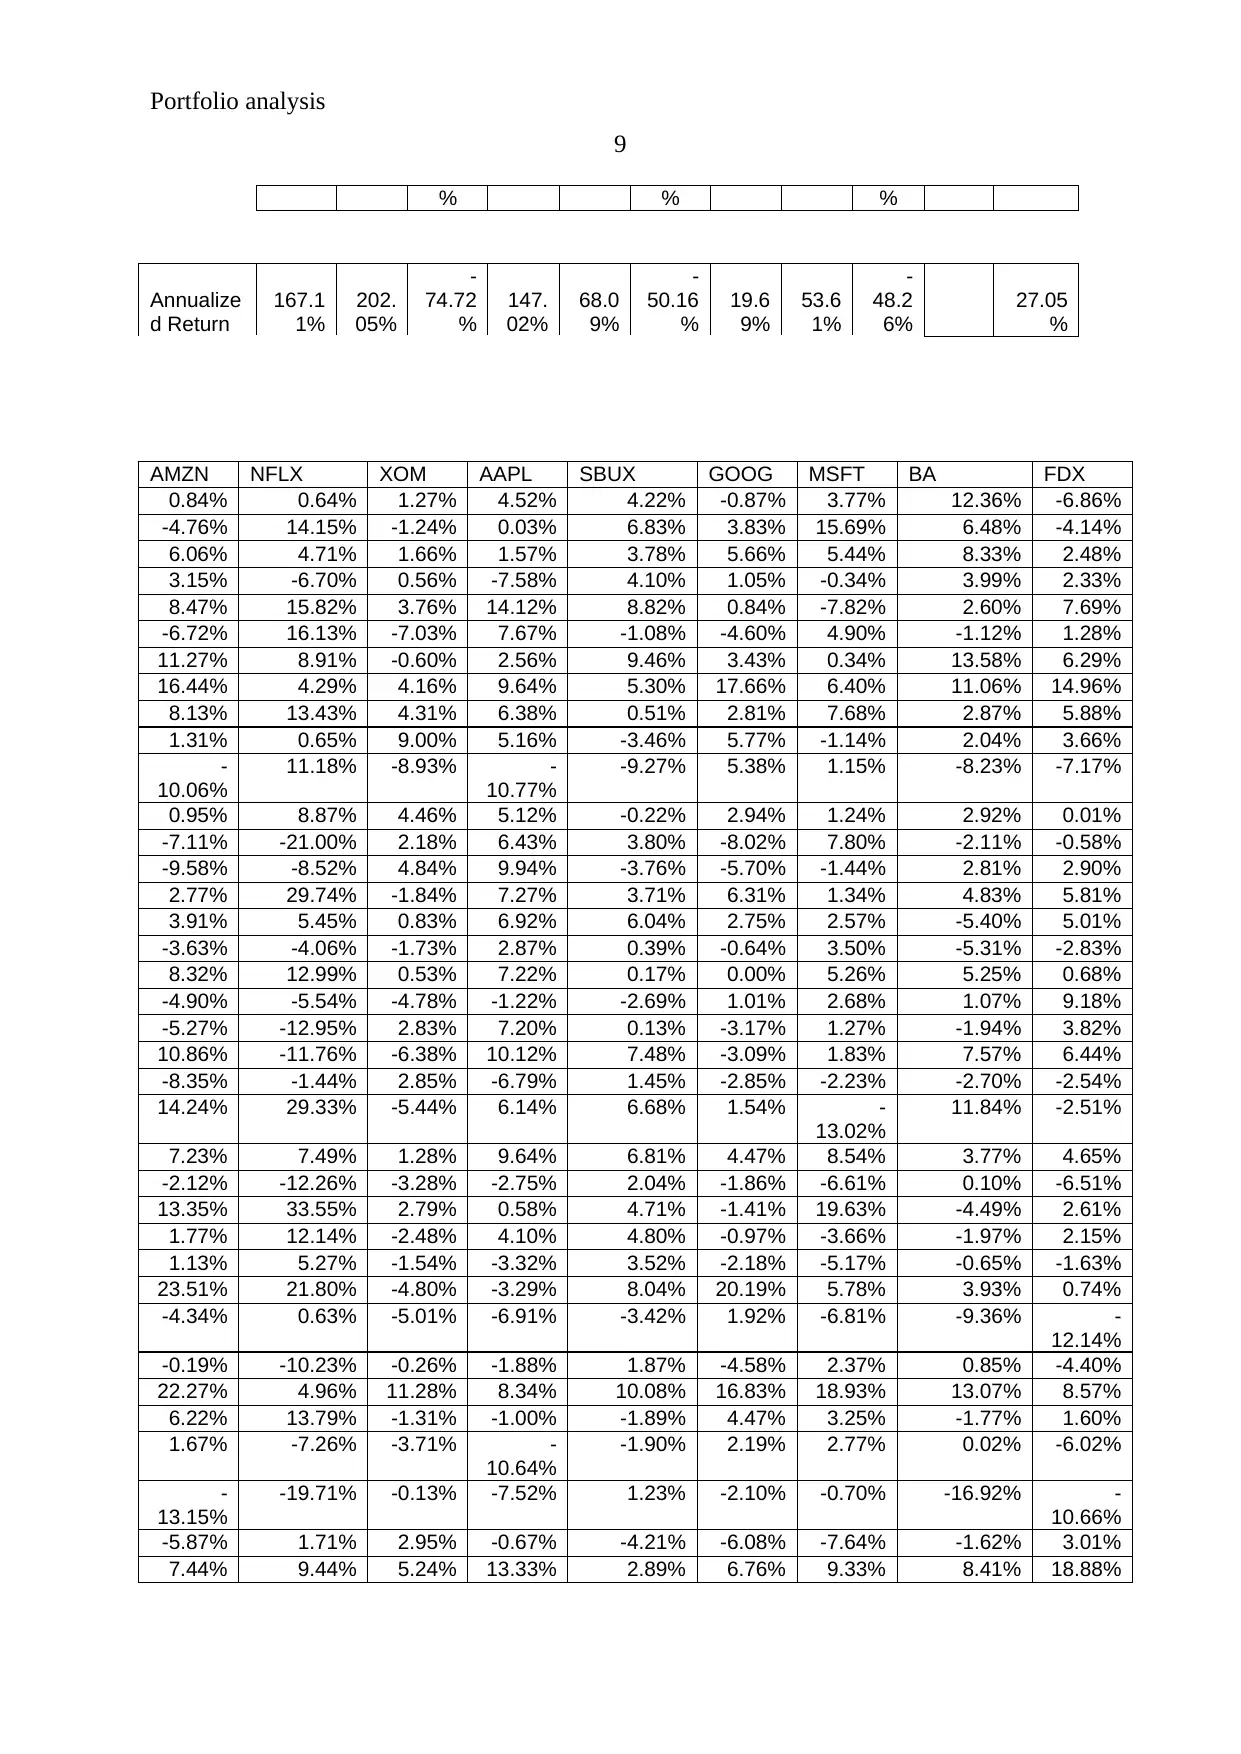
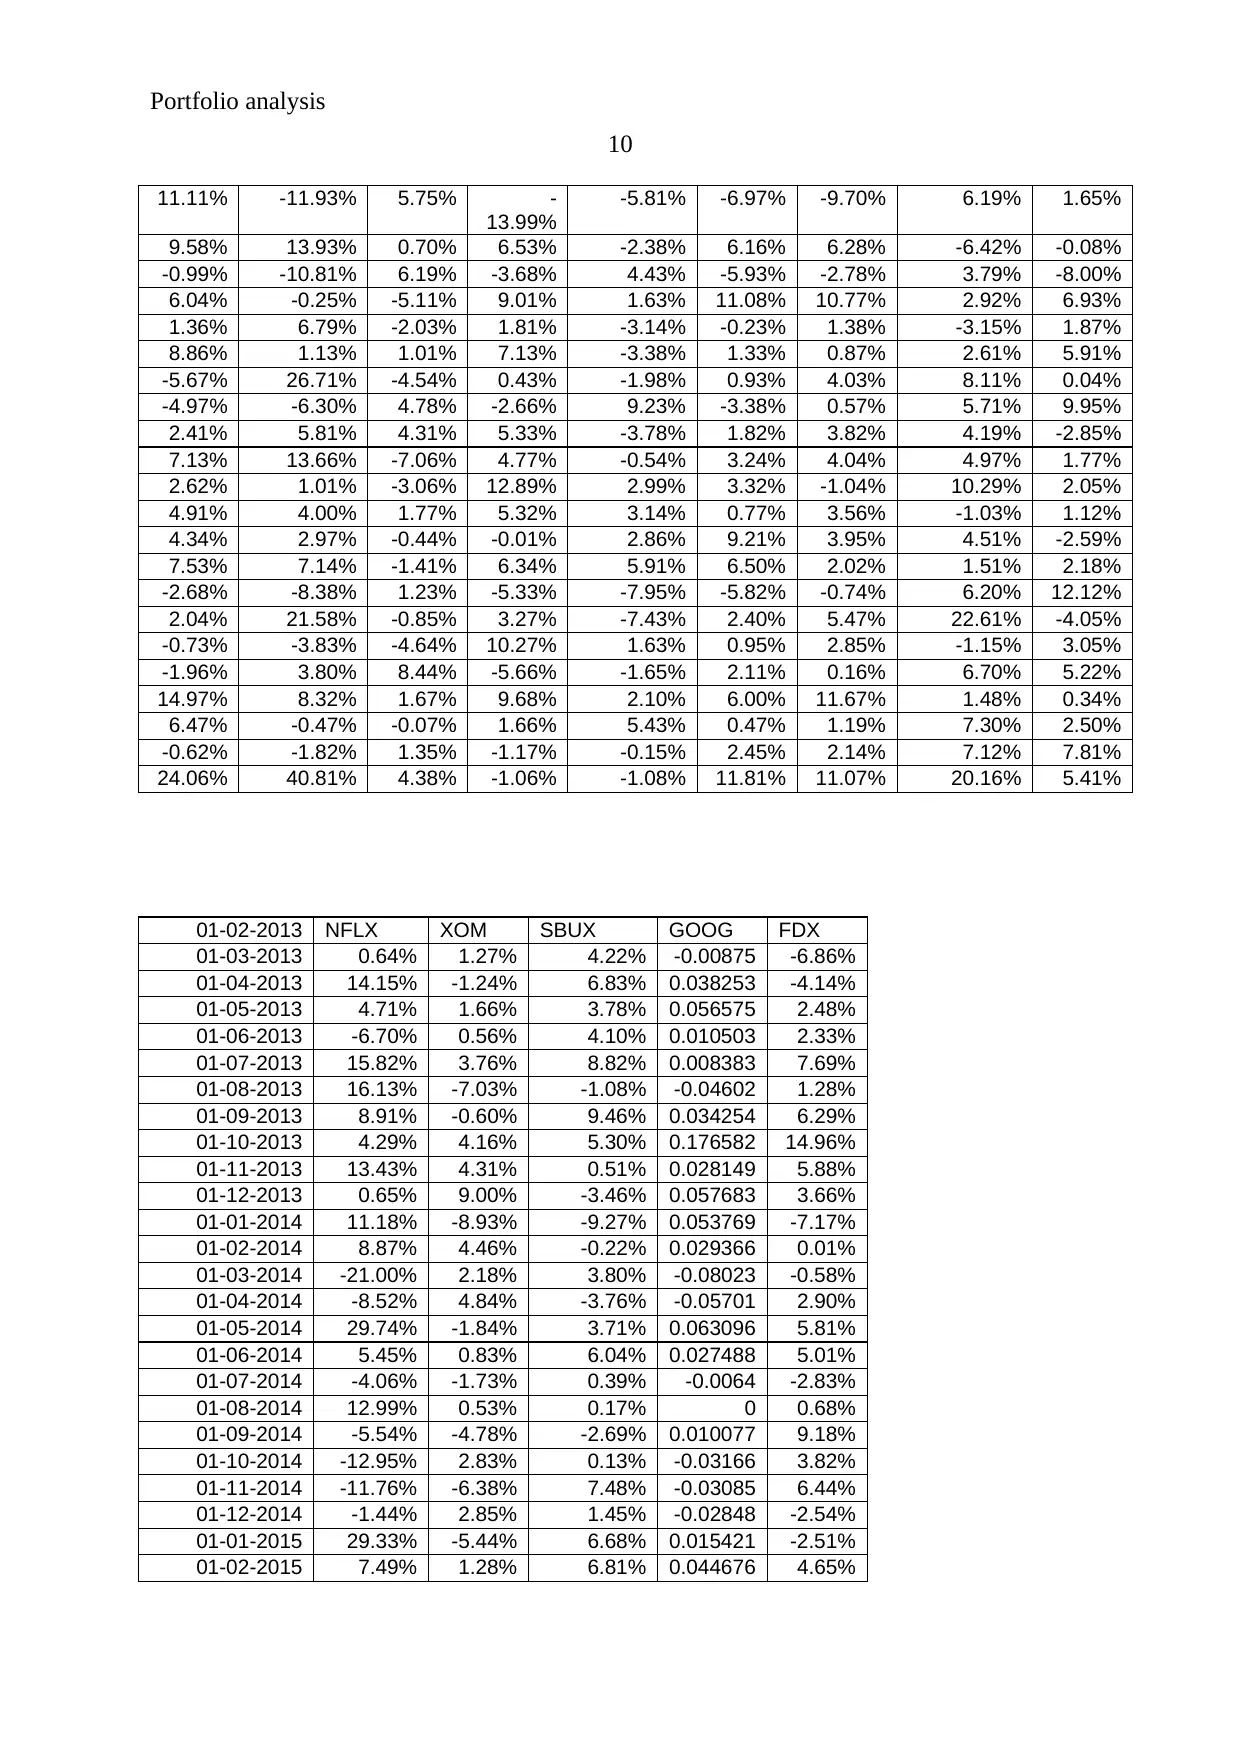
The calculations on the 5 assets portfolio explains that the average return of these 5
assets are 4.74%, 0.32%, 1.48%, 2.00% and 1.78% respectively while the standard deviation
of these assets are 12.76%, 4.21%, 4.52%, 5.74% and 5.81%. It explains that the position of
the assets is way better (GAUDECKER and VON, 2015).
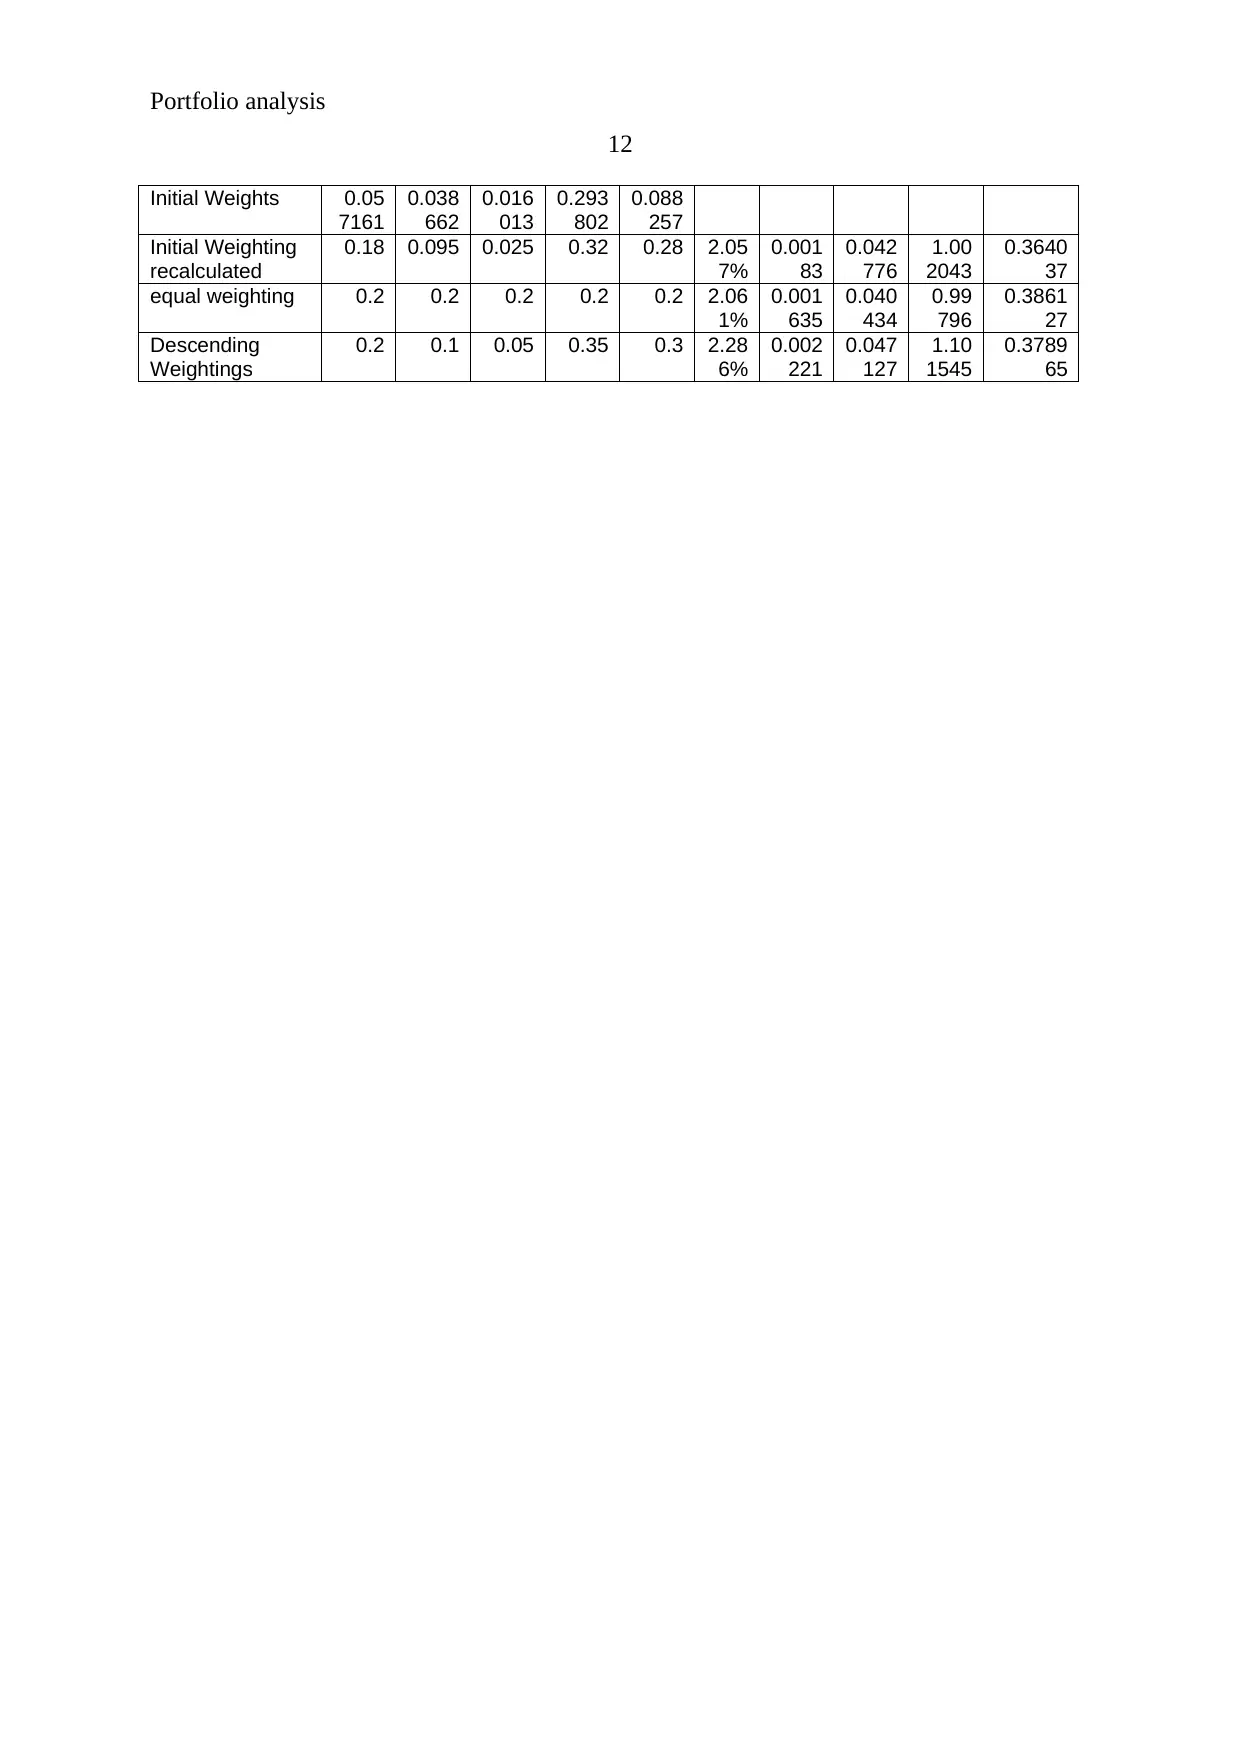
After giving the equal weight to each asset, it has been evaluated that the expected
return of the portfolio has been better than last year. Further, it has been found that the
variance and standard deviation of the portfolio would also be lower in new portfolio. This
portfolio would offer better return to the investors as well as the risk of the portfolio would
also be lower (Coeurdacier and Guibaud, 2011).
In addition, beta calculations of the portfolio have been evaluated to identify the
performance and the position of portfolio. The beta calculation explains that the equal weight
portfolio would be a better choice for the investors to make investment. The beta of
recalculated weight, equal weight and descending weight are 1, 0.99 and 1.10 which explains
that the fluctuations in the asset price would be lesser and it would offer better returns to the
company.
NFL
X
XO
M
SBU
X
GO
OG
FDX E(R
p)
Var(
P)
Stde
v(P)
BET
A
Sharpe
Ratio
Initial Weights 0.05
7161
0.03
8662
0.01
6013
0.29
3802
0.08
8257
Initial
Weighting
recalculated
0.18 0.09
5
0.02
5
0.32 0.28 2.0
57
%
0.00
183
0.04
2776
1.00
2043
0.3640
37
equal weighting 0.2 0.2 0.2 0.2 0.2 2.0
61
%
0.00
1635
0.04
0434
0.99
796
0.3861
27
Descending
Weightings
0.2 0.1 0.05 0.35 0.3 2.2
86
%
0.00
2221
0.04
7127
1.10
1545
0.3789
65
Sharpe ratio explains about the average return which is earned in excess of the R (f)
risk free rate per unit of total risk volatility. Further, the Sharpe ratio of the portfolio explains
that in case of initial weight, recalculated weight, equal weight and descending weight, the
5
have been evaluated on the basis of Markowitz theory. It explains that the position and the
performance of portfolio could be evaluated easily on the basis of Markowitz theory.
The calculations on the 5 assets portfolio explains that the average return of these 5
assets are 4.74%, 0.32%, 1.48%, 2.00% and 1.78% respectively while the standard deviation
of these assets are 12.76%, 4.21%, 4.52%, 5.74% and 5.81%. It explains that the position of
the assets is way better (GAUDECKER and VON, 2015).
After giving the equal weight to each asset, it has been evaluated that the expected
return of the portfolio has been better than last year. Further, it has been found that the
variance and standard deviation of the portfolio would also be lower in new portfolio. This
portfolio would offer better return to the investors as well as the risk of the portfolio would
also be lower (Coeurdacier and Guibaud, 2011).
In addition, beta calculations of the portfolio have been evaluated to identify the
performance and the position of portfolio. The beta calculation explains that the equal weight
portfolio would be a better choice for the investors to make investment. The beta of
recalculated weight, equal weight and descending weight are 1, 0.99 and 1.10 which explains
that the fluctuations in the asset price would be lesser and it would offer better returns to the
company.
NFL
X
XO
M
SBU
X
GO
OG
FDX E(R
p)
Var(
P)
Stde
v(P)
BET
A
Sharpe
Ratio
Initial Weights 0.05
7161
0.03
8662
0.01
6013
0.29
3802
0.08
8257
Initial
Weighting
recalculated
0.18 0.09
5
0.02
5
0.32 0.28 2.0
57
%
0.00
183
0.04
2776
1.00
2043
0.3640
37
equal weighting 0.2 0.2 0.2 0.2 0.2 2.0
61
%
0.00
1635
0.04
0434
0.99
796
0.3861
27
Descending
Weightings
0.2 0.1 0.05 0.35 0.3 2.2
86
%
0.00
2221
0.04
7127
1.10
1545
0.3789
65
Sharpe ratio explains about the average return which is earned in excess of the R (f)
risk free rate per unit of total risk volatility. Further, the Sharpe ratio of the portfolio explains
that in case of initial weight, recalculated weight, equal weight and descending weight, the
Portfolio analysis
6
Sharpe ratio of the portfolio would be almost similar (Seo, 2010). The Sharpe ratio of the
portfolio explains that the equal Weight portfolio is way better than others.
Conclusion
To conclude, presenting a list of various companies which have been chosen on the
basis of their performance and representativeness bases, it has been evaluated that the total
return of the portfolio would be 2.28% which is quite better than the individual return and the
risk basis. According to the some traditional and modern theories and the correlation matrix,
it has been discovered that the allocations of the invested amount in the 5 assets are also
good. It has been found that the risk of the portfolio is quite higher but in the context of the
market and the individual security, it is average. It has been found that the volatility is quite
lesser in the stock price and on the other hand, the Sharpe ratio is also lesser which made it
easier to reconsider and recalculate the portfolio. Though, the obtained results are somehow
same.
Basically, the above portfolio represents about a good diversification strategies and
explains that the investment into this portfolio would be less risky and it would also offer
better returns to the investors.
⊘ This is a preview!⊘
Do you want full access?
Subscribe today to unlock all pages.
Trusted by 1+ million students worldwide
Portfolio analysis
7
References
Abreu, M. and Mendes, V., 2010. Financial literacy and portfolio
diversification. Quantitative finance, 10(5), pp.515-528.
Brière, M., Oosterlinck, K. and Szafarz, A., 2015. Virtual currency, tangible return: Portfolio
diversification with bitcoin. Journal of Asset Management, 16(6), pp.365-373.
Coeurdacier, N. and Guibaud, S., 2011. International portfolio diversification is better than
you think. Journal of international money and finance, 30(2), pp.289-308.
Fogarty, J.J., 2010. Wine investment and portfolio diversification gains. Journal of Wine
Economics, 5(1), pp.119-131.
GAUDECKER, H. and VON, M., 2015. How does household portfolio diversification vary
with financial literacy and financial advice?. The Journal of Finance, 70(2), pp.489-507.
Mainik, G. and Rüschendorf, L., 2010. On optimal portfolio diversification with respect to
extreme risks. Finance and Stochastics, 14(4), pp.593-623.
Seo, S.N., 2010. Is an integrated farm more resilient against climate change? A micro-
econometric analysis of portfolio diversification in African agriculture. Food Policy, 35(1),
pp.32-40.
Yang, Y., Narayanan, V.K. and De Carolis, D.M., 2014. The relationship between portfolio
diversification and firm value: The evidence from corporate venture capital activity. Strategic
Management Journal, 35(13), pp.1993-2011.
Paraphrase This Document
Need a fresh take? Get an instant paraphrase of this document with our AI Paraphraser
Portfolio analysis
8
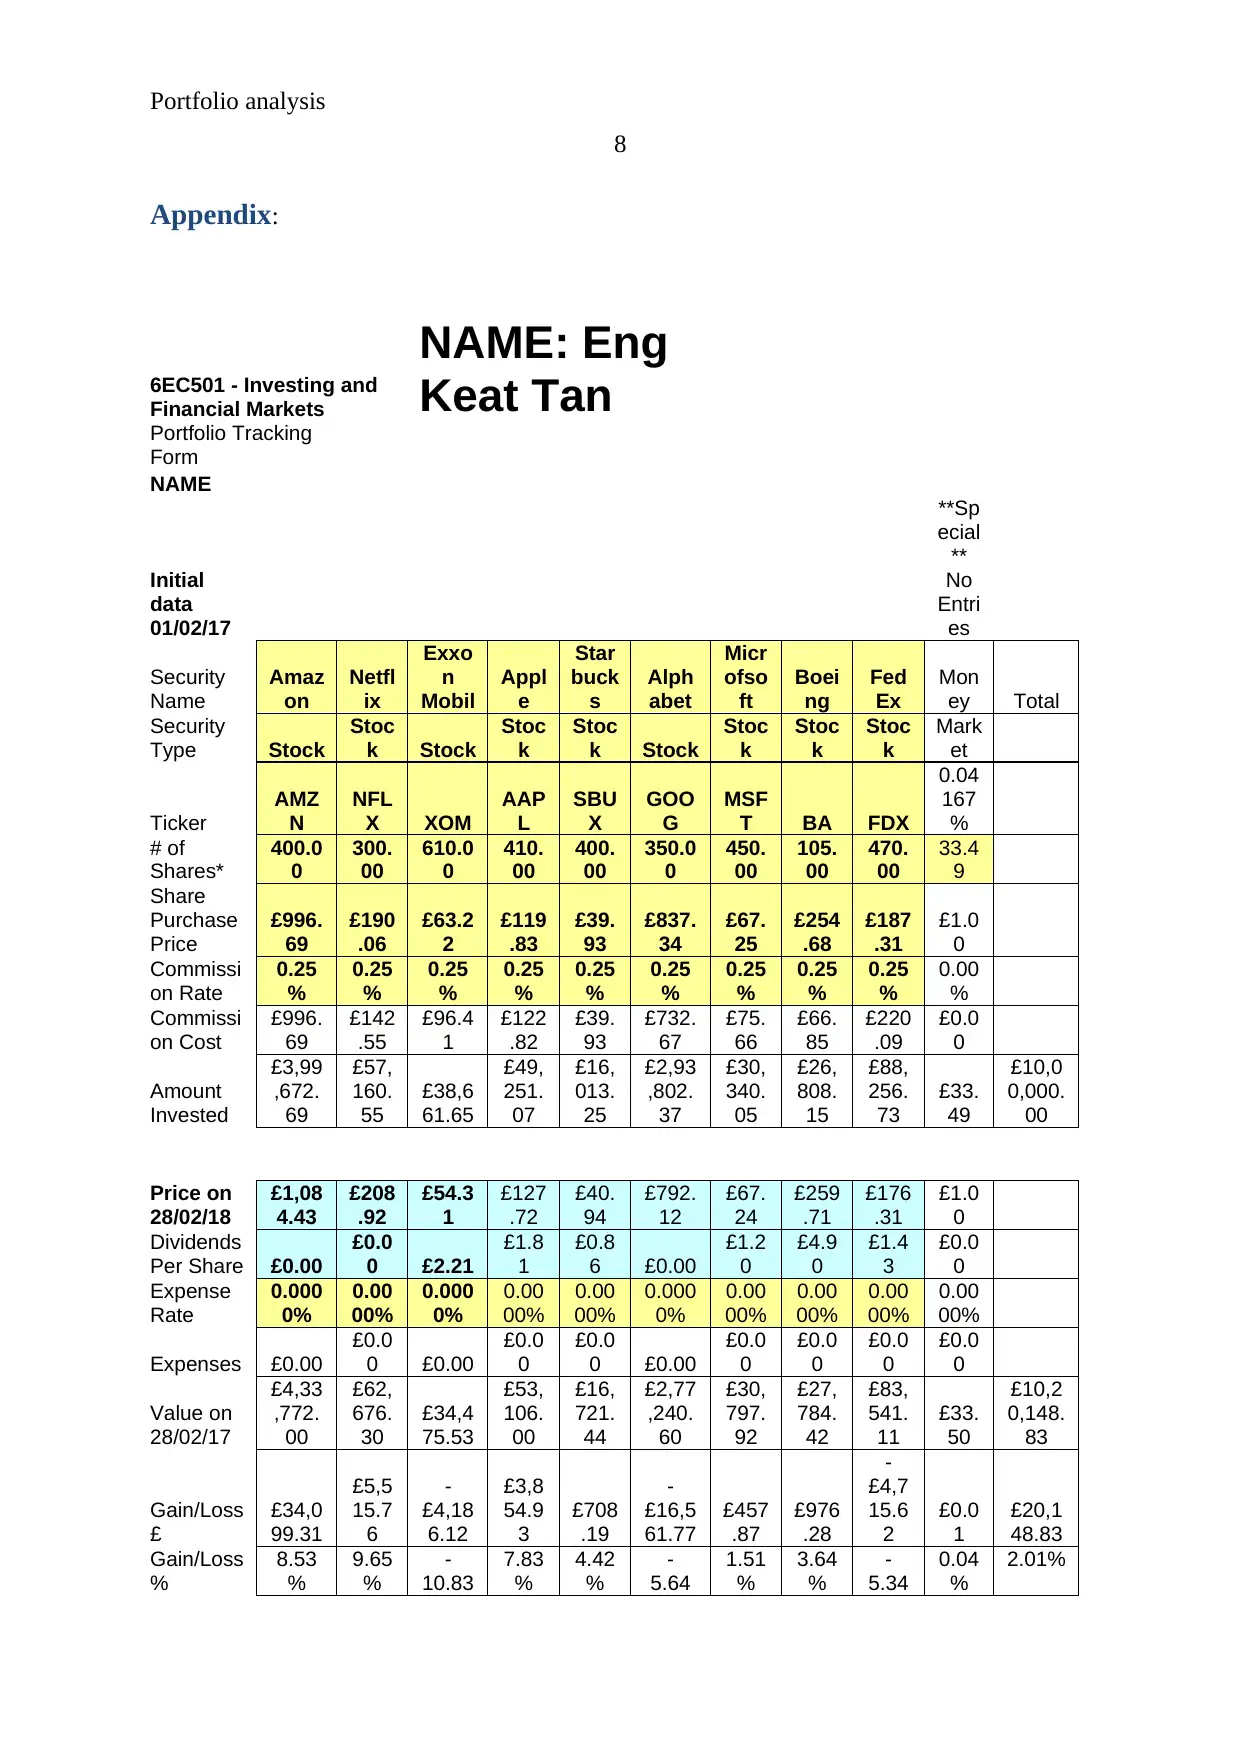
Appendix:
6EC501 - Investing and
Financial Markets
NAME: Eng
Keat Tan
Portfolio Tracking
Form
NAME
**Sp
ecial
**
Initial
data
01/02/17
No
Entri
es
Security
Name
Amaz
on
Netfl
ix
Exxo
n
Mobil
Appl
e
Star
buck
s
Alph
abet
Micr
ofso
ft
Boei
ng
Fed
Ex
Mon
ey Total
Security
Type Stock
Stoc
k Stock
Stoc
k
Stoc
k Stock
Stoc
k
Stoc
k
Stoc
k
Mark
et
Ticker
AMZ
N
NFL
X XOM
AAP
L
SBU
X
GOO
G
MSF
T BA FDX
0.04
167
%
# of
Shares*
400.0
0
300.
00
610.0
0
410.
00
400.
00
350.0
0
450.
00
105.
00
470.
00
33.4
9
Share
Purchase
Price
£996.
69
£190
.06
£63.2
2
£119
.83
£39.
93
£837.
34
£67.
25
£254
.68
£187
.31
£1.0
0
Commissi
on Rate
0.25
%
0.25
%
0.25
%
0.25
%
0.25
%
0.25
%
0.25
%
0.25
%
0.25
%
0.00
%
Commissi
on Cost
£996.
69
£142
.55
£96.4
1
£122
.82
£39.
93
£732.
67
£75.
66
£66.
85
£220
.09
£0.0
0
Amount
Invested
£3,99
,672.
69
£57,
160.
55
£38,6
61.65
£49,
251.
07
£16,
013.
25
£2,93
,802.
37
£30,
340.
05
£26,
808.
15
£88,
256.
73
£33.
49
£10,0
0,000.
00
Price on
28/02/18
£1,08
4.43
£208
.92
£54.3
1
£127
.72
£40.
94
£792.
12
£67.
24
£259
.71
£176
.31
£1.0
0
Dividends
Per Share £0.00
£0.0
0 £2.21
£1.8
1
£0.8
6 £0.00
£1.2
0
£4.9
0
£1.4
3
£0.0
0
Expense
Rate
0.000
0%
0.00
00%
0.000
0%
0.00
00%
0.00
00%
0.000
0%
0.00
00%
0.00
00%
0.00
00%
0.00
00%
Expenses £0.00
£0.0
0 £0.00
£0.0
0
£0.0
0 £0.00
£0.0
0
£0.0
0
£0.0
0
£0.0
0
Value on
28/02/17
£4,33
,772.
00
£62,
676.
30
£34,4
75.53
£53,
106.
00
£16,
721.
44
£2,77
,240.
60
£30,
797.
92
£27,
784.
42
£83,
541.
11
£33.
50
£10,2
0,148.
83
Gain/Loss
£
£34,0
99.31
£5,5
15.7
6
-
£4,18
6.12
£3,8
54.9
3
£708
.19
-
£16,5
61.77
£457
.87
£976
.28
-
£4,7
15.6
2
£0.0
1
£20,1
48.83
Gain/Loss
%
8.53
%
9.65
%
-
10.83
7.83
%
4.42
%
-
5.64
1.51
%
3.64
%
-
5.34
0.04
%
2.01%
8
Appendix:
6EC501 - Investing and
Financial Markets
NAME: Eng
Keat Tan
Portfolio Tracking
Form
NAME
**Sp
ecial
**
Initial
data
01/02/17
No
Entri
es
Security
Name
Amaz
on
Netfl
ix
Exxo
n
Mobil
Appl
e
Star
buck
s
Alph
abet
Micr
ofso
ft
Boei
ng
Fed
Ex
Mon
ey Total
Security
Type Stock
Stoc
k Stock
Stoc
k
Stoc
k Stock
Stoc
k
Stoc
k
Stoc
k
Mark
et
Ticker
AMZ
N
NFL
X XOM
AAP
L
SBU
X
GOO
G
MSF
T BA FDX
0.04
167
%
# of
Shares*
400.0
0
300.
00
610.0
0
410.
00
400.
00
350.0
0
450.
00
105.
00
470.
00
33.4
9
Share
Purchase
Price
£996.
69
£190
.06
£63.2
2
£119
.83
£39.
93
£837.
34
£67.
25
£254
.68
£187
.31
£1.0
0
Commissi
on Rate
0.25
%
0.25
%
0.25
%
0.25
%
0.25
%
0.25
%
0.25
%
0.25
%
0.25
%
0.00
%
Commissi
on Cost
£996.
69
£142
.55
£96.4
1
£122
.82
£39.
93
£732.
67
£75.
66
£66.
85
£220
.09
£0.0
0
Amount
Invested
£3,99
,672.
69
£57,
160.
55
£38,6
61.65
£49,
251.
07
£16,
013.
25
£2,93
,802.
37
£30,
340.
05
£26,
808.
15
£88,
256.
73
£33.
49
£10,0
0,000.
00
Price on
28/02/18
£1,08
4.43
£208
.92
£54.3
1
£127
.72
£40.
94
£792.
12
£67.
24
£259
.71
£176
.31
£1.0
0
Dividends
Per Share £0.00
£0.0
0 £2.21
£1.8
1
£0.8
6 £0.00
£1.2
0
£4.9
0
£1.4
3
£0.0
0
Expense
Rate
0.000
0%
0.00
00%
0.000
0%
0.00
00%
0.00
00%
0.000
0%
0.00
00%
0.00
00%
0.00
00%
0.00
00%
Expenses £0.00
£0.0
0 £0.00
£0.0
0
£0.0
0 £0.00
£0.0
0
£0.0
0
£0.0
0
£0.0
0
Value on
28/02/17
£4,33
,772.
00
£62,
676.
30
£34,4
75.53
£53,
106.
00
£16,
721.
44
£2,77
,240.
60
£30,
797.
92
£27,
784.
42
£83,
541.
11
£33.
50
£10,2
0,148.
83
Gain/Loss
£
£34,0
99.31
£5,5
15.7
6
-
£4,18
6.12
£3,8
54.9
3
£708
.19
-
£16,5
61.77
£457
.87
£976
.28
-
£4,7
15.6
2
£0.0
1
£20,1
48.83
Gain/Loss
%
8.53
%
9.65
%
-
10.83
7.83
%
4.42
%
-
5.64
1.51
%
3.64
%
-
5.34
0.04
%
2.01%
Portfolio analysis
9
% % %
Annualize
d Return
167.1
1%
202.
05%
-
74.72
%
147.
02%
68.0
9%
-
50.16
%
19.6
9%
53.6
1%
-
48.2
6%
27.05
%
AMZN NFLX XOM AAPL SBUX GOOG MSFT BA FDX
0.84% 0.64% 1.27% 4.52% 4.22% -0.87% 3.77% 12.36% -6.86%
-4.76% 14.15% -1.24% 0.03% 6.83% 3.83% 15.69% 6.48% -4.14%
6.06% 4.71% 1.66% 1.57% 3.78% 5.66% 5.44% 8.33% 2.48%
3.15% -6.70% 0.56% -7.58% 4.10% 1.05% -0.34% 3.99% 2.33%
8.47% 15.82% 3.76% 14.12% 8.82% 0.84% -7.82% 2.60% 7.69%
-6.72% 16.13% -7.03% 7.67% -1.08% -4.60% 4.90% -1.12% 1.28%
11.27% 8.91% -0.60% 2.56% 9.46% 3.43% 0.34% 13.58% 6.29%
16.44% 4.29% 4.16% 9.64% 5.30% 17.66% 6.40% 11.06% 14.96%
8.13% 13.43% 4.31% 6.38% 0.51% 2.81% 7.68% 2.87% 5.88%
1.31% 0.65% 9.00% 5.16% -3.46% 5.77% -1.14% 2.04% 3.66%
-
10.06%
11.18% -8.93% -
10.77%
-9.27% 5.38% 1.15% -8.23% -7.17%
0.95% 8.87% 4.46% 5.12% -0.22% 2.94% 1.24% 2.92% 0.01%
-7.11% -21.00% 2.18% 6.43% 3.80% -8.02% 7.80% -2.11% -0.58%
-9.58% -8.52% 4.84% 9.94% -3.76% -5.70% -1.44% 2.81% 2.90%
2.77% 29.74% -1.84% 7.27% 3.71% 6.31% 1.34% 4.83% 5.81%
3.91% 5.45% 0.83% 6.92% 6.04% 2.75% 2.57% -5.40% 5.01%
-3.63% -4.06% -1.73% 2.87% 0.39% -0.64% 3.50% -5.31% -2.83%
8.32% 12.99% 0.53% 7.22% 0.17% 0.00% 5.26% 5.25% 0.68%
-4.90% -5.54% -4.78% -1.22% -2.69% 1.01% 2.68% 1.07% 9.18%
-5.27% -12.95% 2.83% 7.20% 0.13% -3.17% 1.27% -1.94% 3.82%
10.86% -11.76% -6.38% 10.12% 7.48% -3.09% 1.83% 7.57% 6.44%
-8.35% -1.44% 2.85% -6.79% 1.45% -2.85% -2.23% -2.70% -2.54%
14.24% 29.33% -5.44% 6.14% 6.68% 1.54% -
13.02%
11.84% -2.51%
7.23% 7.49% 1.28% 9.64% 6.81% 4.47% 8.54% 3.77% 4.65%
-2.12% -12.26% -3.28% -2.75% 2.04% -1.86% -6.61% 0.10% -6.51%
13.35% 33.55% 2.79% 0.58% 4.71% -1.41% 19.63% -4.49% 2.61%
1.77% 12.14% -2.48% 4.10% 4.80% -0.97% -3.66% -1.97% 2.15%
1.13% 5.27% -1.54% -3.32% 3.52% -2.18% -5.17% -0.65% -1.63%
23.51% 21.80% -4.80% -3.29% 8.04% 20.19% 5.78% 3.93% 0.74%
-4.34% 0.63% -5.01% -6.91% -3.42% 1.92% -6.81% -9.36% -
12.14%
-0.19% -10.23% -0.26% -1.88% 1.87% -4.58% 2.37% 0.85% -4.40%
22.27% 4.96% 11.28% 8.34% 10.08% 16.83% 18.93% 13.07% 8.57%
6.22% 13.79% -1.31% -1.00% -1.89% 4.47% 3.25% -1.77% 1.60%
1.67% -7.26% -3.71% -
10.64%
-1.90% 2.19% 2.77% 0.02% -6.02%
-
13.15%
-19.71% -0.13% -7.52% 1.23% -2.10% -0.70% -16.92% -
10.66%
-5.87% 1.71% 2.95% -0.67% -4.21% -6.08% -7.64% -1.62% 3.01%
7.44% 9.44% 5.24% 13.33% 2.89% 6.76% 9.33% 8.41% 18.88%
⊘ This is a preview!⊘
Do you want full access?
Subscribe today to unlock all pages.
Trusted by 1+ million students worldwide
Portfolio analysis
10
11.11% -11.93% 5.75% -
13.99%
-5.81% -6.97% -9.70% 6.19% 1.65%
9.58% 13.93% 0.70% 6.53% -2.38% 6.16% 6.28% -6.42% -0.08%
-0.99% -10.81% 6.19% -3.68% 4.43% -5.93% -2.78% 3.79% -8.00%
6.04% -0.25% -5.11% 9.01% 1.63% 11.08% 10.77% 2.92% 6.93%
1.36% 6.79% -2.03% 1.81% -3.14% -0.23% 1.38% -3.15% 1.87%
8.86% 1.13% 1.01% 7.13% -3.38% 1.33% 0.87% 2.61% 5.91%
-5.67% 26.71% -4.54% 0.43% -1.98% 0.93% 4.03% 8.11% 0.04%
-4.97% -6.30% 4.78% -2.66% 9.23% -3.38% 0.57% 5.71% 9.95%
2.41% 5.81% 4.31% 5.33% -3.78% 1.82% 3.82% 4.19% -2.85%
7.13% 13.66% -7.06% 4.77% -0.54% 3.24% 4.04% 4.97% 1.77%
2.62% 1.01% -3.06% 12.89% 2.99% 3.32% -1.04% 10.29% 2.05%
4.91% 4.00% 1.77% 5.32% 3.14% 0.77% 3.56% -1.03% 1.12%
4.34% 2.97% -0.44% -0.01% 2.86% 9.21% 3.95% 4.51% -2.59%
7.53% 7.14% -1.41% 6.34% 5.91% 6.50% 2.02% 1.51% 2.18%
-2.68% -8.38% 1.23% -5.33% -7.95% -5.82% -0.74% 6.20% 12.12%
2.04% 21.58% -0.85% 3.27% -7.43% 2.40% 5.47% 22.61% -4.05%
-0.73% -3.83% -4.64% 10.27% 1.63% 0.95% 2.85% -1.15% 3.05%
-1.96% 3.80% 8.44% -5.66% -1.65% 2.11% 0.16% 6.70% 5.22%
14.97% 8.32% 1.67% 9.68% 2.10% 6.00% 11.67% 1.48% 0.34%
6.47% -0.47% -0.07% 1.66% 5.43% 0.47% 1.19% 7.30% 2.50%
-0.62% -1.82% 1.35% -1.17% -0.15% 2.45% 2.14% 7.12% 7.81%
24.06% 40.81% 4.38% -1.06% -1.08% 11.81% 11.07% 20.16% 5.41%
01-02-2013 NFLX XOM SBUX GOOG FDX
01-03-2013 0.64% 1.27% 4.22% -0.00875 -6.86%
01-04-2013 14.15% -1.24% 6.83% 0.038253 -4.14%
01-05-2013 4.71% 1.66% 3.78% 0.056575 2.48%
01-06-2013 -6.70% 0.56% 4.10% 0.010503 2.33%
01-07-2013 15.82% 3.76% 8.82% 0.008383 7.69%
01-08-2013 16.13% -7.03% -1.08% -0.04602 1.28%
01-09-2013 8.91% -0.60% 9.46% 0.034254 6.29%
01-10-2013 4.29% 4.16% 5.30% 0.176582 14.96%
01-11-2013 13.43% 4.31% 0.51% 0.028149 5.88%
01-12-2013 0.65% 9.00% -3.46% 0.057683 3.66%
01-01-2014 11.18% -8.93% -9.27% 0.053769 -7.17%
01-02-2014 8.87% 4.46% -0.22% 0.029366 0.01%
01-03-2014 -21.00% 2.18% 3.80% -0.08023 -0.58%
01-04-2014 -8.52% 4.84% -3.76% -0.05701 2.90%
01-05-2014 29.74% -1.84% 3.71% 0.063096 5.81%
01-06-2014 5.45% 0.83% 6.04% 0.027488 5.01%
01-07-2014 -4.06% -1.73% 0.39% -0.0064 -2.83%
01-08-2014 12.99% 0.53% 0.17% 0 0.68%
01-09-2014 -5.54% -4.78% -2.69% 0.010077 9.18%
01-10-2014 -12.95% 2.83% 0.13% -0.03166 3.82%
01-11-2014 -11.76% -6.38% 7.48% -0.03085 6.44%
01-12-2014 -1.44% 2.85% 1.45% -0.02848 -2.54%
01-01-2015 29.33% -5.44% 6.68% 0.015421 -2.51%
01-02-2015 7.49% 1.28% 6.81% 0.044676 4.65%
Paraphrase This Document
Need a fresh take? Get an instant paraphrase of this document with our AI Paraphraser
Portfolio analysis
11
01-03-2015 -12.26% -3.28% 2.04% -0.01862 -6.51%
01-04-2015 33.55% 2.79% 4.71% -0.01406 2.61%
01-05-2015 12.14% -2.48% 4.80% -0.00973 2.15%
01-06-2015 5.27% -1.54% 3.52% -0.0218 -1.63%
01-07-2015 21.80% -4.80% 8.04% 0.201917 0.74%
01-08-2015 0.63% -5.01% -3.42% 0.019181 -
12.14%
01-09-2015 -10.23% -0.26% 1.87% -0.04578 -4.40%
01-10-2015 4.96% 11.28% 10.08% 0.168288 8.57%
01-11-2015 13.79% -1.31% -1.89% 0.044724 1.60%
01-12-2015 -7.26% -3.71% -1.90% 0.021923 -6.02%
01-01-2016 -19.71% -0.13% 1.23% -0.02099 -
10.66%
01-02-2016 1.71% 2.95% -4.21% -0.06081 3.01%
01-03-2016 9.44% 5.24% 2.89% 0.067615 18.88%
01-04-2016 -11.93% 5.75% -5.81% -0.06972 1.65%
01-05-2016 13.93% 0.70% -2.38% 0.06163 -0.08%
01-06-2016 -10.81% 6.19% 4.43% -0.05929 -8.00%
01-07-2016 -0.25% -5.11% 1.63% 0.110808 6.93%
01-08-2016 6.79% -2.03% -3.14% -0.00226 1.87%
01-09-2016 1.13% 1.01% -3.38% 0.01335 5.91%
01-10-2016 26.71% -4.54% -1.98% 0.009327 0.04%
01-11-2016 -6.30% 4.78% 9.23% -0.03378 9.95%
01-12-2016 5.81% 4.31% -3.78% 0.018178 -2.85%
01-01-2017 13.66% -7.06% -0.54% 0.032352 1.77%
01-02-2017 1.01% -3.06% 2.99% 0.033158 2.05%
01-03-2017 4.00% 1.77% 3.14% 0.007714 1.12%
01-04-2017 2.97% -0.44% 2.86% 0.092097 -2.59%
01-05-2017 7.14% -1.41% 5.91% 0.065014 2.18%
01-06-2017 -8.38% 1.23% -7.95% -0.05817 12.12%
01-07-2017 21.58% -0.85% -7.43% 0.023957 -4.05%
01-08-2017 -3.83% -4.64% 1.63% 0.00949 3.05%
01-09-2017 3.80% 8.44% -1.65% 0.021058 5.22%
01-10-2017 8.32% 1.67% 2.10% 0.059983 0.34%
01-11-2017 -0.47% -0.07% 5.43% 0.004692 2.50%
01-12-2017 -1.82% 1.35% -0.15% 0.024466 7.81%
01-01-2018 40.81% 4.38% -1.08% 0.118062 5.41%
4.74% 0.32% 1.48% 2.00% 1.78%
12.76% 4.21% 4.52% 5.74% 5.81%
1.63% 0.18% 0.20% 0.33% 0.34%
NFLX XOM SBUX GOOG FDX
NFLX 1
XOM -0.12685 1
SBUX 0.066639 0.089066517 1
GOOG 0.464718 0.018151768 0.257261 1
FDX 0.118067 0.320962589 0.199247 0.269125 1
NFL
X
XOM SBU
X
GOO
G
FDX E(R
p)
Var(
P)
Stde
v(P)
BET
A
Sharpe
Ratio
Portfolio analysis
12
Initial Weights 0.05
7161
0.038
662
0.016
013
0.293
802
0.088
257
Initial Weighting
recalculated
0.18 0.095 0.025 0.32 0.28 2.05
7%
0.001
83
0.042
776
1.00
2043
0.3640
37
equal weighting 0.2 0.2 0.2 0.2 0.2 2.06
1%
0.001
635
0.040
434
0.99
796
0.3861
27
Descending
Weightings
0.2 0.1 0.05 0.35 0.3 2.28
6%
0.002
221
0.047
127
1.10
1545
0.3789
65
⊘ This is a preview!⊘
Do you want full access?
Subscribe today to unlock all pages.
Trusted by 1+ million students worldwide
1 out of 12
Your All-in-One AI-Powered Toolkit for Academic Success.
+13062052269
info@desklib.com
Available 24*7 on WhatsApp / Email
![[object Object]](/_next/static/media/star-bottom.7253800d.svg)
Unlock your academic potential
Copyright © 2020–2026 A2Z Services. All Rights Reserved. Developed and managed by ZUCOL.