PSY392 - Behavioral Science: Data Analysis and Statistical Methods
VerifiedAdded on 2023/06/03
|12
|1430
|61
Homework Assignment
AI Summary
This assignment solution for PSY392 Methods of Data Analysis explores various statistical methods applied to behavioral science data. It includes a chi-square test to analyze the relationship between students' fear of statistics and semesters, Pearson correlation to assess relationships between gender, age, satisfaction with life, and flourishing scores, and regression analysis to determine if flourishing predicts satisfaction with life. Additionally, the assignment utilizes a one-way MANOVA to examine differences between programs in terms of age, expected grade, and flourishing, and independent samples t-tests, one-way ANOVA, and linear regression to analyze gender differences in satisfaction with life. The results and interpretations of each test are thoroughly discussed, providing a comprehensive overview of statistical analysis in behavioral science.
RUNNING HEADER: BEHAVIORAL SCIENCE 1
Student’s Name (official):
Student’s PI:
Course Code:
TMA No:
Date:
Question 1
a) The most appropriate statistical test that should be used to analyze this test is a chi-square
test for independence. Moreover, the test is referred to Pearson’s chi-square test or as the
chi-square test of association. It is employed in finding out if there is an asssociation
between two variables that are categorical (Sedgwick, 2012).
b) Hypothesis:
H0: There is no change between students’ fear of statistics and the semesters.
H1: There is a change between students’ fear of statistics and the semesters.
Paraphrase This Document
Need a fresh take? Get an instant paraphrase of this document with our AI Paraphraser
Behavioral Science 2
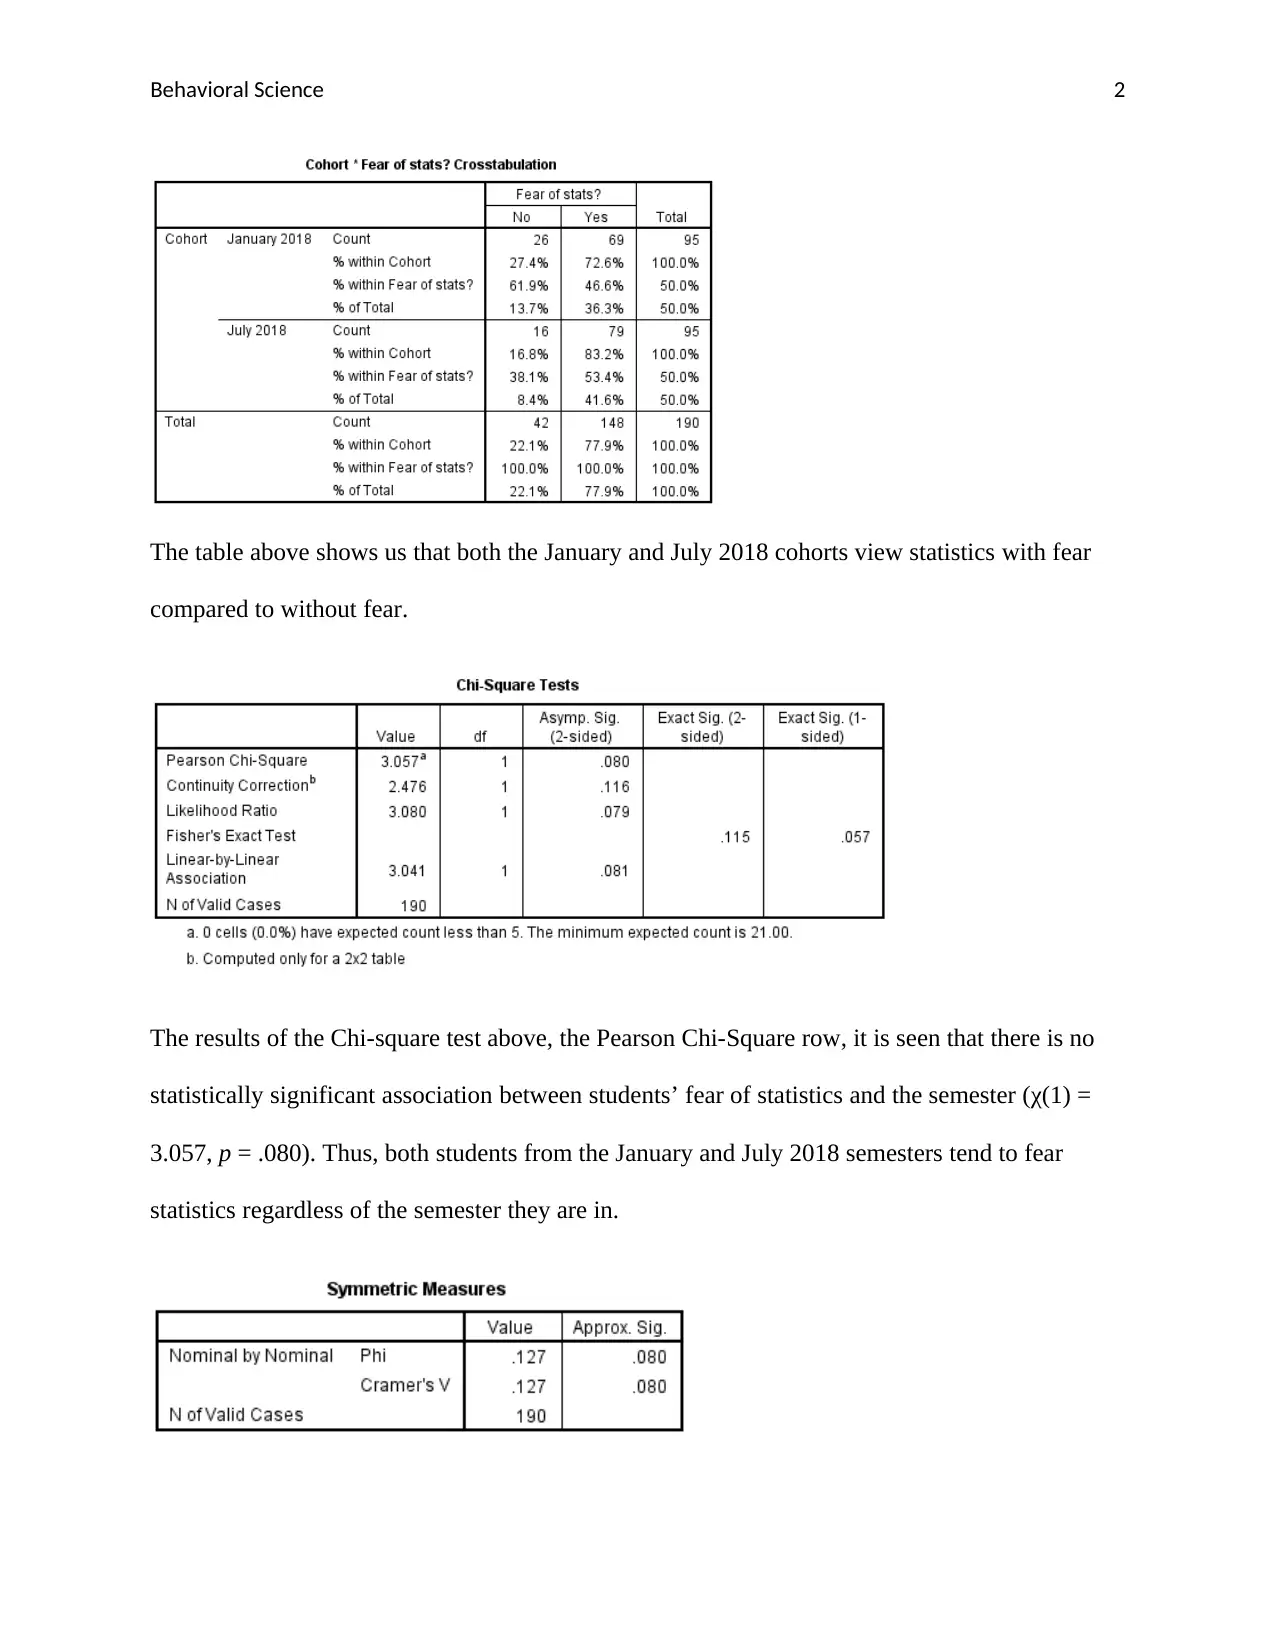
The table above shows us that both the January and July 2018 cohorts view statistics with fear
compared to without fear.
The results of the Chi-square test above, the Pearson Chi-Square row, it is seen that there is no
statistically significant association between students’ fear of statistics and the semester (χ(1) =
3.057, p = .080). Thus, both students from the January and July 2018 semesters tend to fear
statistics regardless of the semester they are in.
Behavioral Science 3
It is also evident from the table above that the strength of association between the variables is
very weak. Hence, the fear of statistics cannot be restricted to any particular semester.
Question 2
a) Potential issues of running the Pearson correlation with gender, age, satisfaction with life
and flourishing score is that the correlation assumes that there is always no linear
relationship between the variables which might not be the case at all (Hauke &
Kossowski, 2011).
b) Correlation
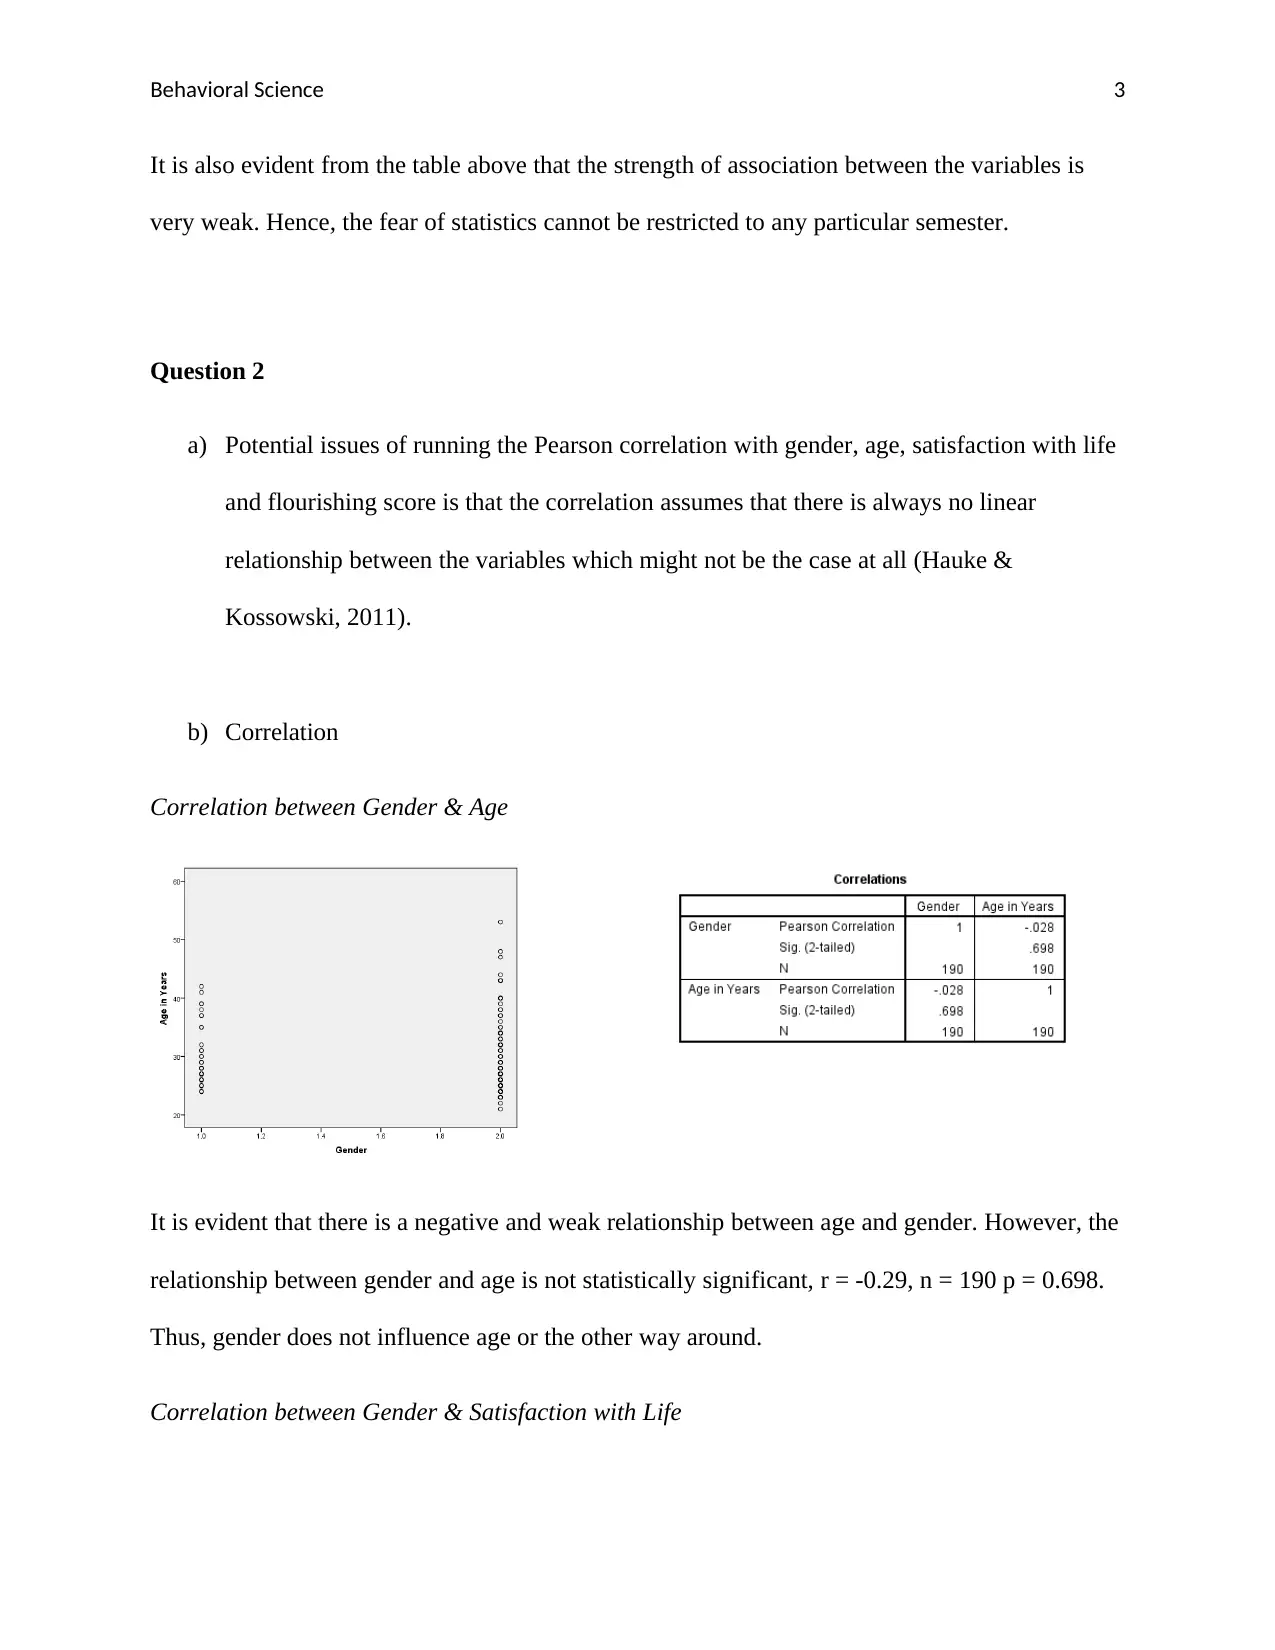
Correlation between Gender & Age
It is evident that there is a negative and weak relationship between age and gender. However, the
relationship between gender and age is not statistically significant, r = -0.29, n = 190 p = 0.698.
Thus, gender does not influence age or the other way around.
Correlation between Gender & Satisfaction with Life
It is also evident from the table above that the strength of association between the variables is
very weak. Hence, the fear of statistics cannot be restricted to any particular semester.
Question 2
a) Potential issues of running the Pearson correlation with gender, age, satisfaction with life
and flourishing score is that the correlation assumes that there is always no linear
relationship between the variables which might not be the case at all (Hauke &
Kossowski, 2011).
b) Correlation
Correlation between Gender & Age
It is evident that there is a negative and weak relationship between age and gender. However, the
relationship between gender and age is not statistically significant, r = -0.29, n = 190 p = 0.698.
Thus, gender does not influence age or the other way around.
Correlation between Gender & Satisfaction with Life
⊘ This is a preview!⊘
Do you want full access?
Subscribe today to unlock all pages.
Trusted by 1+ million students worldwide
Behavioral Science 4
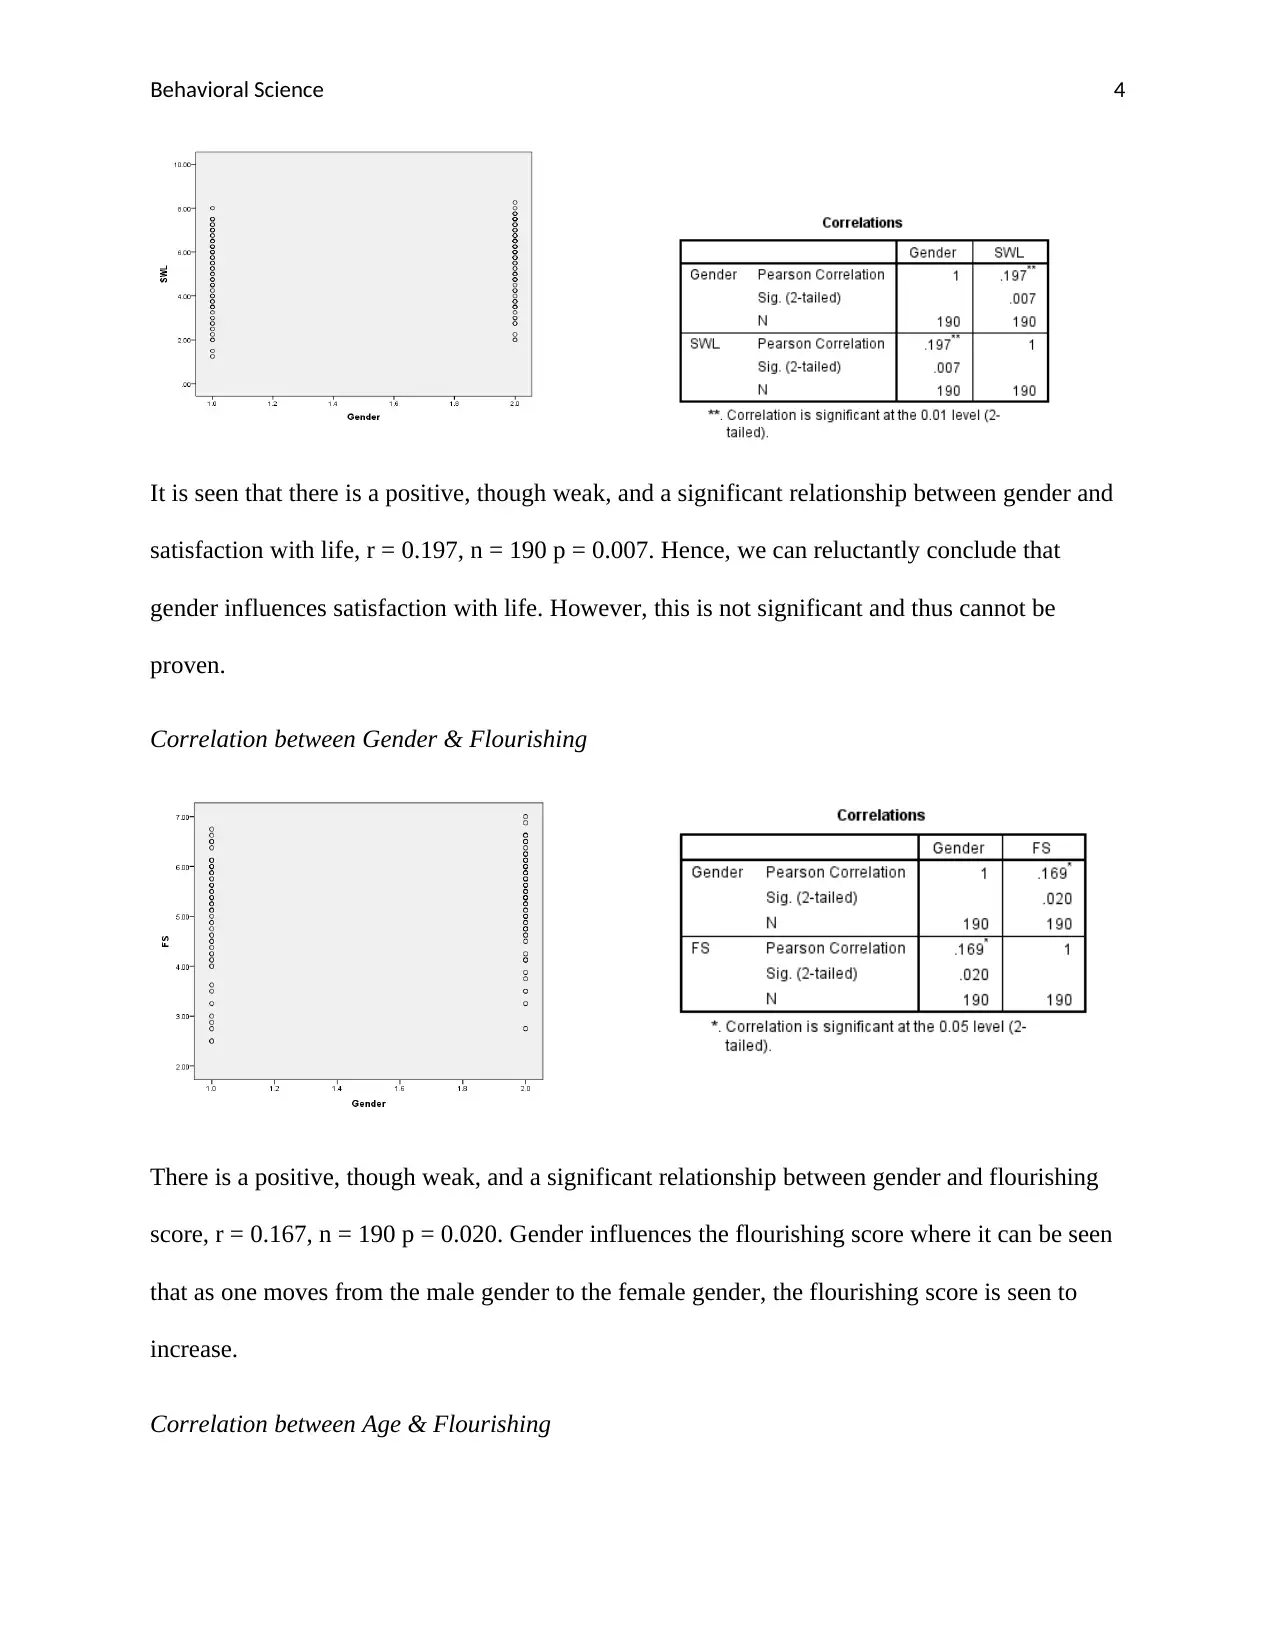
It is seen that there is a positive, though weak, and a significant relationship between gender and
satisfaction with life, r = 0.197, n = 190 p = 0.007. Hence, we can reluctantly conclude that
gender influences satisfaction with life. However, this is not significant and thus cannot be
proven.
Correlation between Gender & Flourishing
There is a positive, though weak, and a significant relationship between gender and flourishing
score, r = 0.167, n = 190 p = 0.020. Gender influences the flourishing score where it can be seen
that as one moves from the male gender to the female gender, the flourishing score is seen to
increase.
Correlation between Age & Flourishing
Paraphrase This Document
Need a fresh take? Get an instant paraphrase of this document with our AI Paraphraser
Behavioral Science 5
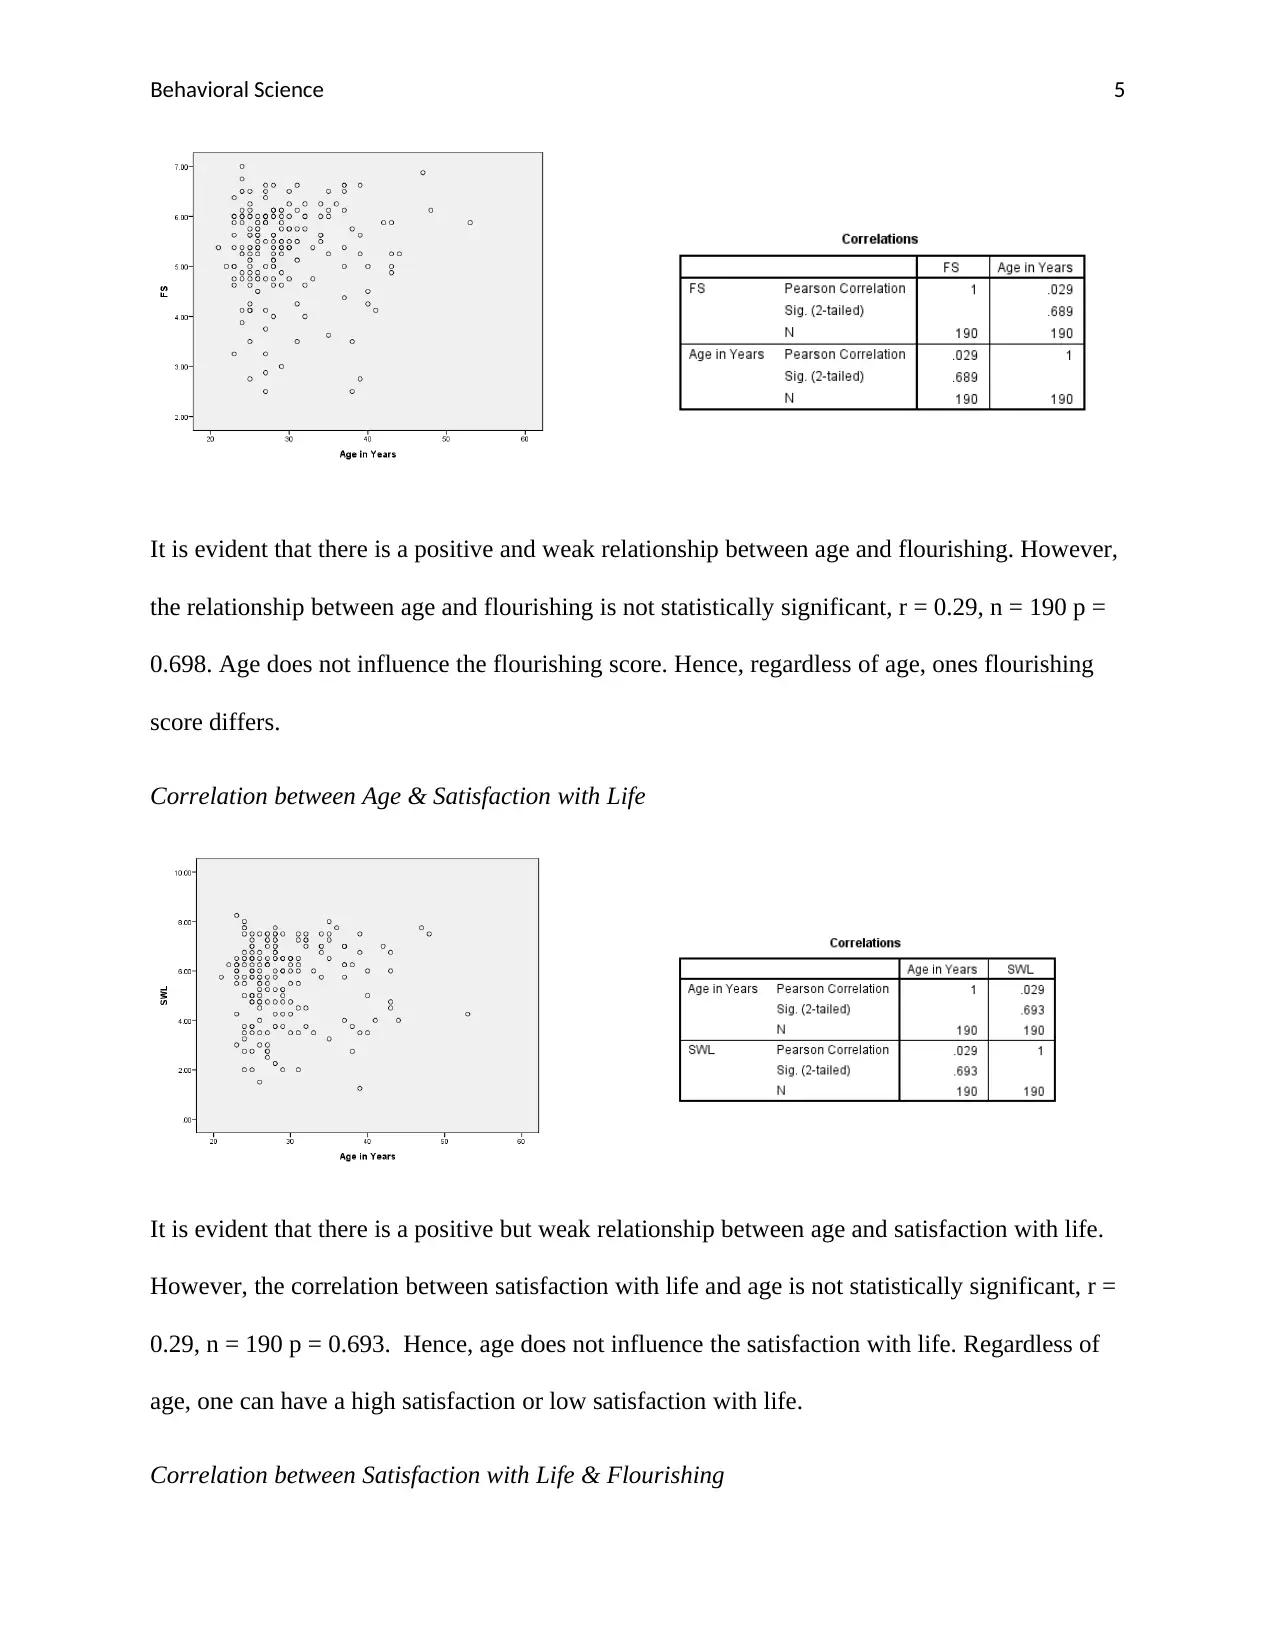
It is evident that there is a positive and weak relationship between age and flourishing. However,
the relationship between age and flourishing is not statistically significant, r = 0.29, n = 190 p =
0.698. Age does not influence the flourishing score. Hence, regardless of age, ones flourishing
score differs.
Correlation between Age & Satisfaction with Life
It is evident that there is a positive but weak relationship between age and satisfaction with life.
However, the correlation between satisfaction with life and age is not statistically significant, r =
0.29, n = 190 p = 0.693. Hence, age does not influence the satisfaction with life. Regardless of
age, one can have a high satisfaction or low satisfaction with life.
Correlation between Satisfaction with Life & Flourishing
Behavioral Science 6
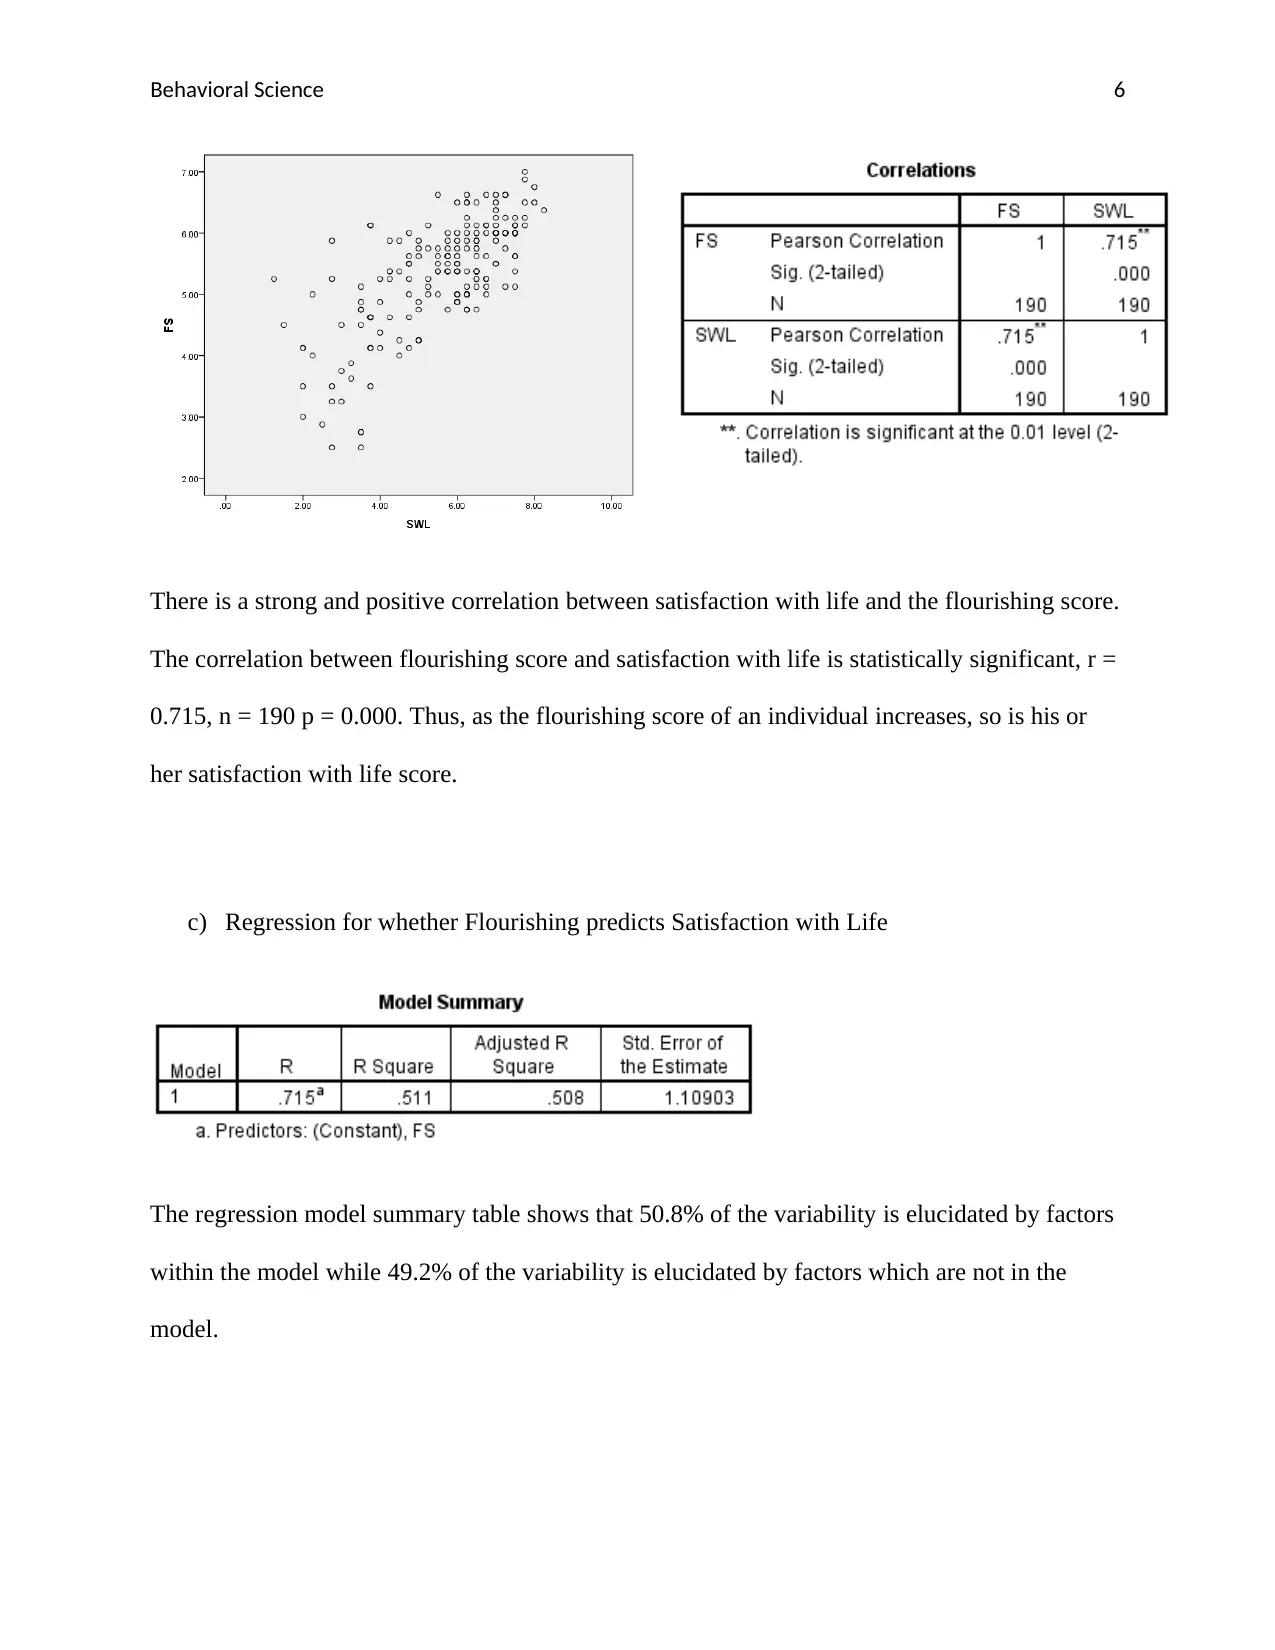
There is a strong and positive correlation between satisfaction with life and the flourishing score.
The correlation between flourishing score and satisfaction with life is statistically significant, r =
0.715, n = 190 p = 0.000. Thus, as the flourishing score of an individual increases, so is his or
her satisfaction with life score.
c) Regression for whether Flourishing predicts Satisfaction with Life
The regression model summary table shows that 50.8% of the variability is elucidated by factors
within the model while 49.2% of the variability is elucidated by factors which are not in the
model.
⊘ This is a preview!⊘
Do you want full access?
Subscribe today to unlock all pages.
Trusted by 1+ million students worldwide
Behavioral Science 7
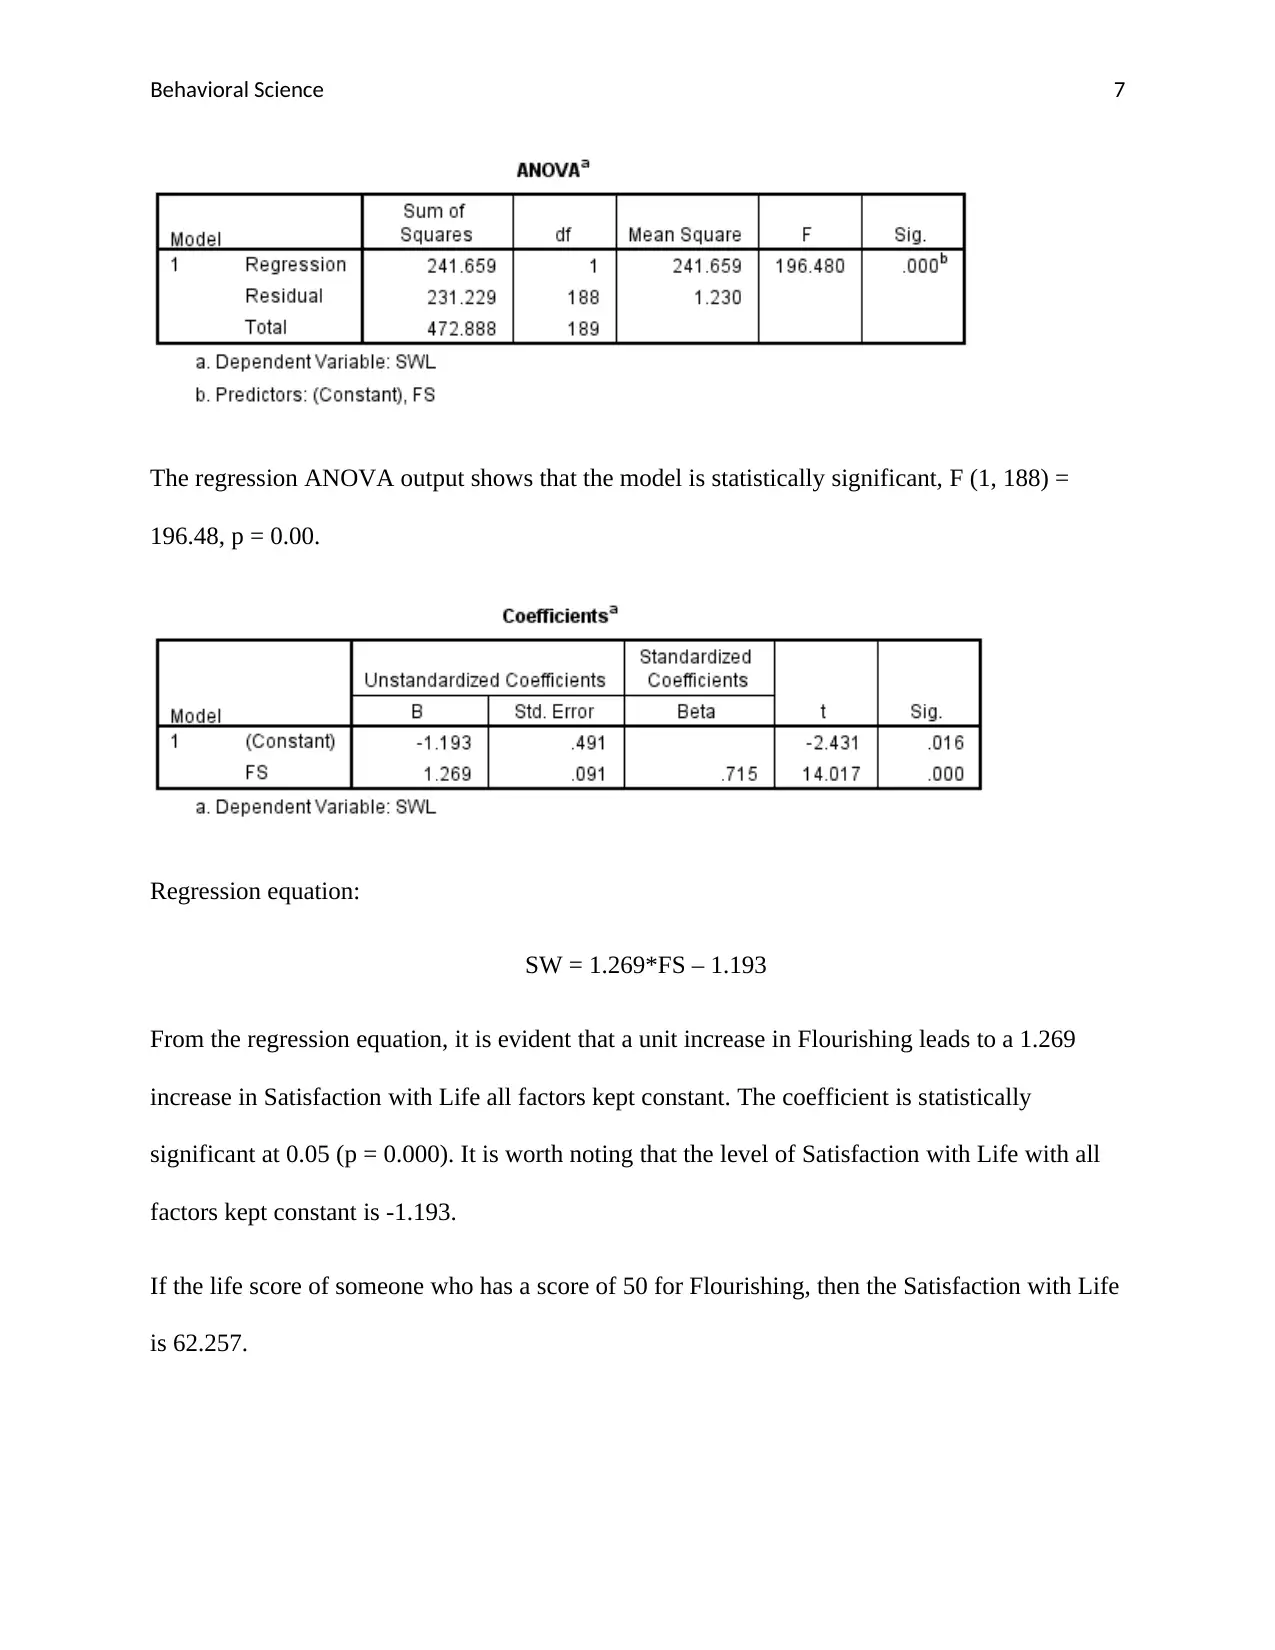
The regression ANOVA output shows that the model is statistically significant, F (1, 188) =
196.48, p = 0.00.
Regression equation:
SW = 1.269*FS – 1.193
From the regression equation, it is evident that a unit increase in Flourishing leads to a 1.269
increase in Satisfaction with Life all factors kept constant. The coefficient is statistically
significant at 0.05 (p = 0.000). It is worth noting that the level of Satisfaction with Life with all
factors kept constant is -1.193.
If the life score of someone who has a score of 50 for Flourishing, then the Satisfaction with Life
is 62.257.
Paraphrase This Document
Need a fresh take? Get an instant paraphrase of this document with our AI Paraphraser
Behavioral Science 8
Question 3
a)
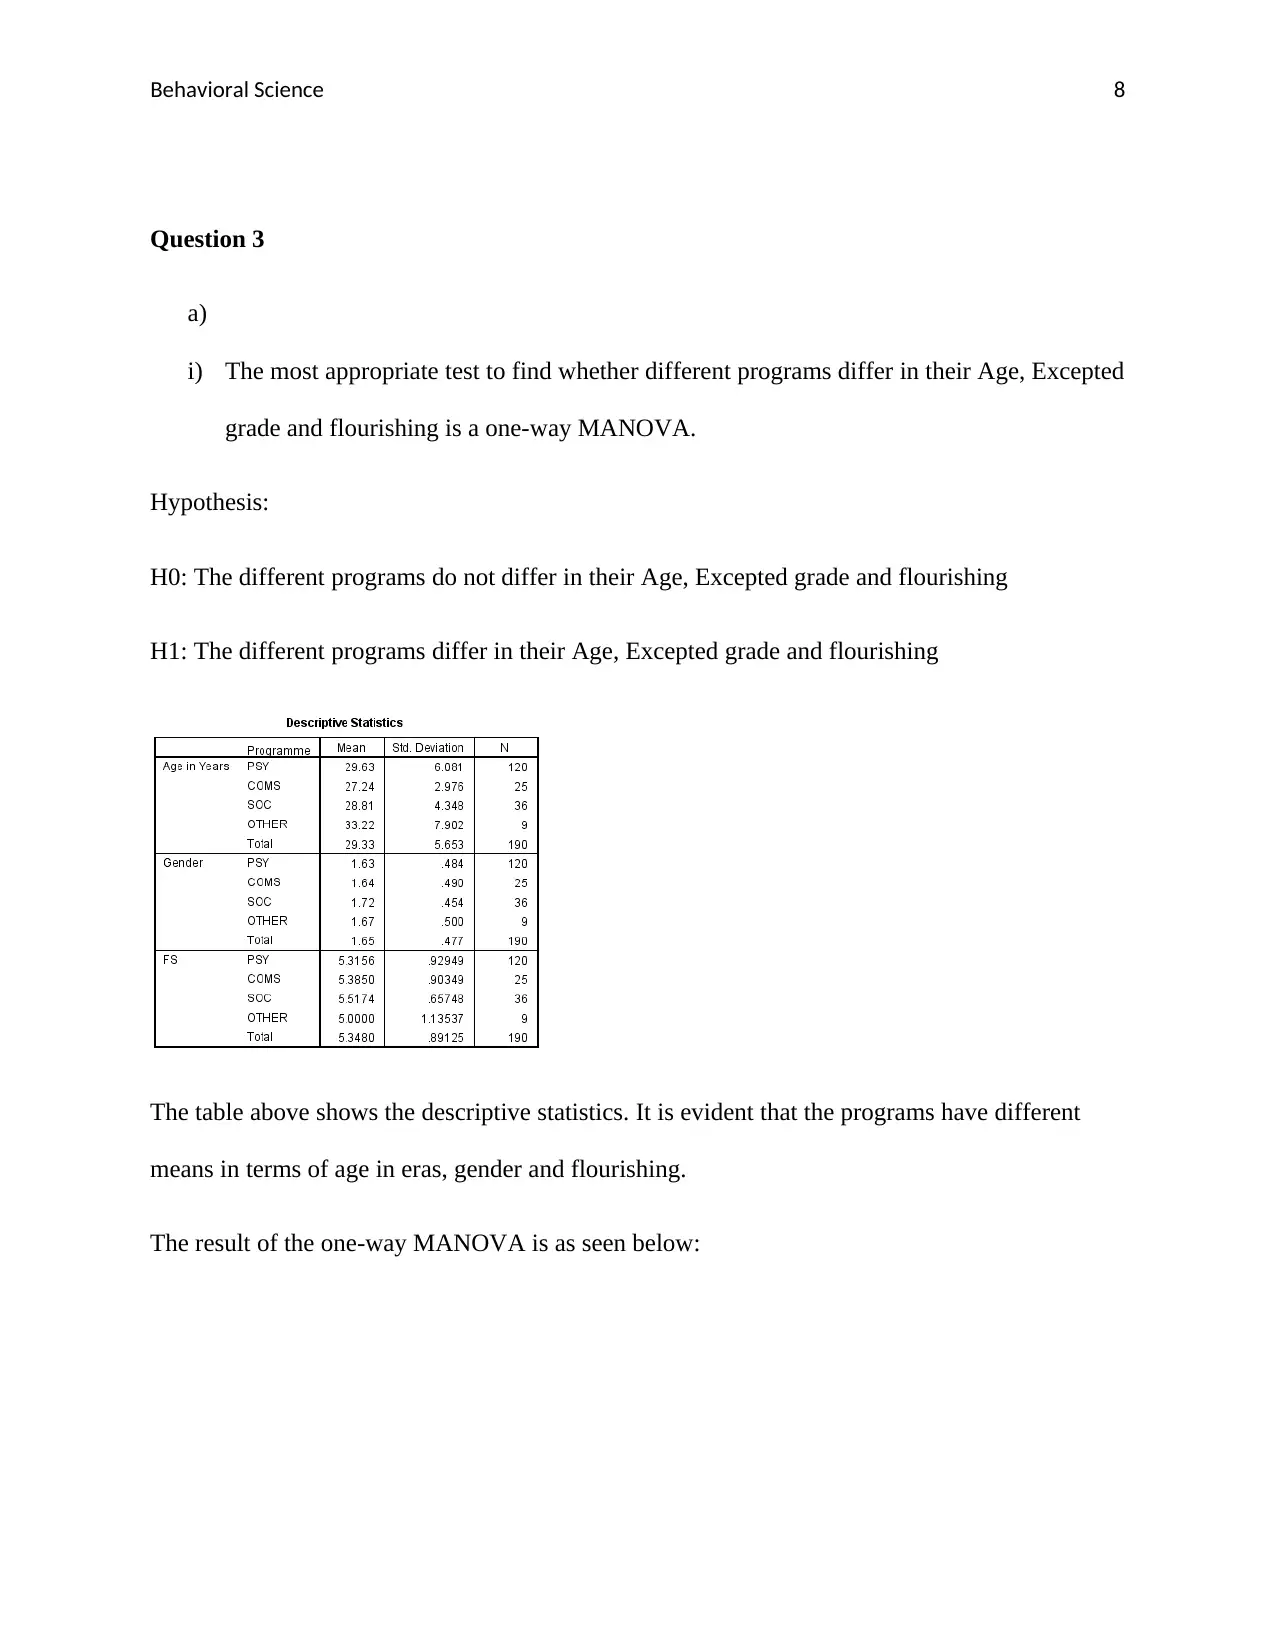
i) The most appropriate test to find whether different programs differ in their Age, Excepted
grade and flourishing is a one-way MANOVA.
Hypothesis:
H0: The different programs do not differ in their Age, Excepted grade and flourishing
H1: The different programs differ in their Age, Excepted grade and flourishing
The table above shows the descriptive statistics. It is evident that the programs have different
means in terms of age in eras, gender and flourishing.
The result of the one-way MANOVA is as seen below:
Question 3
a)
i) The most appropriate test to find whether different programs differ in their Age, Excepted
grade and flourishing is a one-way MANOVA.
Hypothesis:
H0: The different programs do not differ in their Age, Excepted grade and flourishing
H1: The different programs differ in their Age, Excepted grade and flourishing
The table above shows the descriptive statistics. It is evident that the programs have different
means in terms of age in eras, gender and flourishing.
The result of the one-way MANOVA is as seen below:
Behavioral Science 9
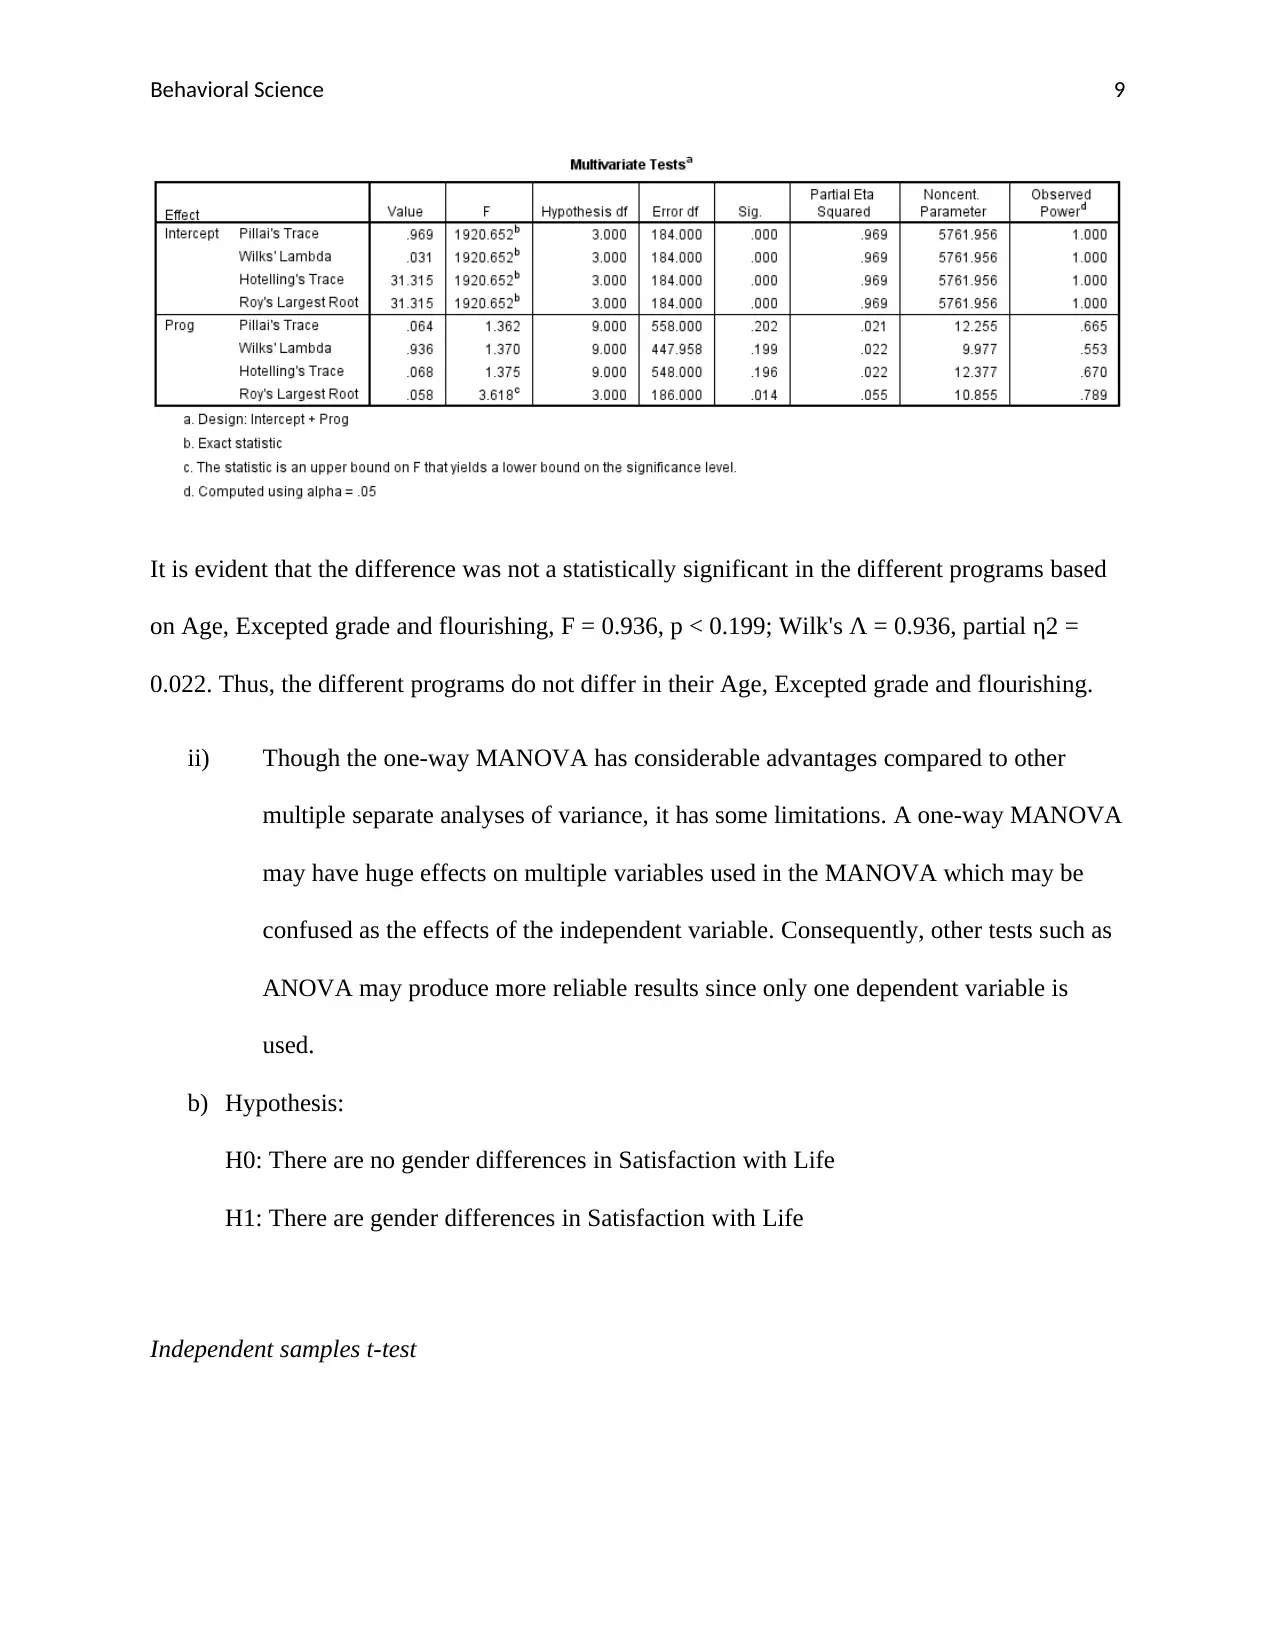
It is evident that the difference was not a statistically significant in the different programs based
on Age, Excepted grade and flourishing, F = 0.936, p < 0.199; Wilk's Λ = 0.936, partial η2 =
0.022. Thus, the different programs do not differ in their Age, Excepted grade and flourishing.
ii) Though the one-way MANOVA has considerable advantages compared to other
multiple separate analyses of variance, it has some limitations. A one-way MANOVA
may have huge effects on multiple variables used in the MANOVA which may be
confused as the effects of the independent variable. Consequently, other tests such as
ANOVA may produce more reliable results since only one dependent variable is
used.
b) Hypothesis:
H0: There are no gender differences in Satisfaction with Life
H1: There are gender differences in Satisfaction with Life
Independent samples t-test
⊘ This is a preview!⊘
Do you want full access?
Subscribe today to unlock all pages.
Trusted by 1+ million students worldwide
Behavioral Science 10
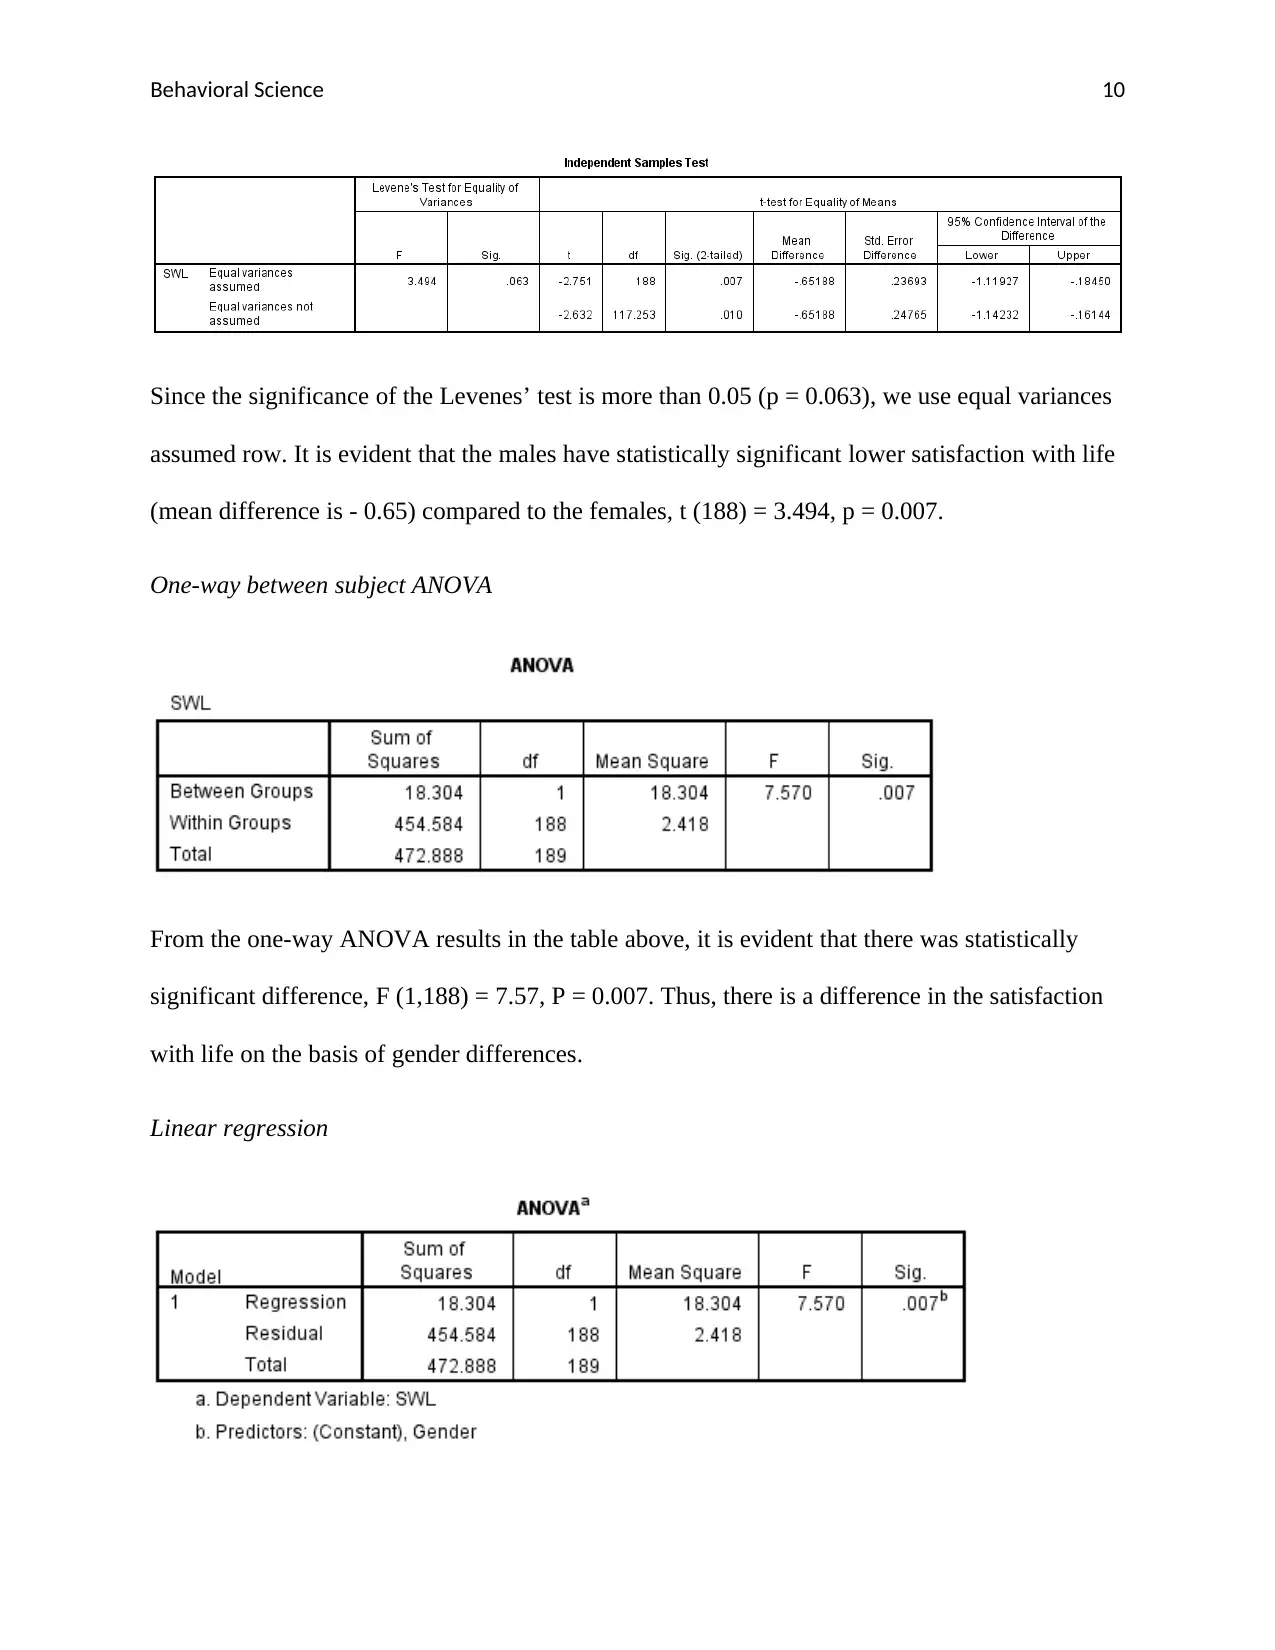
Since the significance of the Levenes’ test is more than 0.05 (p = 0.063), we use equal variances
assumed row. It is evident that the males have statistically significant lower satisfaction with life
(mean difference is - 0.65) compared to the females, t (188) = 3.494, p = 0.007.
One-way between subject ANOVA
From the one-way ANOVA results in the table above, it is evident that there was statistically
significant difference, F (1,188) = 7.57, P = 0.007. Thus, there is a difference in the satisfaction
with life on the basis of gender differences.
Linear regression
Paraphrase This Document
Need a fresh take? Get an instant paraphrase of this document with our AI Paraphraser
Behavioral Science 11
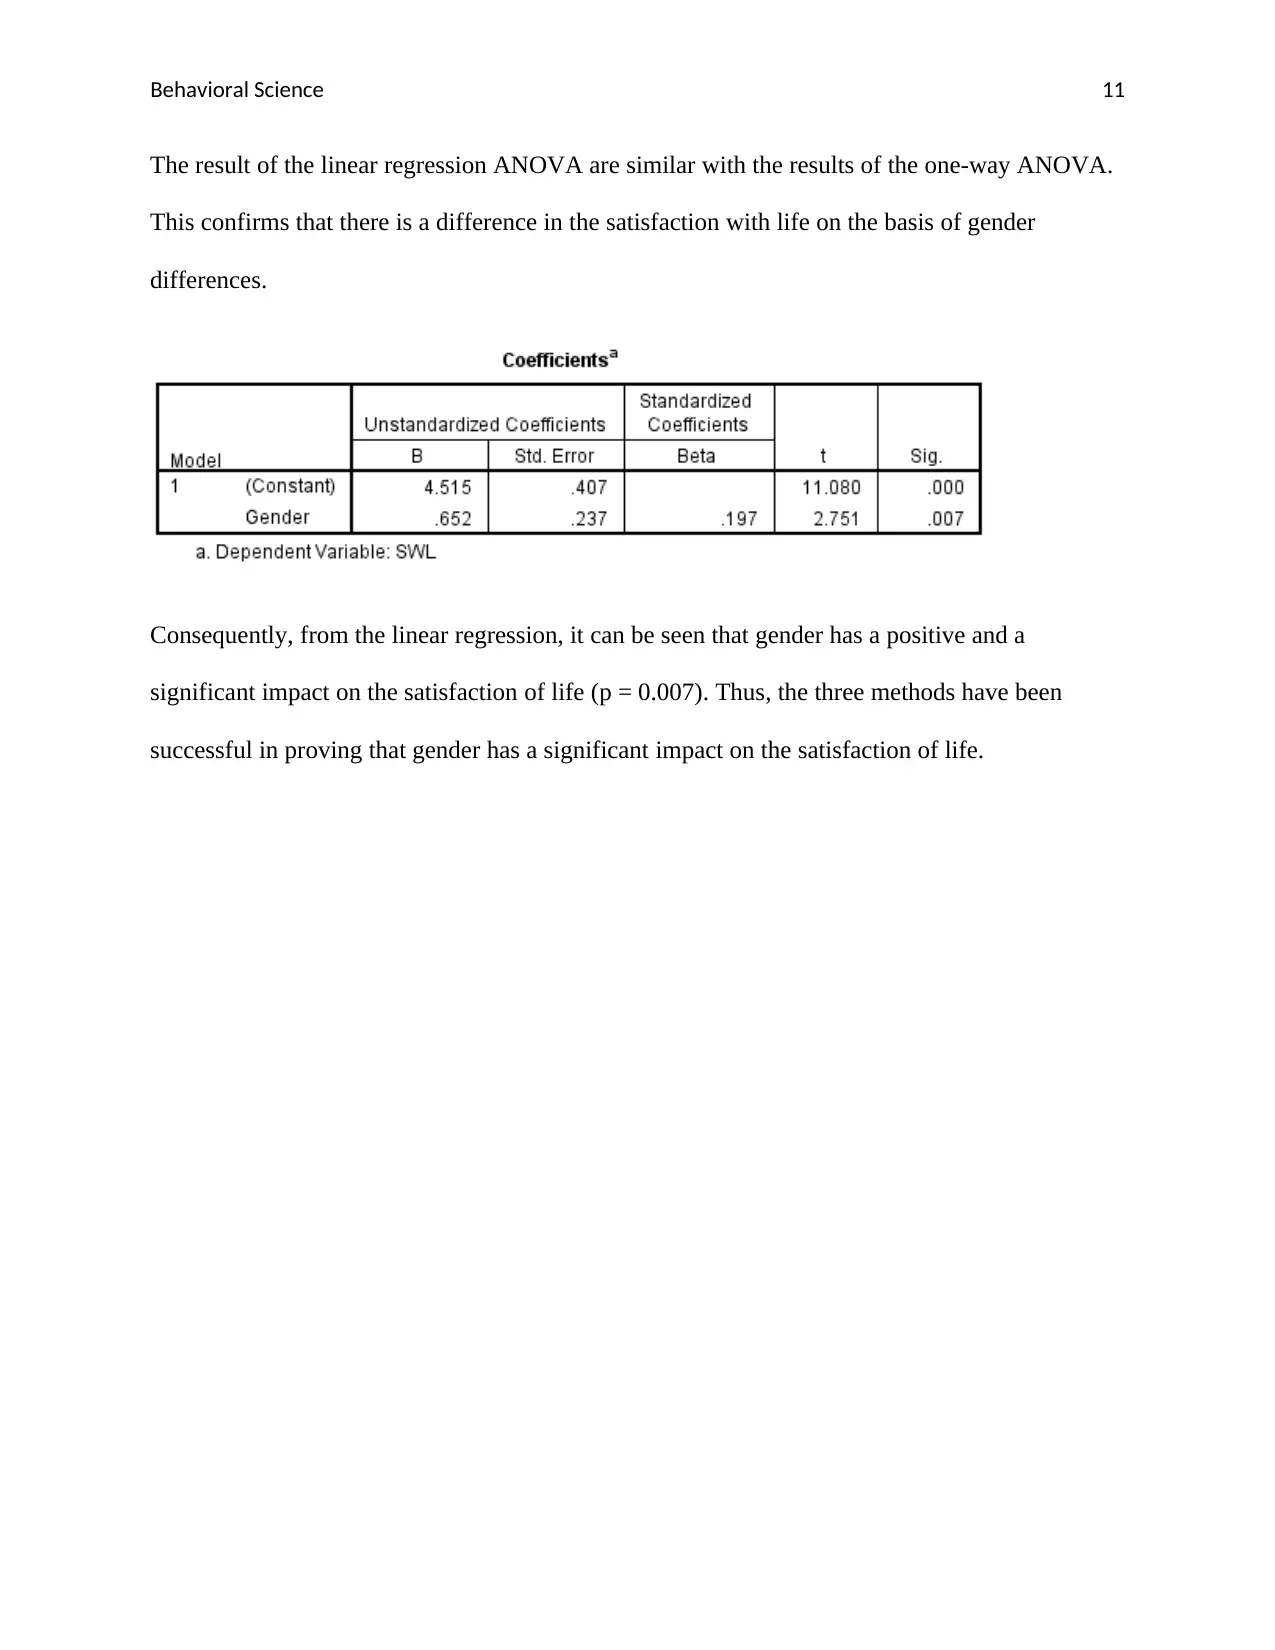
The result of the linear regression ANOVA are similar with the results of the one-way ANOVA.
This confirms that there is a difference in the satisfaction with life on the basis of gender
differences.
Consequently, from the linear regression, it can be seen that gender has a positive and a
significant impact on the satisfaction of life (p = 0.007). Thus, the three methods have been
successful in proving that gender has a significant impact on the satisfaction of life.
Behavioral Science 12
References:
Hauke, J., & Kossowski, T. (2011). Comparison of values of Pearson's and Spearman's
correlation coefficients on the same sets of data. Quaestiones geographicae, 30(2), 87-93.
Sedgwick, P. (2012). Pearson’s correlation coefficient. Bmj, 345, e4483.
References:
Hauke, J., & Kossowski, T. (2011). Comparison of values of Pearson's and Spearman's
correlation coefficients on the same sets of data. Quaestiones geographicae, 30(2), 87-93.
Sedgwick, P. (2012). Pearson’s correlation coefficient. Bmj, 345, e4483.
⊘ This is a preview!⊘
Do you want full access?
Subscribe today to unlock all pages.
Trusted by 1+ million students worldwide
1 out of 12