BHP Billiton Financial Analysis
VerifiedAdded on 2021/05/27
|6
|1291
|75
AI Summary
Contribute Materials
Your contribution can guide someone’s learning journey. Share your
documents today.
FINANCIAL ANALYSIS: BHP BILLITON
Historical Performance
In 2016, BHP Billiton reported revenues of $26 billion which was a 31% decline from its 2015
revenues of $34b. The reason for the fall in revenue was attributed to the huge drop in
commodity prices (Reuters, 2018). As a result, BHP earnings were wiped out and the company
reported a loss of $6.5 billion in 2016 leading to a drop in share prices. Its Return on Assets and
Return on Equity were negative at -5.28% and -11.09% respectively. A negative ROA and/or
ROE suggest that the company was operating inefficiently in 2016 (Subramanya & Wild, 2009).
Despite the above, BHP Billiton was still able to cover its short term liabilities using its current
assets. In 2016, it had a current ratio of 1:1.44 and quick ratio of 1:1.16. Hence, BHP was still
considered a liquid company amongst its peers. However, in the same year the company
increased its long term debt levels to $33 billion leading to debt to equity ratio of 60%. A high
ratio suggests that BHP was an above average leverage company (Ro, 2015). Even though a high
debt to equity ratio is common with large companies, it could also suggest the company has a lot
of debt in its books which is not sustainable. This could lead to solvency problems which could
deter investors from the company.
Current Performance
In 2017 and 2018, BHP was able to recover from its negative outlook from 2016. In 2018, BHP
Billiton’s revenues increased by 21% from 2017. Similarly in 2017, revenues increased by 17%
increase from 2016 suggesting that the company has been doing well in the current years.
Furthermore, BHP reported a profit after tax of $5.9 billion and $3.7 billion in 2017 and 2018
respectively. Its Return on Assets and Return on Equity were positive at 6.91% and 12.76%
respectively, suggesting that the company was operating efficiently in 2018. Furthermore, a
positive ROA value shows the company is making a good return on its assets (Investing
Answers, 2017). Following the good results, BHP Billiton was able to pay dividends amounting
to $5.2 billion in 2018 in comparison to 2016.
1
Secure Best Marks with AI Grader
Need help grading? Try our AI Grader for instant feedback on your assignments.
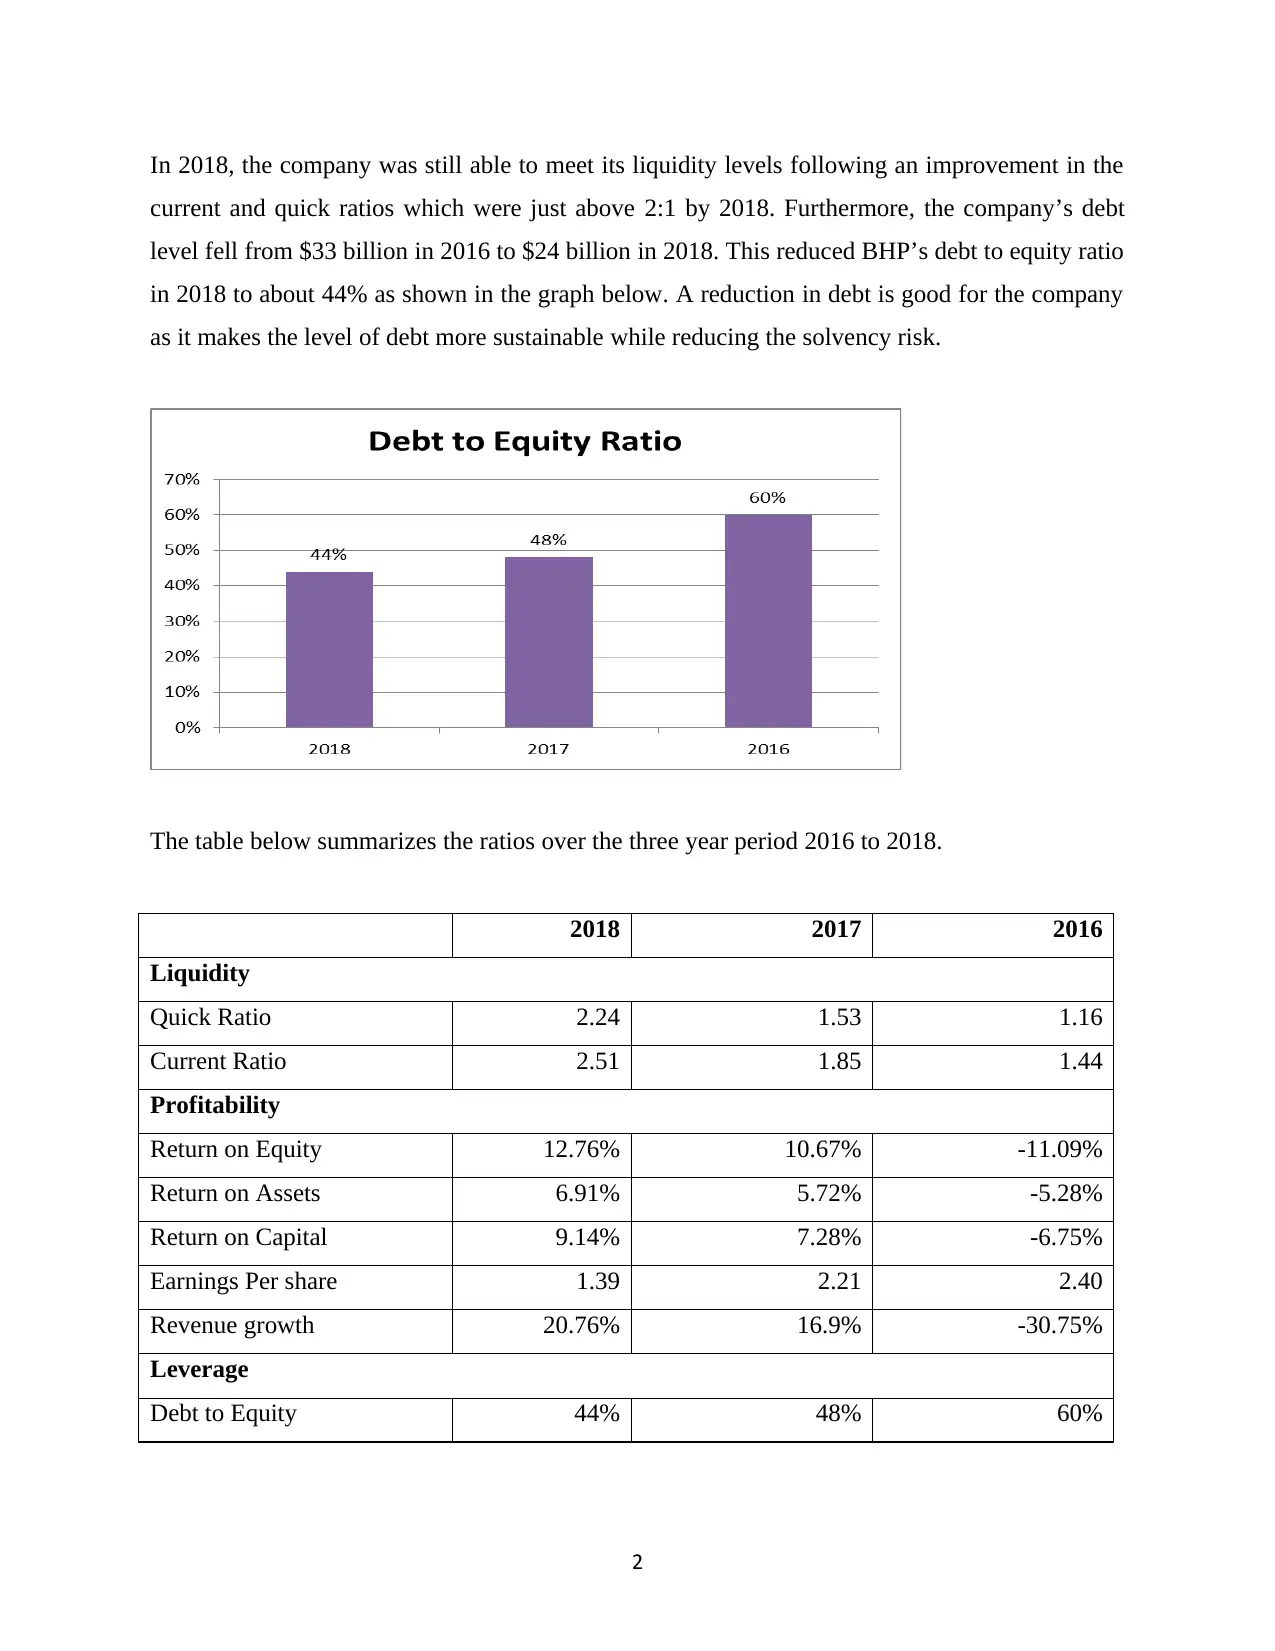
In 2018, the company was still able to meet its liquidity levels following an improvement in the
current and quick ratios which were just above 2:1 by 2018. Furthermore, the company’s debt
level fell from $33 billion in 2016 to $24 billion in 2018. This reduced BHP’s debt to equity ratio
in 2018 to about 44% as shown in the graph below. A reduction in debt is good for the company
as it makes the level of debt more sustainable while reducing the solvency risk.
The table below summarizes the ratios over the three year period 2016 to 2018.
2018 2017 2016
Liquidity
Quick Ratio 2.24 1.53 1.16
Current Ratio 2.51 1.85 1.44
Profitability
Return on Equity 12.76% 10.67% -11.09%
Return on Assets 6.91% 5.72% -5.28%
Return on Capital 9.14% 7.28% -6.75%
Earnings Per share 1.39 2.21 2.40
Revenue growth 20.76% 16.9% -30.75%
Leverage
Debt to Equity 44% 48% 60%
2
Summary
In summary, in the last year BHP showed increased profitability levels. When observing the
2018 ROE, the owner’s capital has been used effectively to generate additional income. A high
ROE is attractive to investors as it suggests that the company can pay dividends in the coming
years.
BHP also showed a strong liquid position as observed by its high current and quick ratios.
Investors assess these ratios to determine if a company will continue as a going concern.
Therefore, a high ratio is a good indicator to investors as such companies are not faced with
bankruptcy, like the case of BHP.
Lastly, over the three years BHP’s debt levels have been decreasing. This is a good indicator to
investors because if the level of debt is too high, investors will be worried that the company may
be faced with a solvency risk.
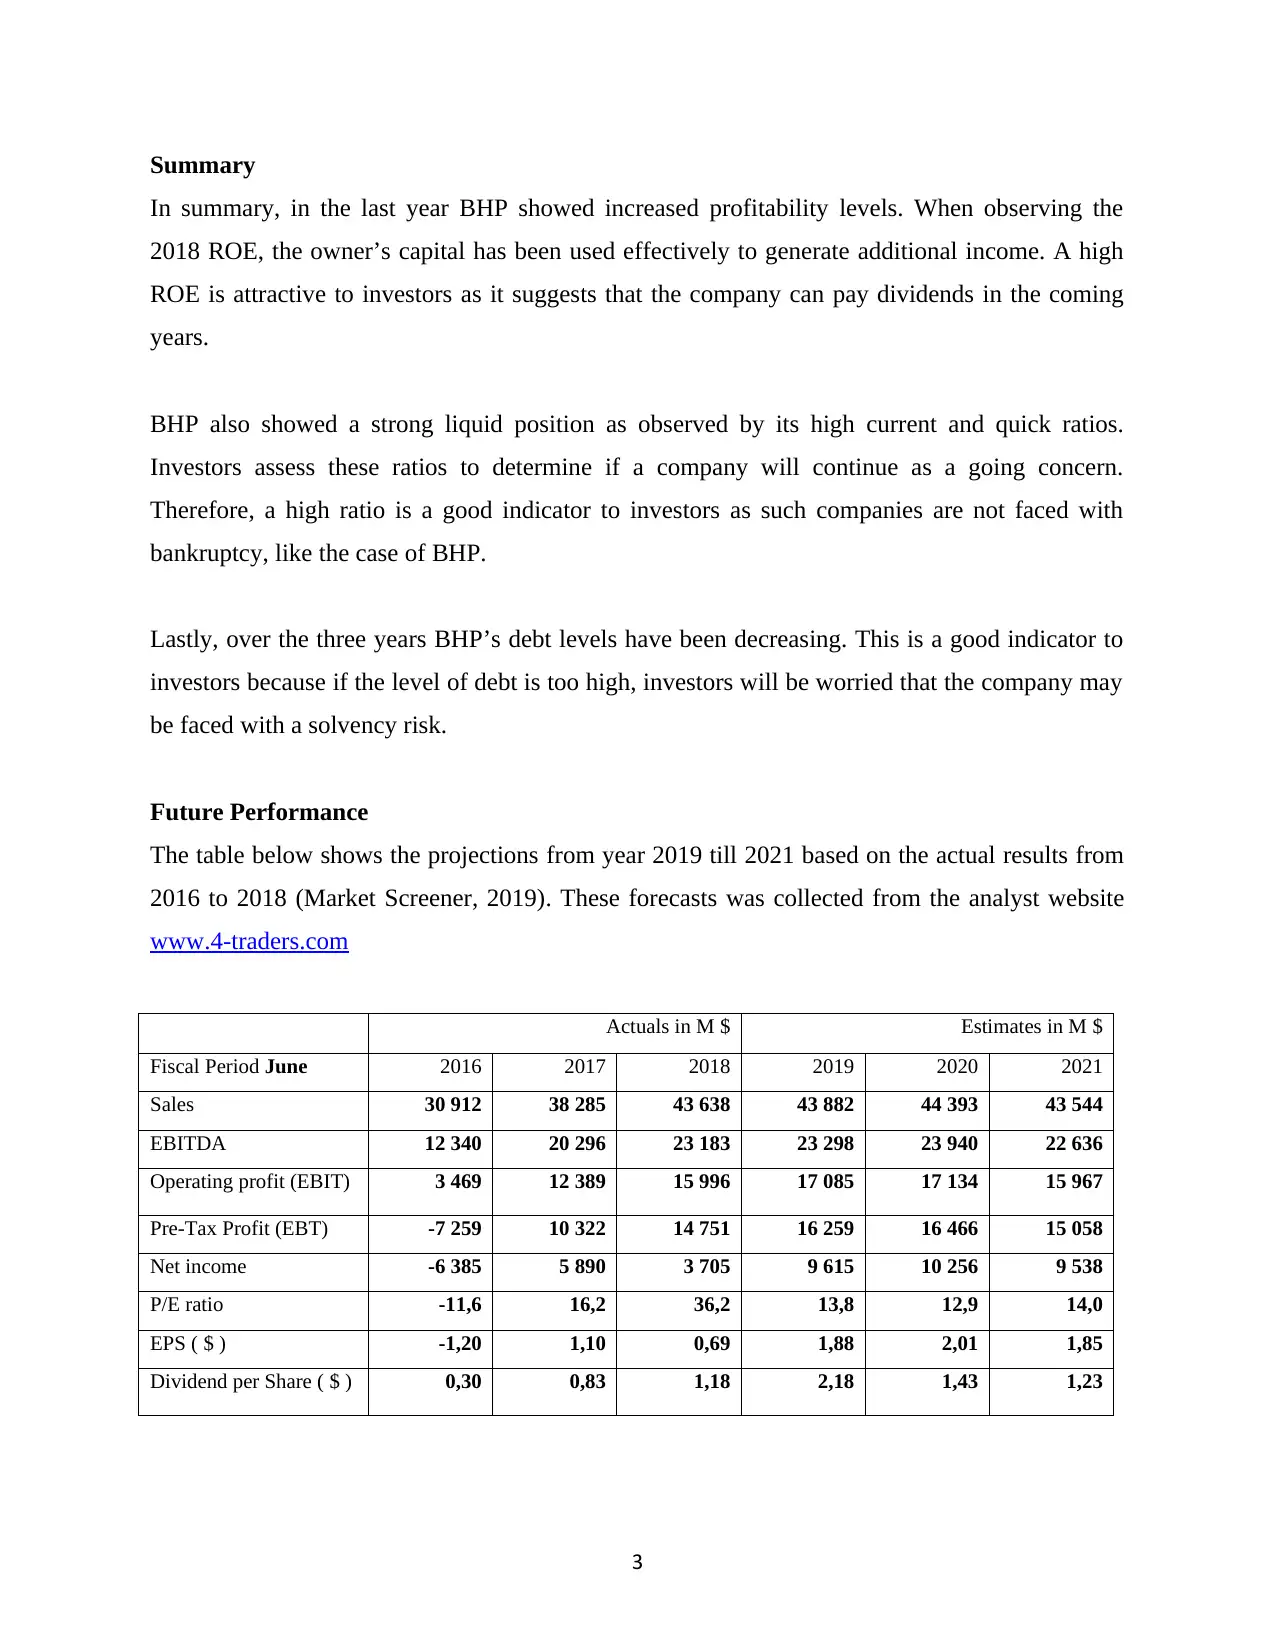
Future Performance
The table below shows the projections from year 2019 till 2021 based on the actual results from
2016 to 2018 (Market Screener, 2019). These forecasts was collected from the analyst website
www.4-traders.com
Actuals in M $ Estimates in M $
Fiscal Period June 2016 2017 2018 2019 2020 2021
Sales 30 912 38 285 43 638 43 882 44 393 43 544
EBITDA 12 340 20 296 23 183 23 298 23 940 22 636
Operating profit (EBIT) 3 469 12 389 15 996 17 085 17 134 15 967
Pre-Tax Profit (EBT) -7 259 10 322 14 751 16 259 16 466 15 058
Net income -6 385 5 890 3 705 9 615 10 256 9 538
P/E ratio -11,6 16,2 36,2 13,8 12,9 14,0
EPS ( $ ) -1,20 1,10 0,69 1,88 2,01 1,85
Dividend per Share ( $ ) 0,30 0,83 1,18 2,18 1,43 1,23
3
In summary, in the last year BHP showed increased profitability levels. When observing the
2018 ROE, the owner’s capital has been used effectively to generate additional income. A high
ROE is attractive to investors as it suggests that the company can pay dividends in the coming
years.
BHP also showed a strong liquid position as observed by its high current and quick ratios.
Investors assess these ratios to determine if a company will continue as a going concern.
Therefore, a high ratio is a good indicator to investors as such companies are not faced with
bankruptcy, like the case of BHP.
Lastly, over the three years BHP’s debt levels have been decreasing. This is a good indicator to
investors because if the level of debt is too high, investors will be worried that the company may
be faced with a solvency risk.
Future Performance
The table below shows the projections from year 2019 till 2021 based on the actual results from
2016 to 2018 (Market Screener, 2019). These forecasts was collected from the analyst website
www.4-traders.com
Actuals in M $ Estimates in M $
Fiscal Period June 2016 2017 2018 2019 2020 2021
Sales 30 912 38 285 43 638 43 882 44 393 43 544
EBITDA 12 340 20 296 23 183 23 298 23 940 22 636
Operating profit (EBIT) 3 469 12 389 15 996 17 085 17 134 15 967
Pre-Tax Profit (EBT) -7 259 10 322 14 751 16 259 16 466 15 058
Net income -6 385 5 890 3 705 9 615 10 256 9 538
P/E ratio -11,6 16,2 36,2 13,8 12,9 14,0
EPS ( $ ) -1,20 1,10 0,69 1,88 2,01 1,85
Dividend per Share ( $ ) 0,30 0,83 1,18 2,18 1,43 1,23
3
According to the analyst, the forecasted sales in 2019 will be 0.56% which will rise to a modest
growth of approximately to 1.16% by FY21. The net income is expected to triple from 2019 to
2021 which in turn should increase dividends by 4% in 2021 (Market Screener, 2019)
Overall, BHP appears to be a stable company. There is potential for future growth for investors
of BHP, however, we expect this additional returns to be very small. This is mainly attributed to
changes in the economic cycles of the mining industry, continuous write downs by BHP and
volatile commodity prices (Goetzmann, 2018).
4
Secure Best Marks with AI Grader
Need help grading? Try our AI Grader for instant feedback on your assignments.
REFERENCES
Goetzmann, W., 2018. An Introduction to Investment Theory, s.l.: YALE School of Management.
Investing Answers, 2017. Return on Capital. [Online]
Available at: http://www.investinganswers.com/financial-dictionary/ratio-analysis/return-capital-3054
Market Screener, 2019. BHP GROUP LTD (BHP). [Online]
Available at: https://www.marketscreener.com/BHP-GROUP-LTD-6492795/financials/
Reuters, 2018. BHP Billiton Ltd (BHP.AX). [Online]
Available at: https://www.reuters.com/finance/stocks/overview/BHP.AX
Ro, S., 2015. Goldman Sachs eplains the 'return on equity' formula that every CFA test taker must know.
[Online]
Available at: http://www.businessinsider.com/cfa-dupont-roe-model-2015-4?r=UK&IR=T
Subramanya, K. & Wild, J., 2009. Financial Statement Analysis. New York: McGraw-Hill Irwin.
Yahoo Finance, 2019. BHP Billiton Limited (BHP.AX). [Online]
Available at: https://au.finance.yahoo.com/quote/BHP.AX/financials?p=BHP.AX
5
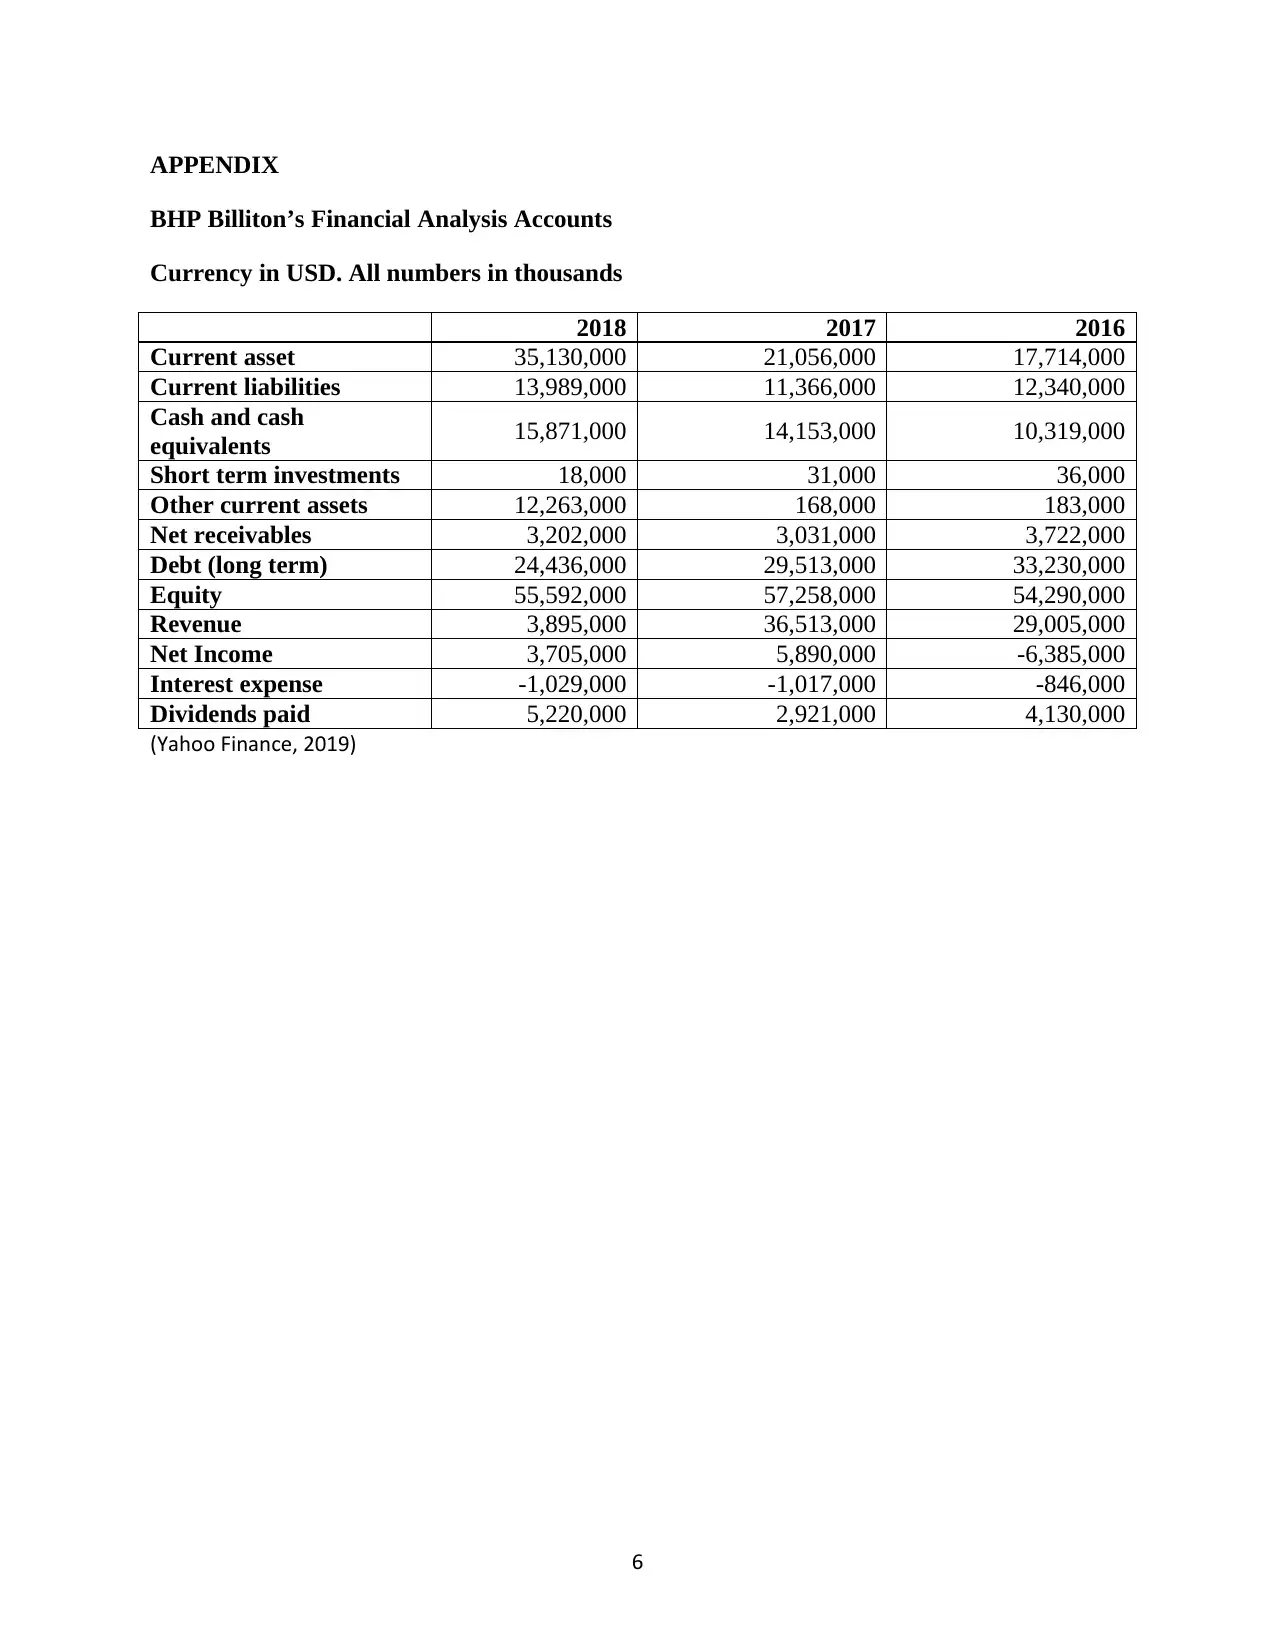
APPENDIX
BHP Billiton’s Financial Analysis Accounts
Currency in USD. All numbers in thousands
2018 2017 2016
Current asset 35,130,000 21,056,000 17,714,000
Current liabilities 13,989,000 11,366,000 12,340,000
Cash and cash
equivalents 15,871,000 14,153,000 10,319,000
Short term investments 18,000 31,000 36,000
Other current assets 12,263,000 168,000 183,000
Net receivables 3,202,000 3,031,000 3,722,000
Debt (long term) 24,436,000 29,513,000 33,230,000
Equity 55,592,000 57,258,000 54,290,000
Revenue 3,895,000 36,513,000 29,005,000
Net Income 3,705,000 5,890,000 -6,385,000
Interest expense -1,029,000 -1,017,000 -846,000
Dividends paid 5,220,000 2,921,000 4,130,000
(Yahoo Finance, 2019)
6
1 out of 6
Related Documents


Your All-in-One AI-Powered Toolkit for Academic Success.
+13062052269
info@desklib.com
Available 24*7 on WhatsApp / Email
![[object Object]](/_next/static/media/star-bottom.7253800d.svg)
Unlock your academic potential
© 2024 | Zucol Services PVT LTD | All rights reserved.