BHP Billiton Financial Analysis
Added on 2021-05-27
6 Pages1291 Words75 Views
FINANCIAL ANALYSIS: BHP BILLITONHistorical PerformanceIn 2016, BHP Billiton reported revenues of $26 billion which was a 31% decline from its 2015revenues of $34b. The reason for the fall in revenue was attributed to the huge drop incommodity prices [ CITATION Reu18 \l 1033 ]. As a result, BHP earnings were wiped out and thecompany reported a loss of $6.5 billion in 2016 leading to a drop in share prices. Its Return onAssets and Return on Equity were negative at -5.28% and -11.09% respectively. A negativeROA and/or ROE suggest that the company was operating inefficiently in 2016[ CITATION Sub09 \l 1033 ].Despite the above, BHP Billiton was still able to cover its short term liabilities using its currentassets. In 2016, it had a current ratio of 1:1.44 and quick ratio of 1:1.16. Hence, BHP was stillconsidered a liquid company amongst its peers. However, in the same year the companyincreased its long term debt levels to $33 billion leading to debt to equity ratio of 60%. A highratio suggests that BHP was an above average leverage company[ CITATION RoS151 \l 1033 ]. Eventhough a high debt to equity ratio is common with large companies, it could also suggest thecompany has a lot of debt in its books which is not sustainable. This could lead to solvencyproblems which could deter investors from the company.Current PerformanceIn 2017 and 2018, BHP was able to recover from its negative outlook from 2016. In 2018, BHPBilliton’s revenues increased by 21% from 2017. Similarly in 2017, revenues increased by 17%increase from 2016 suggesting that the company has been doing well in the current years.Furthermore, BHP reported a profit after tax of $5.9 billion and $3.7 billion in 2017 and 2018respectively. Its Return on Assets and Return on Equity were positive at 6.91% and 12.76%respectively, suggesting that the company was operating efficiently in 2018. Furthermore, apositive ROA value shows the company is making a good return on its assets [ CITATION Inv174 \l1033 ]. Following the good results, BHP Billiton was able to pay dividends amounting to $5.2billion in 2018 in comparison to 2016.1
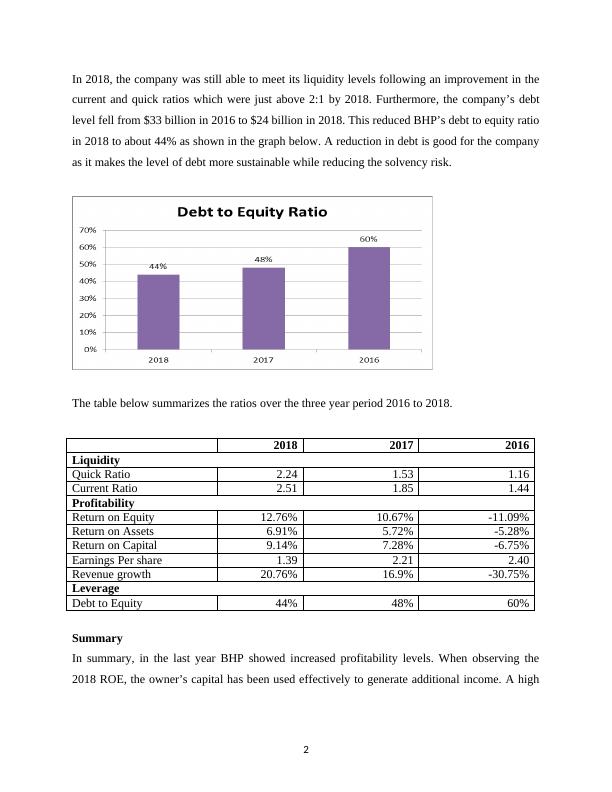
In 2018, the company was still able to meet its liquidity levels following an improvement in thecurrent and quick ratios which were just above 2:1 by 2018. Furthermore, the company’s debtlevel fell from $33 billion in 2016 to $24 billion in 2018. This reduced BHP’s debt to equity ratioin 2018 to about 44% as shown in the graph below. A reduction in debt is good for the companyas it makes the level of debt more sustainable while reducing the solvency risk.The table below summarizes the ratios over the three year period 2016 to 2018.201820172016Liquidity Quick Ratio2.241.531.16Current Ratio2.511.851.44ProfitabilityReturn on Equity12.76%10.67%-11.09%Return on Assets6.91%5.72%-5.28%Return on Capital9.14%7.28%-6.75%Earnings Per share1.392.212.40Revenue growth20.76%16.9%-30.75%Leverage Debt to Equity44%48%60%Summary In summary, in the last year BHP showed increased profitability levels. When observing the2018 ROE, the owner’s capital has been used effectively to generate additional income. A high2
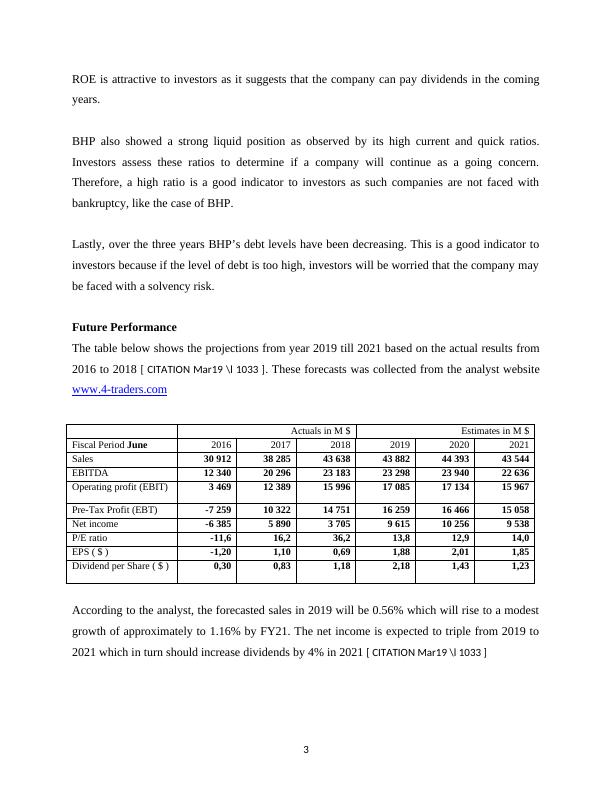
ROE is attractive to investors as it suggests that the company can pay dividends in the comingyears. BHP also showed a strong liquid position as observed by its high current and quick ratios.Investors assess these ratios to determine if a company will continue as a going concern.Therefore, a high ratio is a good indicator to investors as such companies are not faced withbankruptcy, like the case of BHP.Lastly, over the three years BHP’s debt levels have been decreasing. This is a good indicator toinvestors because if the level of debt is too high, investors will be worried that the company maybe faced with a solvency risk. Future PerformanceThe table below shows the projections from year 2019 till 2021 based on the actual results from2016 to 2018 [ CITATION Mar19 \l 1033 ]. These forecasts was collected from the analyst websitewww.4-traders.comActuals in M$Estimates in M$Fiscal Period June201620172018201920202021Sales30 91238 28543 63843 88244 39343 544EBITDA12 34020 29623 18323 29823 94022 636Operating profit (EBIT)3 46912 38915 99617 08517 13415 967Pre-Tax Profit (EBT)-7 25910 32214 75116 25916 46615 058Net income-6 3855 8903 7059 61510 2569 538P/E ratio-11,616,236,213,812,914,0EPS ($ )-1,201,100,691,882,011,85Dividend per Share ($ )0,300,831,182,181,431,23According to the analyst, the forecasted sales in 2019 will be 0.56% which will rise to a modestgrowth of approximately to 1.16% by FY21. The net income is expected to triple from 2019 to2021 which in turn should increase dividends by 4% in 2021 [ CITATION Mar19 \l 1033 ]3
End of preview
Want to access all the pages? Upload your documents or become a member.
Related Documents
Financial and Economic Interpretation and Communicationlg...
|4
|1218
|57
Financial Performance Analysis of BHP Billitonlg...
|3
|1336
|98
Ratio Analysis for Rio Tinto and BHP Billitonlg...
|15
|2562
|144
Finance Insights and Business Intelligence Introductionlg...
|8
|1144
|12
Financial and Economic Interpretation and Communicationlg...
|6
|1662
|320
Financial and Economic Interpretation and Communicationlg...
|6
|1382
|70