Real-Time Bidding Strategy Analysis Report for Business Analytics, UCL
VerifiedAdded on 2023/06/10
|5
|3536
|387
Report
AI Summary
This report analyzes real-time bidding (RTB) strategies within the context of online advertising, focusing on the iPinYou dataset. It explores exploratory data analysis, including the calculation of click-through rate (CTR) and cost per click (CPC), and examines the relationships between CTR and variables such as weekdays, operating systems, and slot visibility. The report utilizes machine learning models like Ridge, Lasso, and neural networks to calculate bidding strategies, with a particular focus on the pay price approach. Furthermore, it addresses the unbalanced problem in CTR estimation and proposes methods to solve it, including the use of logistic regression and the comparison of methods with and without addressing the imbalance. The project aims to help advertisers form a bidding strategy in order to place their ads online in a real-time bidding system. The report highlights the importance of understanding the dataset, applying appropriate statistical and machine learning techniques, and evaluating model performance. The ultimate goal is to improve the accuracy and quality of CTR prediction using AUC values.
Msc Business Analytics
Authors Name/s per 1st Affiliation (Author)
Line 1 (of Affiliation): dept. name of organization
Line 2-name of organization, acronyms acceptable
Line 3-City, Country
Line 4-e-mail address if desired
Authors Name/s per 2nd Affiliation (Author)
Line 1 (of Affiliation): dept. name of organization
Line 2-name of organization, acronyms acceptable
Line 3-City, Country
Line 4-e-mail address if desired
Abstract—the evolution of machine learning capabilities
facilitates the effective bidding process. There are different
models are used for analyzing bidding strategies among them
lasso, neural networks and ridge are widely used models.
From the given data set the calculation was carried out for
identifying the click-through rate and cost per click. The pay
price approach is used in this model. Based on that the number
of clicks analyzed in this model. Finally, the number of clicks
is analyzed for the selection of the best bidding strategy.
Machine learning models are used to calculate the bidding
strategy. The models such as Ridge, Lasso, and neural
networks are analyzed for the bidding strategy. Three different
kinds of data sets are identified. CPC, CTR values are
calculated with the help of the train data set. The pay price
approach is established for this model. Finally, the number of
clicks is analyzed for the selection of the best bidding strategy.
Keywords—Click through rate; Logistic regression;
advertisement
1. Introduction
Advertisements are used to promote any products. There
are different platforms and algorithms are used to generate
CTR. Calculate the CPC values is more useful to advertisers.
CPC stands for Cost per click. CPC rate is calculated based on
number of advertisement clicks. CTR stands for click-through
rate. The value of an advertisement is based on impressions,
views and queries, etc. Once the users clicked the
advertisement which is displayed on the screen, then the click-
through rate is generated for the advertiser. Real-time bidding
is such a kind of platform which is for selling the ad
impression. This report explains about how RTB is working as
server side and also explains how CPC, CTR is calculated.
RTB users are widely creates advertisements to impress the
customers by giving attractive offers. Those advertisement
details is divided into three parts. They are called a test dataset,
train dataset and validation dataset. This report also predicts
and estimate the value using CPC (cost per click), CPM (cost
per impression) and CTR (click through rate).
2. Exploratory data analysis
Exploratory data analysis was done based on train dataset.
Bidding strategy is helped in maximizing the click-through
rate. The number of clicks, impression, pay price, slot
dimensions, hours are present in the training data set. First
load the dataset into the notebook, after that it was cleaned.
Variables are present in the train dataset like user id, bid id,
user agent, region, city, URL id, slot id, slot width, slot height,
slot visible, slot price, bid price. URL id has a null value.
Hence it is replaced with the N/A value in order to reject the
problems (Bui, Hussain and Kim, 2016). The Bid id column
has bid id values. City column has the number of cities. Slot
visible has the number of visible slots. Slot price also
mentioned in the train data set. The IP address of the system is
also mentioned in train dataset. Slot visibility column has a
string and numeric values (Fernandez-Tapia, 2015). CTR, Avg
CPM, CPC were calculated using few variables like the
number of clicks, pay price, bid price. Exploratory data
analysis is done with Jupiter notebook code. This code known
as data analysis. IPYNB. In this code, set the common values
for advertiser and click. Finally, this code used to easily find
out CPC, CTR, CPM, clicks etc...
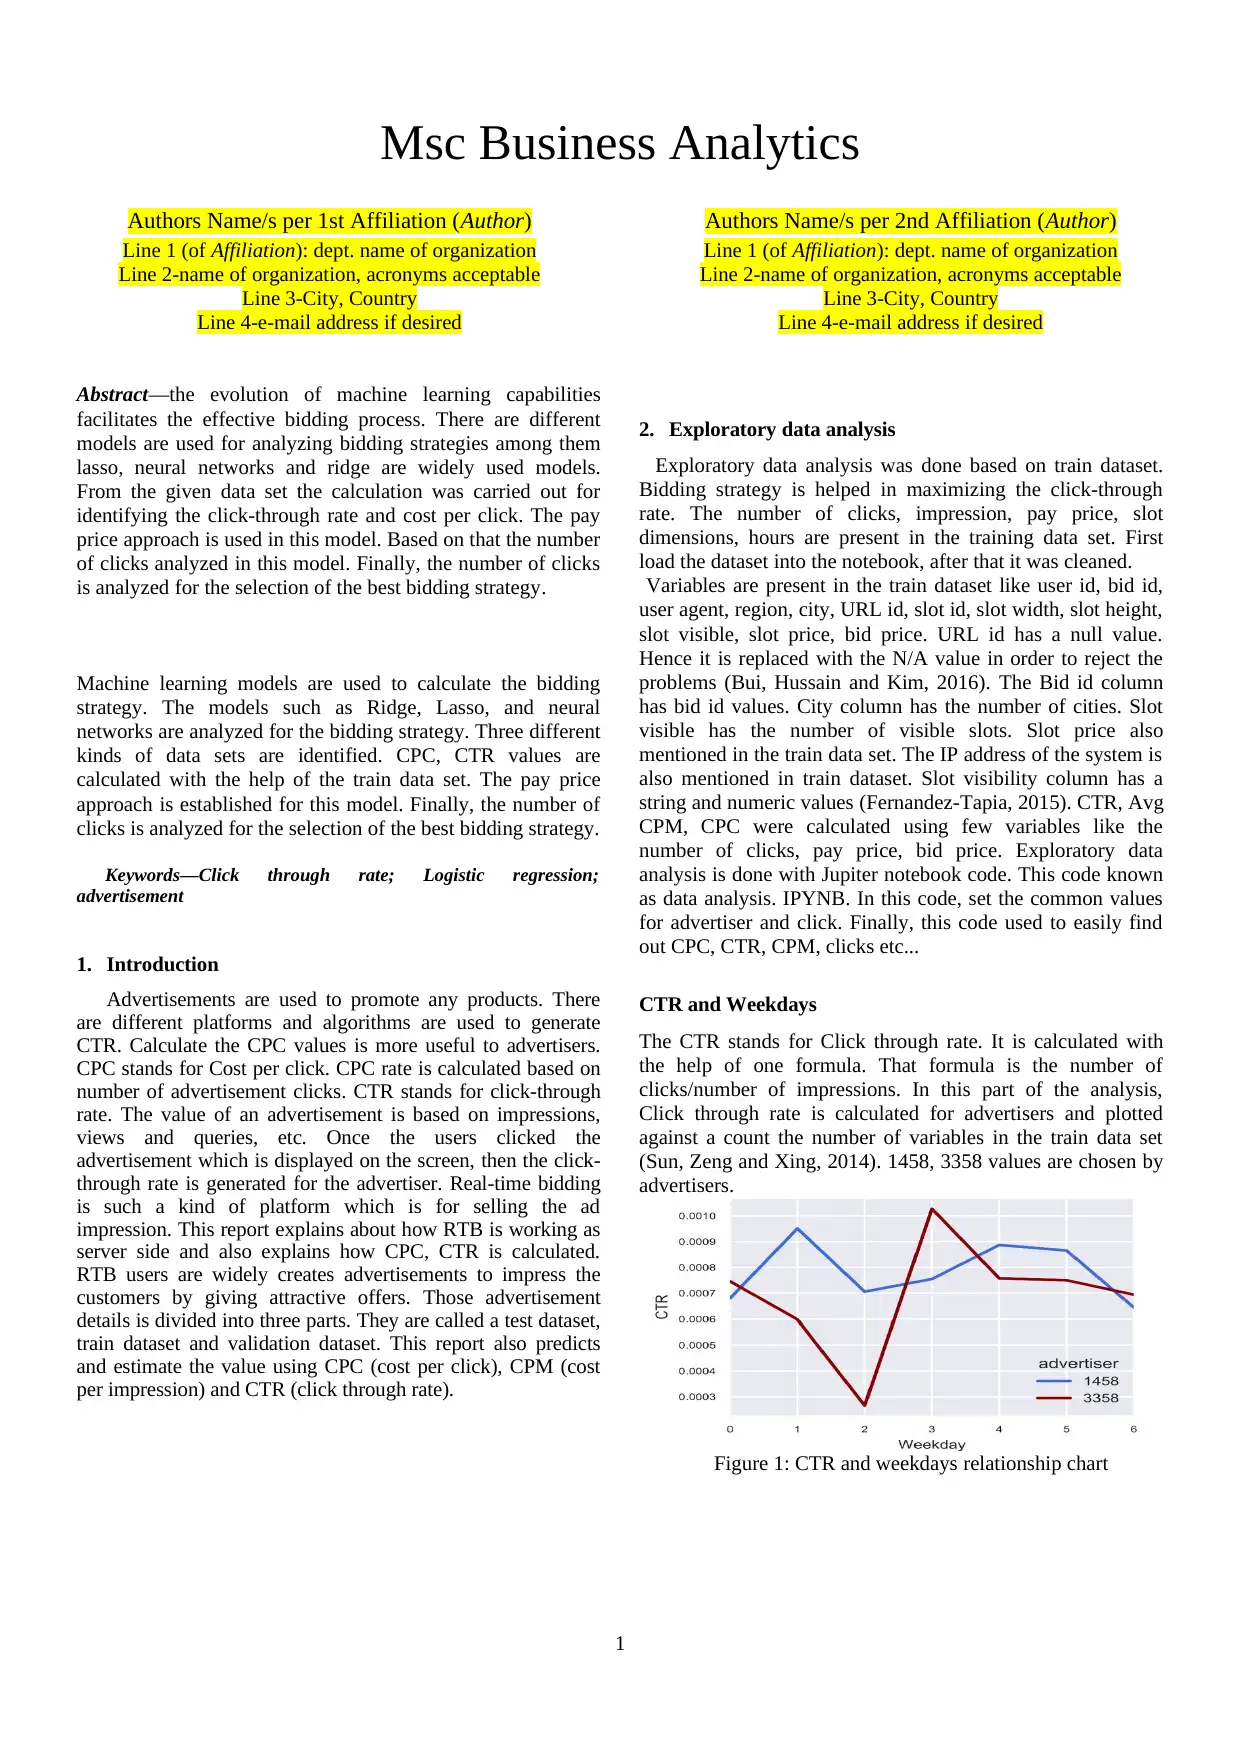
CTR and Weekdays
The CTR stands for Click through rate. It is calculated with
the help of one formula. That formula is the number of
clicks/number of impressions. In this part of the analysis,
Click through rate is calculated for advertisers and plotted
against a count the number of variables in the train data set
(Sun, Zeng and Xing, 2014). 1458, 3358 values are chosen by
advertisers.
Figure 1: CTR and weekdays relationship chart
1
Authors Name/s per 1st Affiliation (Author)
Line 1 (of Affiliation): dept. name of organization
Line 2-name of organization, acronyms acceptable
Line 3-City, Country
Line 4-e-mail address if desired
Authors Name/s per 2nd Affiliation (Author)
Line 1 (of Affiliation): dept. name of organization
Line 2-name of organization, acronyms acceptable
Line 3-City, Country
Line 4-e-mail address if desired
Abstract—the evolution of machine learning capabilities
facilitates the effective bidding process. There are different
models are used for analyzing bidding strategies among them
lasso, neural networks and ridge are widely used models.
From the given data set the calculation was carried out for
identifying the click-through rate and cost per click. The pay
price approach is used in this model. Based on that the number
of clicks analyzed in this model. Finally, the number of clicks
is analyzed for the selection of the best bidding strategy.
Machine learning models are used to calculate the bidding
strategy. The models such as Ridge, Lasso, and neural
networks are analyzed for the bidding strategy. Three different
kinds of data sets are identified. CPC, CTR values are
calculated with the help of the train data set. The pay price
approach is established for this model. Finally, the number of
clicks is analyzed for the selection of the best bidding strategy.
Keywords—Click through rate; Logistic regression;
advertisement
1. Introduction
Advertisements are used to promote any products. There
are different platforms and algorithms are used to generate
CTR. Calculate the CPC values is more useful to advertisers.
CPC stands for Cost per click. CPC rate is calculated based on
number of advertisement clicks. CTR stands for click-through
rate. The value of an advertisement is based on impressions,
views and queries, etc. Once the users clicked the
advertisement which is displayed on the screen, then the click-
through rate is generated for the advertiser. Real-time bidding
is such a kind of platform which is for selling the ad
impression. This report explains about how RTB is working as
server side and also explains how CPC, CTR is calculated.
RTB users are widely creates advertisements to impress the
customers by giving attractive offers. Those advertisement
details is divided into three parts. They are called a test dataset,
train dataset and validation dataset. This report also predicts
and estimate the value using CPC (cost per click), CPM (cost
per impression) and CTR (click through rate).
2. Exploratory data analysis
Exploratory data analysis was done based on train dataset.
Bidding strategy is helped in maximizing the click-through
rate. The number of clicks, impression, pay price, slot
dimensions, hours are present in the training data set. First
load the dataset into the notebook, after that it was cleaned.
Variables are present in the train dataset like user id, bid id,
user agent, region, city, URL id, slot id, slot width, slot height,
slot visible, slot price, bid price. URL id has a null value.
Hence it is replaced with the N/A value in order to reject the
problems (Bui, Hussain and Kim, 2016). The Bid id column
has bid id values. City column has the number of cities. Slot
visible has the number of visible slots. Slot price also
mentioned in the train data set. The IP address of the system is
also mentioned in train dataset. Slot visibility column has a
string and numeric values (Fernandez-Tapia, 2015). CTR, Avg
CPM, CPC were calculated using few variables like the
number of clicks, pay price, bid price. Exploratory data
analysis is done with Jupiter notebook code. This code known
as data analysis. IPYNB. In this code, set the common values
for advertiser and click. Finally, this code used to easily find
out CPC, CTR, CPM, clicks etc...
CTR and Weekdays
The CTR stands for Click through rate. It is calculated with
the help of one formula. That formula is the number of
clicks/number of impressions. In this part of the analysis,
Click through rate is calculated for advertisers and plotted
against a count the number of variables in the train data set
(Sun, Zeng and Xing, 2014). 1458, 3358 values are chosen by
advertisers.
Figure 1: CTR and weekdays relationship chart
1
Paraphrase This Document
Need a fresh take? Get an instant paraphrase of this document with our AI Paraphraser
The Figure above shows the Click through rate for
weekdays calculated for the advertisers 1458 and 3476. That is
represented in blue and brown color. Y-axis have the value of
the click-through rate. X-axis contains weekdays. CTR value
is 0.0012 is the highest value of the third day of the weekdays.
The lowest value in click-through rate is 0.0002.
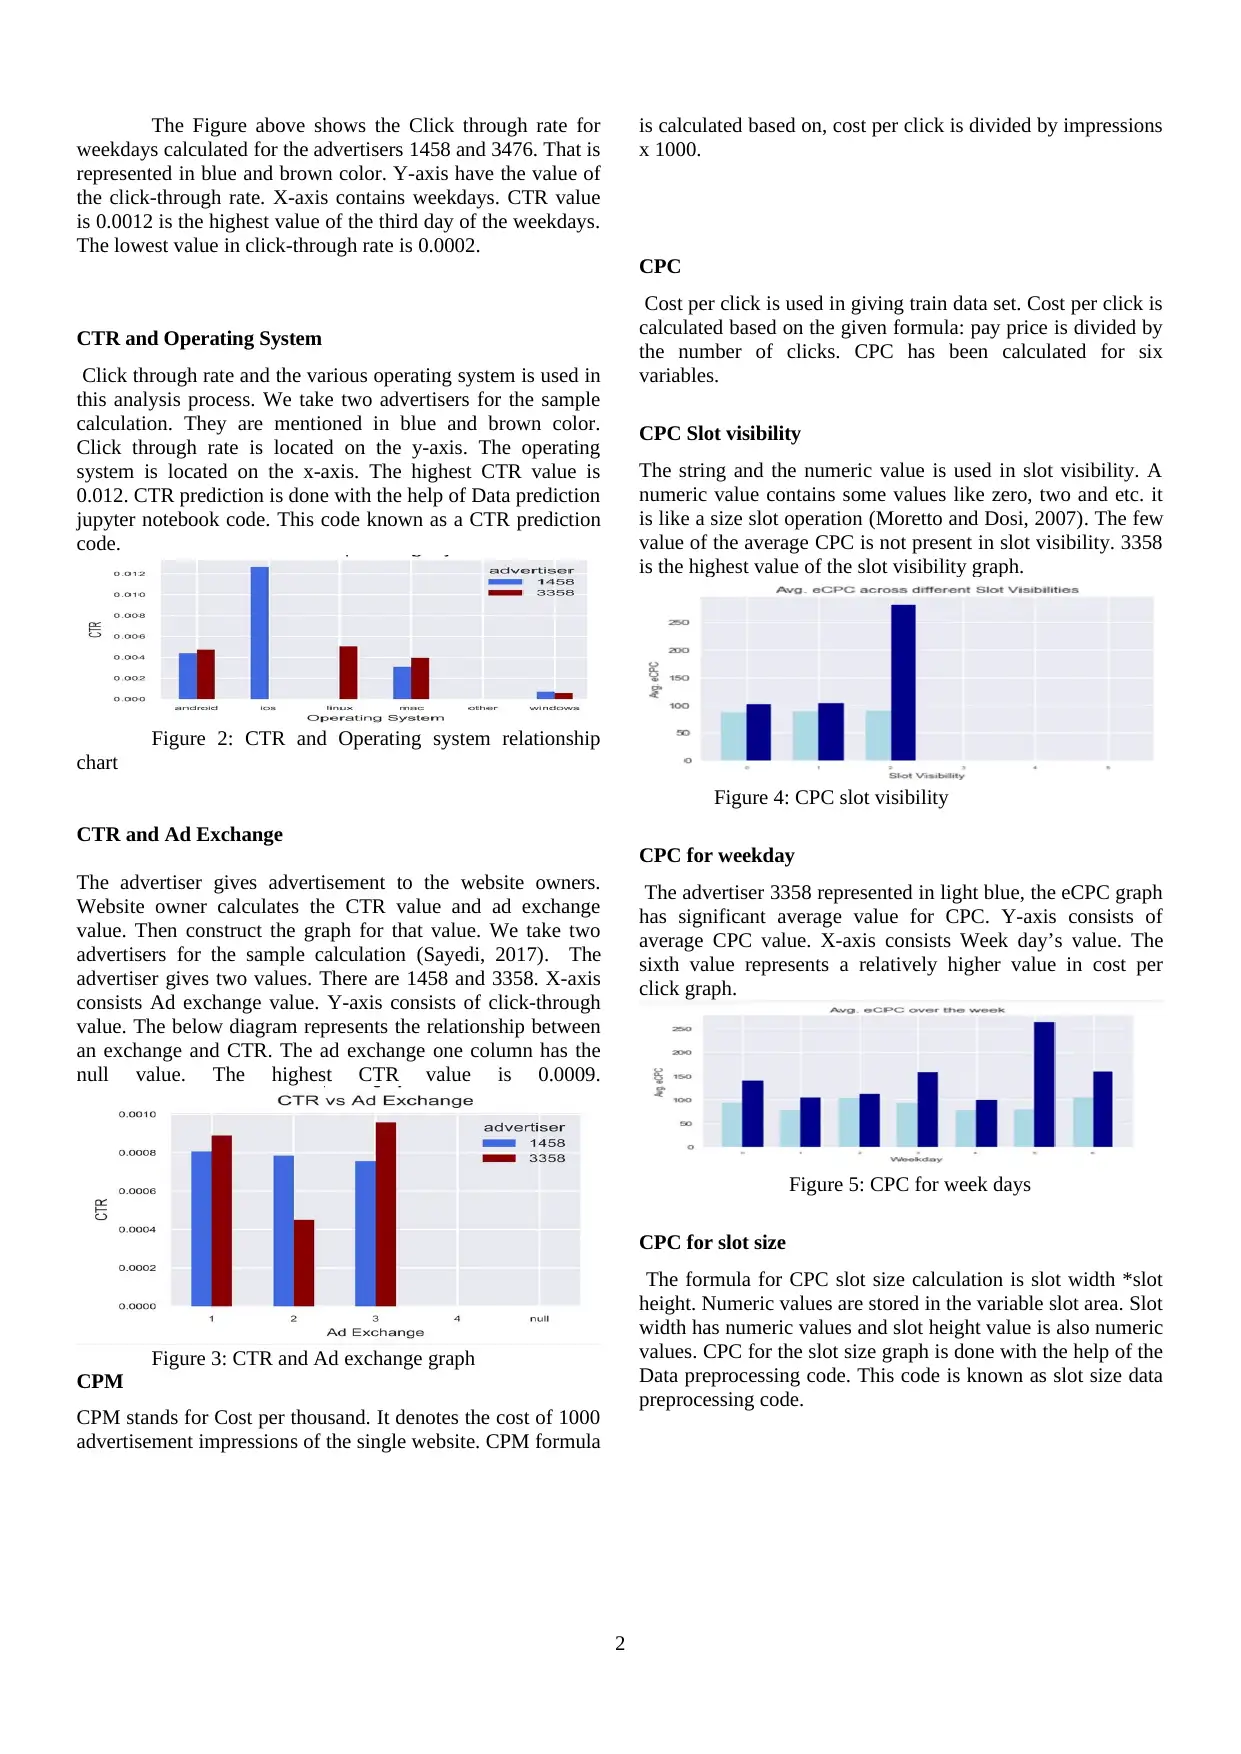
CTR and Operating System
Click through rate and the various operating system is used in
this analysis process. We take two advertisers for the sample
calculation. They are mentioned in blue and brown color.
Click through rate is located on the y-axis. The operating
system is located on the x-axis. The highest CTR value is
0.012. CTR prediction is done with the help of Data prediction
jupyter notebook code. This code known as a CTR prediction
code.
Figure 2: CTR and Operating system relationship
chart
CTR and Ad Exchange
The advertiser gives advertisement to the website owners.
Website owner calculates the CTR value and ad exchange
value. Then construct the graph for that value. We take two
advertisers for the sample calculation (Sayedi, 2017). The
advertiser gives two values. There are 1458 and 3358. X-axis
consists Ad exchange value. Y-axis consists of click-through
value. The below diagram represents the relationship between
an exchange and CTR. The ad exchange one column has the
null value. The highest CTR value is 0.0009.
Figure 3: CTR and Ad exchange graph
CPM
CPM stands for Cost per thousand. It denotes the cost of 1000
advertisement impressions of the single website. CPM formula
is calculated based on, cost per click is divided by impressions
x 1000.
CPC
Cost per click is used in giving train data set. Cost per click is
calculated based on the given formula: pay price is divided by
the number of clicks. CPC has been calculated for six
variables.
CPC Slot visibility
The string and the numeric value is used in slot visibility. A
numeric value contains some values like zero, two and etc. it
is like a size slot operation (Moretto and Dosi, 2007). The few
value of the average CPC is not present in slot visibility. 3358
is the highest value of the slot visibility graph.
Figure 4: CPC slot visibility
CPC for weekday
The advertiser 3358 represented in light blue, the eCPC graph
has significant average value for CPC. Y-axis consists of
average CPC value. X-axis consists Week day’s value. The
sixth value represents a relatively higher value in cost per
click graph.
Figure 5: CPC for week days
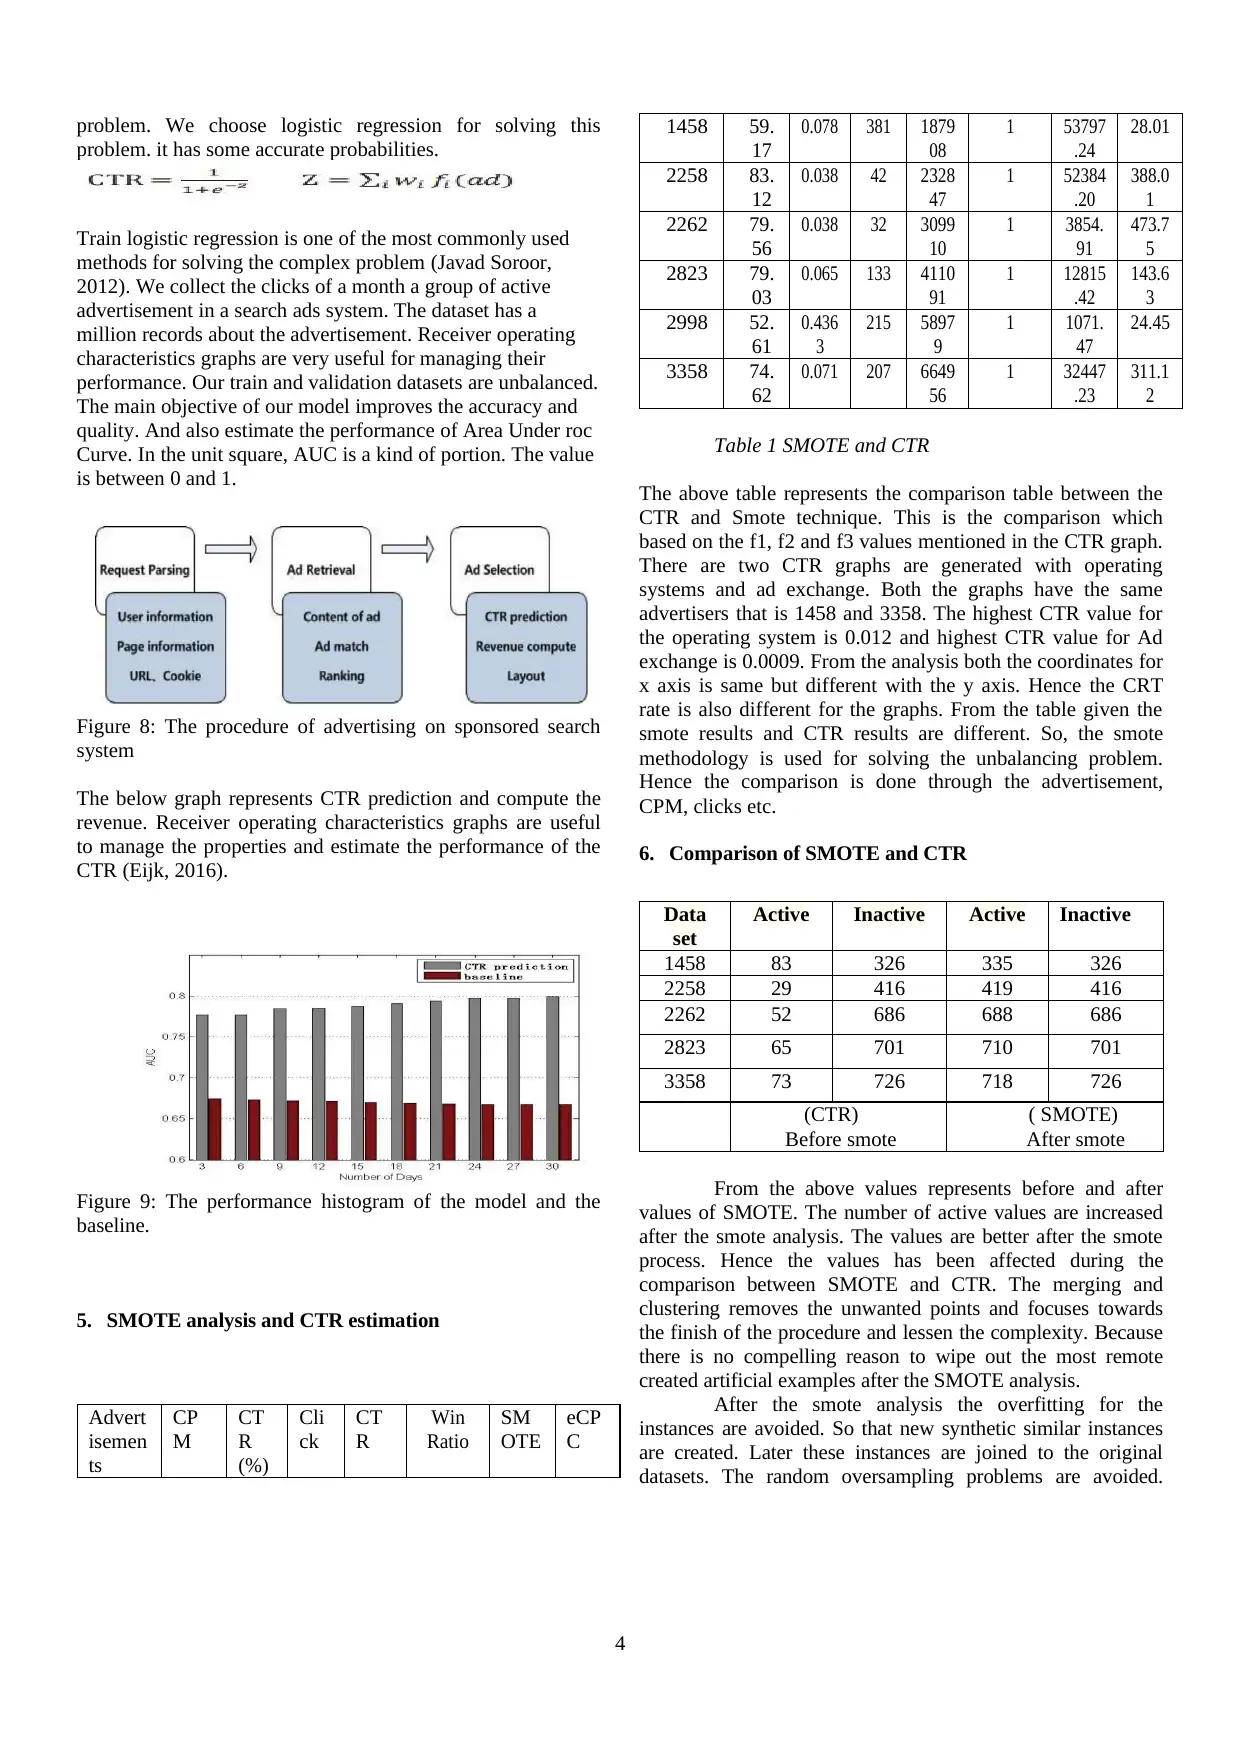
CPC for slot size
The formula for CPC slot size calculation is slot width *slot
height. Numeric values are stored in the variable slot area. Slot
width has numeric values and slot height value is also numeric
values. CPC for the slot size graph is done with the help of the
Data preprocessing code. This code is known as slot size data
preprocessing code.
2
weekdays calculated for the advertisers 1458 and 3476. That is
represented in blue and brown color. Y-axis have the value of
the click-through rate. X-axis contains weekdays. CTR value
is 0.0012 is the highest value of the third day of the weekdays.
The lowest value in click-through rate is 0.0002.
CTR and Operating System
Click through rate and the various operating system is used in
this analysis process. We take two advertisers for the sample
calculation. They are mentioned in blue and brown color.
Click through rate is located on the y-axis. The operating
system is located on the x-axis. The highest CTR value is
0.012. CTR prediction is done with the help of Data prediction
jupyter notebook code. This code known as a CTR prediction
code.
Figure 2: CTR and Operating system relationship
chart
CTR and Ad Exchange
The advertiser gives advertisement to the website owners.
Website owner calculates the CTR value and ad exchange
value. Then construct the graph for that value. We take two
advertisers for the sample calculation (Sayedi, 2017). The
advertiser gives two values. There are 1458 and 3358. X-axis
consists Ad exchange value. Y-axis consists of click-through
value. The below diagram represents the relationship between
an exchange and CTR. The ad exchange one column has the
null value. The highest CTR value is 0.0009.
Figure 3: CTR and Ad exchange graph
CPM
CPM stands for Cost per thousand. It denotes the cost of 1000
advertisement impressions of the single website. CPM formula
is calculated based on, cost per click is divided by impressions
x 1000.
CPC
Cost per click is used in giving train data set. Cost per click is
calculated based on the given formula: pay price is divided by
the number of clicks. CPC has been calculated for six
variables.
CPC Slot visibility
The string and the numeric value is used in slot visibility. A
numeric value contains some values like zero, two and etc. it
is like a size slot operation (Moretto and Dosi, 2007). The few
value of the average CPC is not present in slot visibility. 3358
is the highest value of the slot visibility graph.
Figure 4: CPC slot visibility
CPC for weekday
The advertiser 3358 represented in light blue, the eCPC graph
has significant average value for CPC. Y-axis consists of
average CPC value. X-axis consists Week day’s value. The
sixth value represents a relatively higher value in cost per
click graph.
Figure 5: CPC for week days
CPC for slot size
The formula for CPC slot size calculation is slot width *slot
height. Numeric values are stored in the variable slot area. Slot
width has numeric values and slot height value is also numeric
values. CPC for the slot size graph is done with the help of the
Data preprocessing code. This code is known as slot size data
preprocessing code.
2
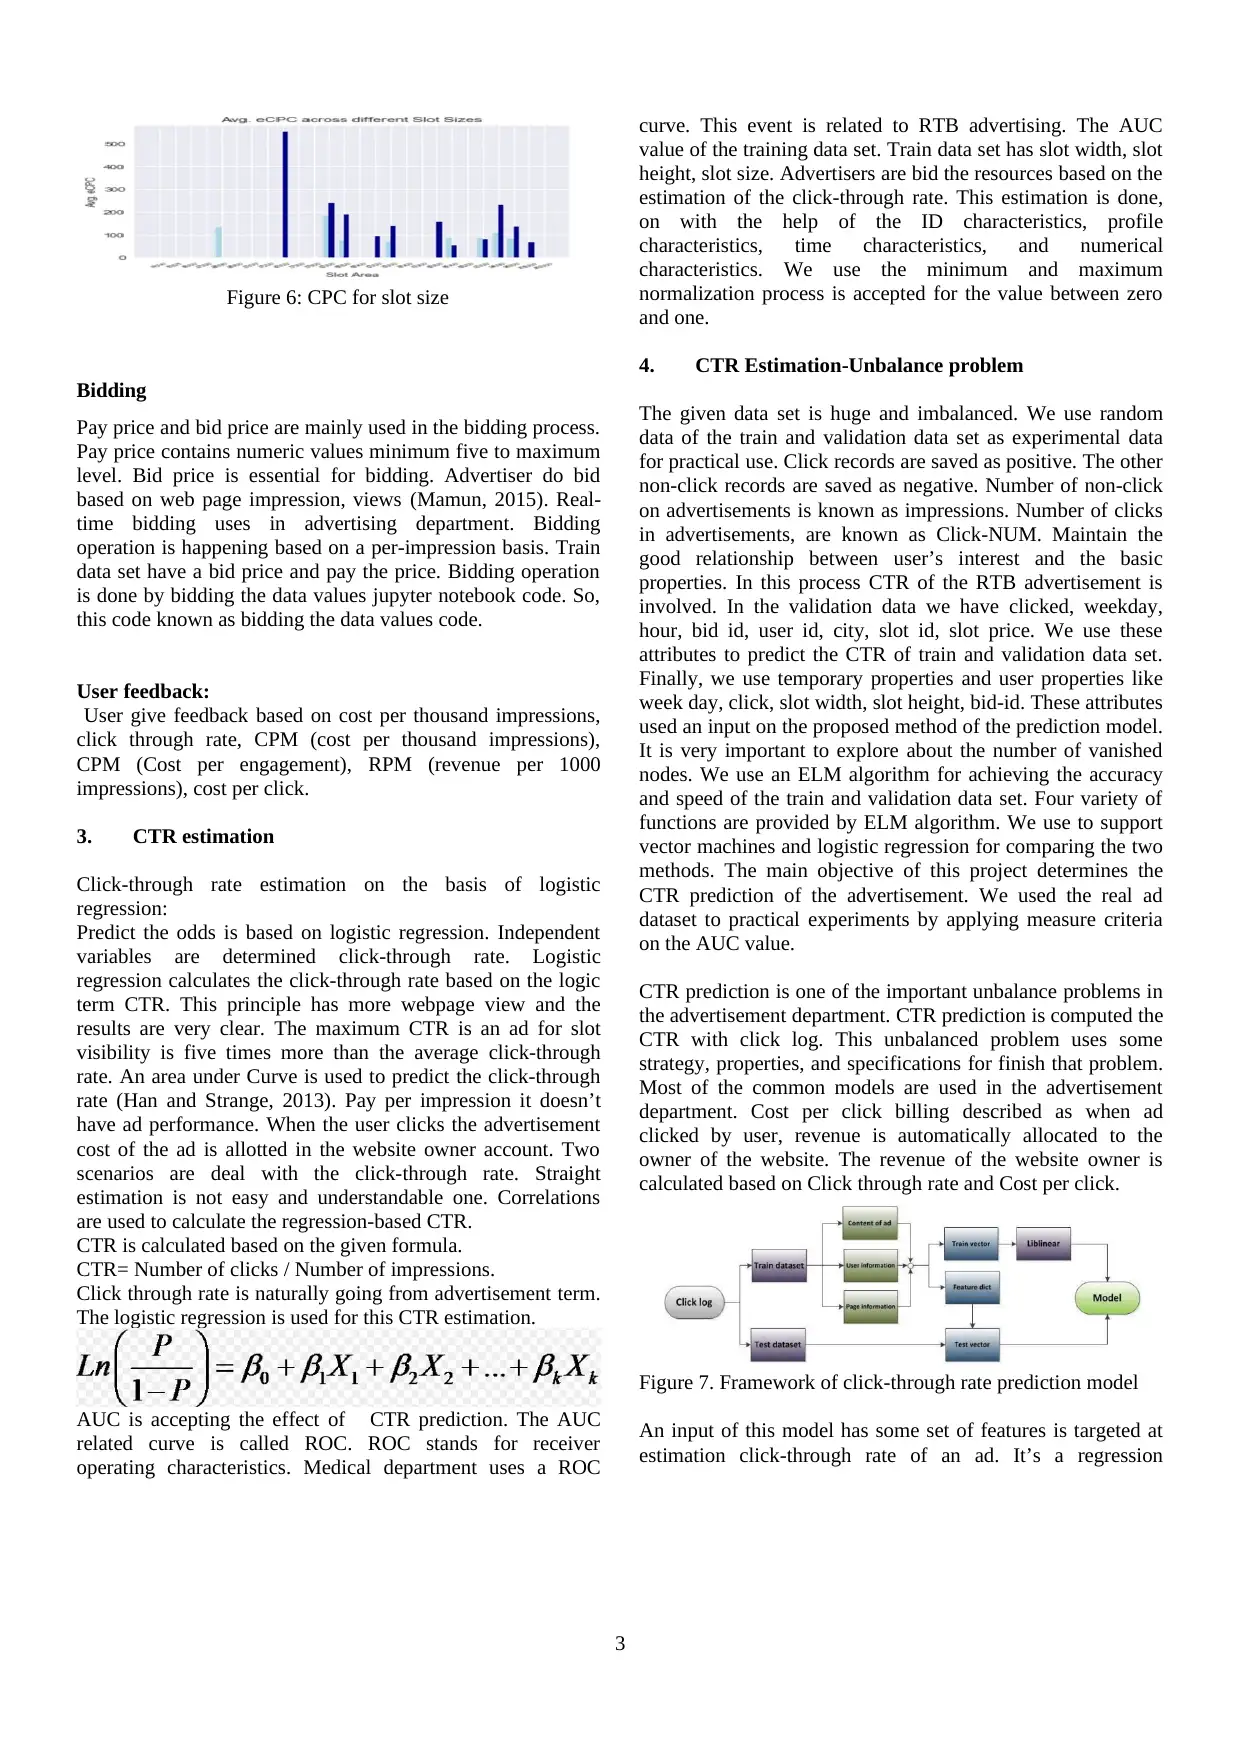
Figure 6: CPC for slot size
Bidding
Pay price and bid price are mainly used in the bidding process.
Pay price contains numeric values minimum five to maximum
level. Bid price is essential for bidding. Advertiser do bid
based on web page impression, views (Mamun, 2015). Real-
time bidding uses in advertising department. Bidding
operation is happening based on a per-impression basis. Train
data set have a bid price and pay the price. Bidding operation
is done by bidding the data values jupyter notebook code. So,
this code known as bidding the data values code.
User feedback:
User give feedback based on cost per thousand impressions,
click through rate, CPM (cost per thousand impressions),
CPM (Cost per engagement), RPM (revenue per 1000
impressions), cost per click.
3. CTR estimation
Click-through rate estimation on the basis of logistic
regression:
Predict the odds is based on logistic regression. Independent
variables are determined click-through rate. Logistic
regression calculates the click-through rate based on the logic
term CTR. This principle has more webpage view and the
results are very clear. The maximum CTR is an ad for slot
visibility is five times more than the average click-through
rate. An area under Curve is used to predict the click-through
rate (Han and Strange, 2013). Pay per impression it doesn’t
have ad performance. When the user clicks the advertisement
cost of the ad is allotted in the website owner account. Two
scenarios are deal with the click-through rate. Straight
estimation is not easy and understandable one. Correlations
are used to calculate the regression-based CTR.
CTR is calculated based on the given formula.
CTR= Number of clicks / Number of impressions.
Click through rate is naturally going from advertisement term.
The logistic regression is used for this CTR estimation.
AUC is accepting the effect of CTR prediction. The AUC
related curve is called ROC. ROC stands for receiver
operating characteristics. Medical department uses a ROC
curve. This event is related to RTB advertising. The AUC
value of the training data set. Train data set has slot width, slot
height, slot size. Advertisers are bid the resources based on the
estimation of the click-through rate. This estimation is done,
on with the help of the ID characteristics, profile
characteristics, time characteristics, and numerical
characteristics. We use the minimum and maximum
normalization process is accepted for the value between zero
and one.
4. CTR Estimation-Unbalance problem
The given data set is huge and imbalanced. We use random
data of the train and validation data set as experimental data
for practical use. Click records are saved as positive. The other
non-click records are saved as negative. Number of non-click
on advertisements is known as impressions. Number of clicks
in advertisements, are known as Click-NUM. Maintain the
good relationship between user’s interest and the basic
properties. In this process CTR of the RTB advertisement is
involved. In the validation data we have clicked, weekday,
hour, bid id, user id, city, slot id, slot price. We use these
attributes to predict the CTR of train and validation data set.
Finally, we use temporary properties and user properties like
week day, click, slot width, slot height, bid-id. These attributes
used an input on the proposed method of the prediction model.
It is very important to explore about the number of vanished
nodes. We use an ELM algorithm for achieving the accuracy
and speed of the train and validation data set. Four variety of
functions are provided by ELM algorithm. We use to support
vector machines and logistic regression for comparing the two
methods. The main objective of this project determines the
CTR prediction of the advertisement. We used the real ad
dataset to practical experiments by applying measure criteria
on the AUC value.
CTR prediction is one of the important unbalance problems in
the advertisement department. CTR prediction is computed the
CTR with click log. This unbalanced problem uses some
strategy, properties, and specifications for finish that problem.
Most of the common models are used in the advertisement
department. Cost per click billing described as when ad
clicked by user, revenue is automatically allocated to the
owner of the website. The revenue of the website owner is
calculated based on Click through rate and Cost per click.
Figure 7. Framework of click-through rate prediction model
An input of this model has some set of features is targeted at
estimation click-through rate of an ad. It’s a regression
3
⊘ This is a preview!⊘
Do you want full access?
Subscribe today to unlock all pages.
Trusted by 1+ million students worldwide
problem. We choose logistic regression for solving this
problem. it has some accurate probabilities.
Train logistic regression is one of the most commonly used
methods for solving the complex problem (Javad Soroor,
2012). We collect the clicks of a month a group of active
advertisement in a search ads system. The dataset has a
million records about the advertisement. Receiver operating
characteristics graphs are very useful for managing their
performance. Our train and validation datasets are unbalanced.
The main objective of our model improves the accuracy and
quality. And also estimate the performance of Area Under roc
Curve. In the unit square, AUC is a kind of portion. The value
is between 0 and 1.
Figure 8: The procedure of advertising on sponsored search
system
The below graph represents CTR prediction and compute the
revenue. Receiver operating characteristics graphs are useful
to manage the properties and estimate the performance of the
CTR (Eijk, 2016).
Figure 9: The performance histogram of the model and the
baseline.
5. SMOTE analysis and CTR estimation
Advert
isemen
ts
CP
M
CT
R
(%)
Cli
ck
CT
R
Win
Ratio
SM
OTE
eCP
C
1458 59.
17
0.078 381 1879
08
1 53797
.24
28.01
2258 83.
12
0.038 42 2328
47
1 52384
.20
388.0
1
2262 79.
56
0.038 32 3099
10
1 3854.
91
473.7
5
2823 79.
03
0.065 133 4110
91
1 12815
.42
143.6
3
2998 52.
61
0.436
3
215 5897
9
1 1071.
47
24.45
3358 74.
62
0.071 207 6649
56
1 32447
.23
311.1
2
Table 1 SMOTE and CTR
The above table represents the comparison table between the
CTR and Smote technique. This is the comparison which
based on the f1, f2 and f3 values mentioned in the CTR graph.
There are two CTR graphs are generated with operating
systems and ad exchange. Both the graphs have the same
advertisers that is 1458 and 3358. The highest CTR value for
the operating system is 0.012 and highest CTR value for Ad
exchange is 0.0009. From the analysis both the coordinates for
x axis is same but different with the y axis. Hence the CRT
rate is also different for the graphs. From the table given the
smote results and CTR results are different. So, the smote
methodology is used for solving the unbalancing problem.
Hence the comparison is done through the advertisement,
CPM, clicks etc.
6. Comparison of SMOTE and CTR
Data
set
Active Inactive Active Inactive
1458 83 326 335 326
2258 29 416 419 416
2262 52 686 688 686
2823 65 701 710 701
3358 73 726 718 726
(CTR)
Before smote
( SMOTE)
After smote
From the above values represents before and after
values of SMOTE. The number of active values are increased
after the smote analysis. The values are better after the smote
process. Hence the values has been affected during the
comparison between SMOTE and CTR. The merging and
clustering removes the unwanted points and focuses towards
the finish of the procedure and lessen the complexity. Because
there is no compelling reason to wipe out the most remote
created artificial examples after the SMOTE analysis.
After the smote analysis the overfitting for the
instances are avoided. So that new synthetic similar instances
are created. Later these instances are joined to the original
datasets. The random oversampling problems are avoided.
4
Paraphrase This Document
Need a fresh take? Get an instant paraphrase of this document with our AI Paraphraser
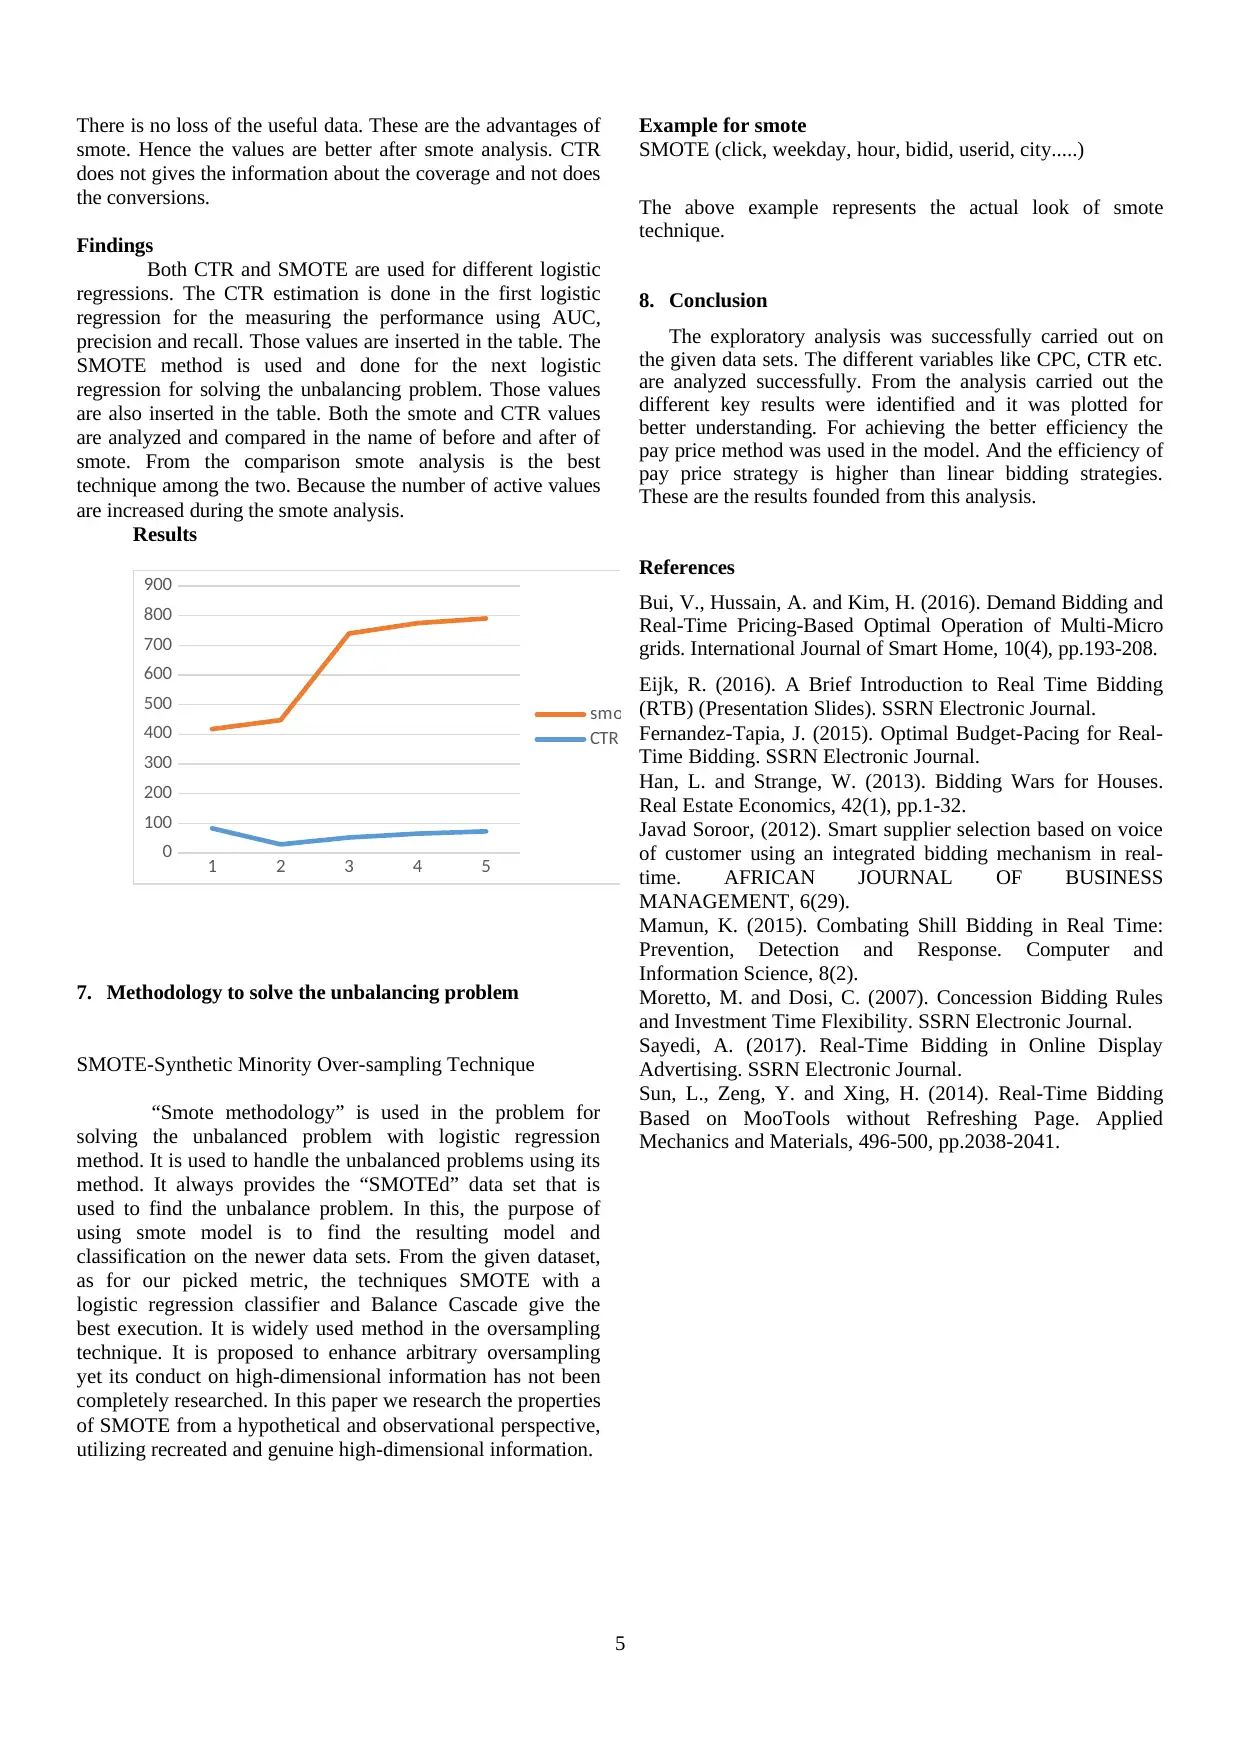
There is no loss of the useful data. These are the advantages of
smote. Hence the values are better after smote analysis. CTR
does not gives the information about the coverage and not does
the conversions.
Findings
Both CTR and SMOTE are used for different logistic
regressions. The CTR estimation is done in the first logistic
regression for the measuring the performance using AUC,
precision and recall. Those values are inserted in the table. The
SMOTE method is used and done for the next logistic
regression for solving the unbalancing problem. Those values
are also inserted in the table. Both the smote and CTR values
are analyzed and compared in the name of before and after of
smote. From the comparison smote analysis is the best
technique among the two. Because the number of active values
are increased during the smote analysis.
Results
1 2 3 4 5
0
100
200
300
400
500
600
700
800
900
smote
CTR
7. Methodology to solve the unbalancing problem
SMOTE-Synthetic Minority Over-sampling Technique
“Smote methodology” is used in the problem for
solving the unbalanced problem with logistic regression
method. It is used to handle the unbalanced problems using its
method. It always provides the “SMOTEd” data set that is
used to find the unbalance problem. In this, the purpose of
using smote model is to find the resulting model and
classification on the newer data sets. From the given dataset,
as for our picked metric, the techniques SMOTE with a
logistic regression classifier and Balance Cascade give the
best execution. It is widely used method in the oversampling
technique. It is proposed to enhance arbitrary oversampling
yet its conduct on high-dimensional information has not been
completely researched. In this paper we research the properties
of SMOTE from a hypothetical and observational perspective,
utilizing recreated and genuine high-dimensional information.
Example for smote
SMOTE (click, weekday, hour, bidid, userid, city.....)
The above example represents the actual look of smote
technique.
8. Conclusion
The exploratory analysis was successfully carried out on
the given data sets. The different variables like CPC, CTR etc.
are analyzed successfully. From the analysis carried out the
different key results were identified and it was plotted for
better understanding. For achieving the better efficiency the
pay price method was used in the model. And the efficiency of
pay price strategy is higher than linear bidding strategies.
These are the results founded from this analysis.
References
Bui, V., Hussain, A. and Kim, H. (2016). Demand Bidding and
Real-Time Pricing-Based Optimal Operation of Multi-Micro
grids. International Journal of Smart Home, 10(4), pp.193-208.
Eijk, R. (2016). A Brief Introduction to Real Time Bidding
(RTB) (Presentation Slides). SSRN Electronic Journal.
Fernandez-Tapia, J. (2015). Optimal Budget-Pacing for Real-
Time Bidding. SSRN Electronic Journal.
Han, L. and Strange, W. (2013). Bidding Wars for Houses.
Real Estate Economics, 42(1), pp.1-32.
Javad Soroor, (2012). Smart supplier selection based on voice
of customer using an integrated bidding mechanism in real-
time. AFRICAN JOURNAL OF BUSINESS
MANAGEMENT, 6(29).
Mamun, K. (2015). Combating Shill Bidding in Real Time:
Prevention, Detection and Response. Computer and
Information Science, 8(2).
Moretto, M. and Dosi, C. (2007). Concession Bidding Rules
and Investment Time Flexibility. SSRN Electronic Journal.
Sayedi, A. (2017). Real-Time Bidding in Online Display
Advertising. SSRN Electronic Journal.
Sun, L., Zeng, Y. and Xing, H. (2014). Real-Time Bidding
Based on MooTools without Refreshing Page. Applied
Mechanics and Materials, 496-500, pp.2038-2041.
5
1 out of 5
Your All-in-One AI-Powered Toolkit for Academic Success.
+13062052269
info@desklib.com
Available 24*7 on WhatsApp / Email
![[object Object]](/_next/static/media/star-bottom.7253800d.svg)
Unlock your academic potential
Copyright © 2020–2026 A2Z Services. All Rights Reserved. Developed and managed by ZUCOL.