logo

Big Data and Analytics - Analysis of Crimes in Chicago

The assignment requires students to work in teams to write a Data Analytical report using Watson Analytics to analyze and visualize a given dataset on reported incidents of crime.

13 Pages2364 Words86 Views
   

Added on  2023-06-08

About This Document

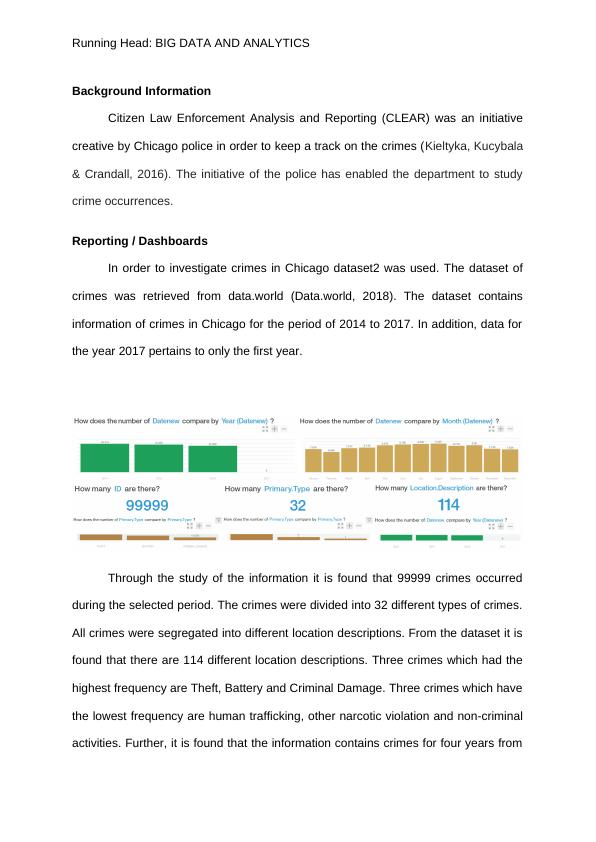
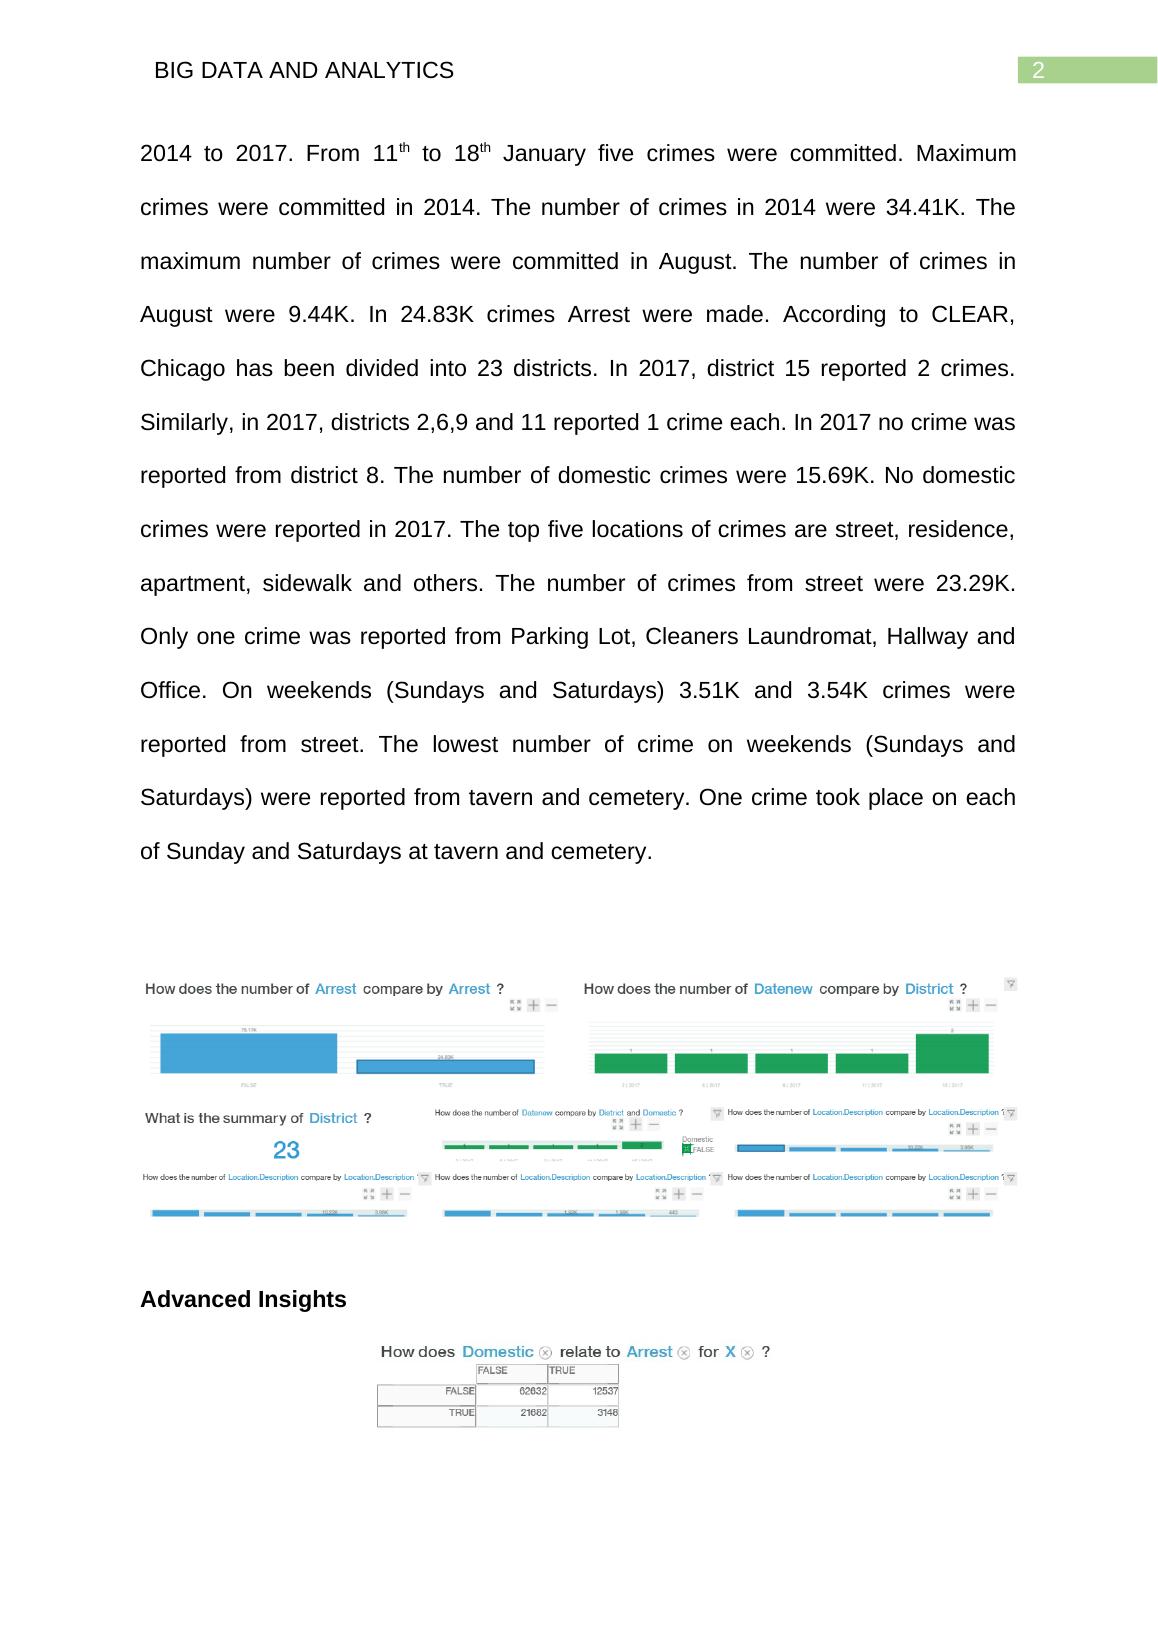
This article provides an analysis of crimes in Chicago using Big Data and Analytics. It includes reporting/dashboards, advanced insights, research, and recommendations for the police chief.

Big Data and Analytics - Analysis of Crimes in Chicago

The assignment requires students to work in teams to write a Data Analytical report using Watson Analytics to analyze and visualize a given dataset on reported incidents of crime.

   Added on 2023-06-08

ShareRelated Documents
Running Head: BIG DATA AND ANALYTICS
Big Data and Analytics
Name of the Student:
Name of the University:
Course ID:
Big Data and Analytics - Analysis of Crimes in Chicago_1
1BIG DATA AND ANALYTICS
Table of Contents
Background Information..............................................................................................1
Reporting / Dashboards.............................................................................................. 1
Advanced Insights.......................................................................................................2
Research.....................................................................................................................4
Recommendations for POLICE CHIEF.......................................................................6
Cover letter..................................................................................................................7
The Reflection.............................................................................................................9
Reference..................................................................................................................10
Big Data and Analytics - Analysis of Crimes in Chicago_2
Running Head: BIG DATA AND ANALYTICS
Background Information
Citizen Law Enforcement Analysis and Reporting (CLEAR) was an initiative
creative by Chicago police in order to keep a track on the crimes (Kieltyka, Kucybala
& Crandall, 2016). The initiative of the police has enabled the department to study
crime occurrences.
Reporting / Dashboards
In order to investigate crimes in Chicago dataset2 was used. The dataset of
crimes was retrieved from data.world (Data.world, 2018). The dataset contains
information of crimes in Chicago for the period of 2014 to 2017. In addition, data for
the year 2017 pertains to only the first year.
Through the study of the information it is found that 99999 crimes occurred
during the selected period. The crimes were divided into 32 different types of crimes.
All crimes were segregated into different location descriptions. From the dataset it is
found that there are 114 different location descriptions. Three crimes which had the
highest frequency are Theft, Battery and Criminal Damage. Three crimes which have
the lowest frequency are human trafficking, other narcotic violation and non-criminal
activities. Further, it is found that the information contains crimes for four years from
Big Data and Analytics - Analysis of Crimes in Chicago_3
2BIG DATA AND ANALYTICS
2014 to 2017. From 11th to 18th January five crimes were committed. Maximum
crimes were committed in 2014. The number of crimes in 2014 were 34.41K. The
maximum number of crimes were committed in August. The number of crimes in
August were 9.44K. In 24.83K crimes Arrest were made. According to CLEAR,
Chicago has been divided into 23 districts. In 2017, district 15 reported 2 crimes.
Similarly, in 2017, districts 2,6,9 and 11 reported 1 crime each. In 2017 no crime was
reported from district 8. The number of domestic crimes were 15.69K. No domestic
crimes were reported in 2017. The top five locations of crimes are street, residence,
apartment, sidewalk and others. The number of crimes from street were 23.29K.
Only one crime was reported from Parking Lot, Cleaners Laundromat, Hallway and
Office. On weekends (Sundays and Saturdays) 3.51K and 3.54K crimes were
reported from street. The lowest number of crime on weekends (Sundays and
Saturdays) were reported from tavern and cemetery. One crime took place on each
of Sunday and Saturdays at tavern and cemetery.
Advanced Insights
Big Data and Analytics - Analysis of Crimes in Chicago_4

End of preview

Want to access all the pages? Upload your documents or become a member.

Related Documents
Big Data and Analytics: Insights on Crime Trends in Chicago
|11
|2583
|352

Big Data and Analytics
|10
|1614
|63

Analysis of Crimes in Chicago: Statistics, Frequency, Occurrence, Districts, and Location Description
|11
|324
|310

Real Time Analytics - Analysis of Chicago Crime Data
|29
|1588
|118

Software Engineering Assignment (Solved)
|8
|1160
|373

Big Data Analysis for Chicago Police Department using IBM Watson Analytics
|17
|2193
|371