Big Data Analytics Report: Analyzing Energy Usage and CO2 Emissions
VerifiedAdded on 2023/06/11
|12
|2772
|473
Report
AI Summary
This report analyzes energy utilization drivers and CO2 emissions, focusing on the Solar Cities project data. Utilizing IBM Watson Analytics, the analysis explores factors influencing energy consumption, such as rooftop color, PV capacity, insulation, and user age. The findings highlight energy consumption patterns across different demographics and time periods, identifying key areas for efficiency improvements. The report also includes dashboard solutions for energy management, providing insights into energy production, consumption by sector, and financial KPIs. The dashboards offer a comprehensive overview of energy-related data, aiding in strategic decision-making for energy companies.

Big Data Analytics
Paraphrase This Document
Need a fresh take? Get an instant paraphrase of this document with our AI Paraphraser
Table of Contents
1. Introduction.......................................................................................................................................2
1.1 Background of the Project........................................................................................................2
1.2 Scope of the project...................................................................................................................3
2. Analysis By using IBM Watson Analytics........................................................................................3
3. Solution using Big Data Analytics Tool - Dashboard......................................................................6
4. Conclusion........................................................................................................................................10
References................................................................................................................................................11
1
1. Introduction
The primary aim of this analysis is to comprehend ideas of energy utilization drivers and
to establish that high measure of electrical vitality utilization from the coal let go plants. And
also we have to look at the drivers of CO2. All through this venture we will look into about sun
oriented urban areas venture. The examination will be founded on which mix of highlights
feature where efficiencies could be made in the vitality utilization decrease and break down the
prescient model alongside the discourse about request on future vitality utilize and CO2 gas
emanation. This prescient examination will be finished by utilizing Watson Analytics.
1.1 Background of the Project
The Solar urban communities project was a task drove by the University of Ballarat,
(previous name of Federation University), which included the enlistment of family units and
organizations over the LoddonMallee and Grampians areas to screen changes in energy
utilization. The undertaking took a gander at various variables that could impact energy
utilization. These components were separated into sets of highlights, and estimations were taken
for each particular element. For instance, a factor could be identified with a home's development
materials. In which case an element could be "staying development compose" and an estimation
would be taken to decide the development write for each abode and put away in the
informational collection. For instance "abiding development compose" could contain the
qualities block, block facade and so forth... A large number of these highlights are incorporated
inside the given Solar Cities informational collection.
The accompanying are sets of highlights incorporated into the given informational
collection:
Adoption of sunlight based energy innovations
Geographic attributes
Physical qualities of the abodes, including such things as the homes age, estimate,
number of stories, number of lights, protection and so on.
2
⊘ This is a preview!⊘
Do you want full access?
Subscribe today to unlock all pages.
Trusted by 1+ million students worldwide
1.2 Scope of the project
The essential objective of this task is to fathom the drivers of vitality usage, and as an
enormous level of electrical vitality is made by coal ended plants, by then on the other hand the
drivers of CO2.
2. Analysis By using IBM Watson Analytics
By prescient investigation, a few thoughts have accommodated vitality utilization in
structures that are given beneath. The investigation has been done through IBM Watson Analysis
and perception tool (Ibm Redbooks., 2014). The prescient investigation encourages us to design
future CO2 discharge lessening in structures (Balan & Otto, 2017).
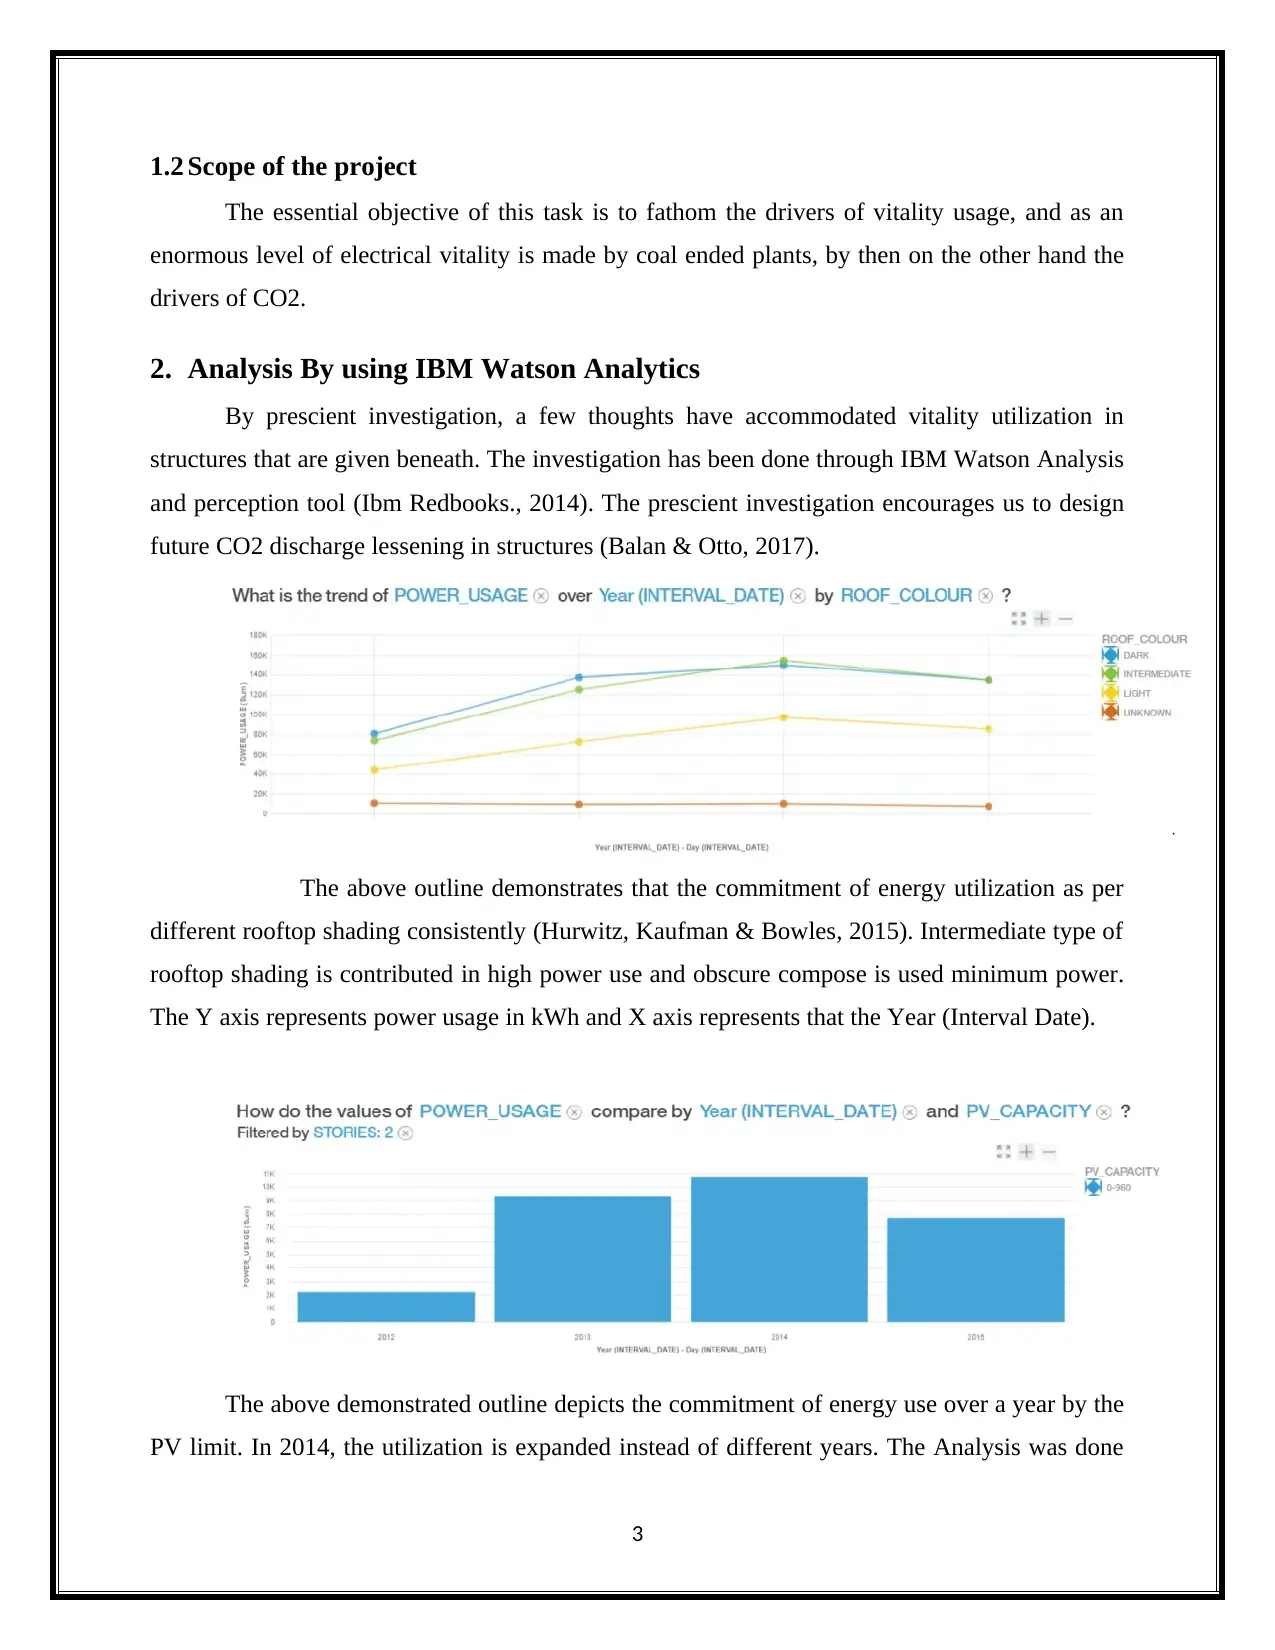
The above outline demonstrates that the commitment of energy utilization as per
different rooftop shading consistently (Hurwitz, Kaufman & Bowles, 2015). Intermediate type of
rooftop shading is contributed in high power use and obscure compose is used minimum power.
The Y axis represents power usage in kWh and X axis represents that the Year (Interval Date).
The above demonstrated outline depicts the commitment of energy use over a year by the
PV limit. In 2014, the utilization is expanded instead of different years. The Analysis was done
3
The essential objective of this task is to fathom the drivers of vitality usage, and as an
enormous level of electrical vitality is made by coal ended plants, by then on the other hand the
drivers of CO2.
2. Analysis By using IBM Watson Analytics
By prescient investigation, a few thoughts have accommodated vitality utilization in
structures that are given beneath. The investigation has been done through IBM Watson Analysis
and perception tool (Ibm Redbooks., 2014). The prescient investigation encourages us to design
future CO2 discharge lessening in structures (Balan & Otto, 2017).
The above outline demonstrates that the commitment of energy utilization as per
different rooftop shading consistently (Hurwitz, Kaufman & Bowles, 2015). Intermediate type of
rooftop shading is contributed in high power use and obscure compose is used minimum power.
The Y axis represents power usage in kWh and X axis represents that the Year (Interval Date).
The above demonstrated outline depicts the commitment of energy use over a year by the
PV limit. In 2014, the utilization is expanded instead of different years. The Analysis was done
3
Paraphrase This Document
Need a fresh take? Get an instant paraphrase of this document with our AI Paraphraser
with the following parameters such as power usage, PV capacity and Year (Interval Date). The
above data is filtered by 2 storied house types. The PV capacity is determined between 0 and
900.
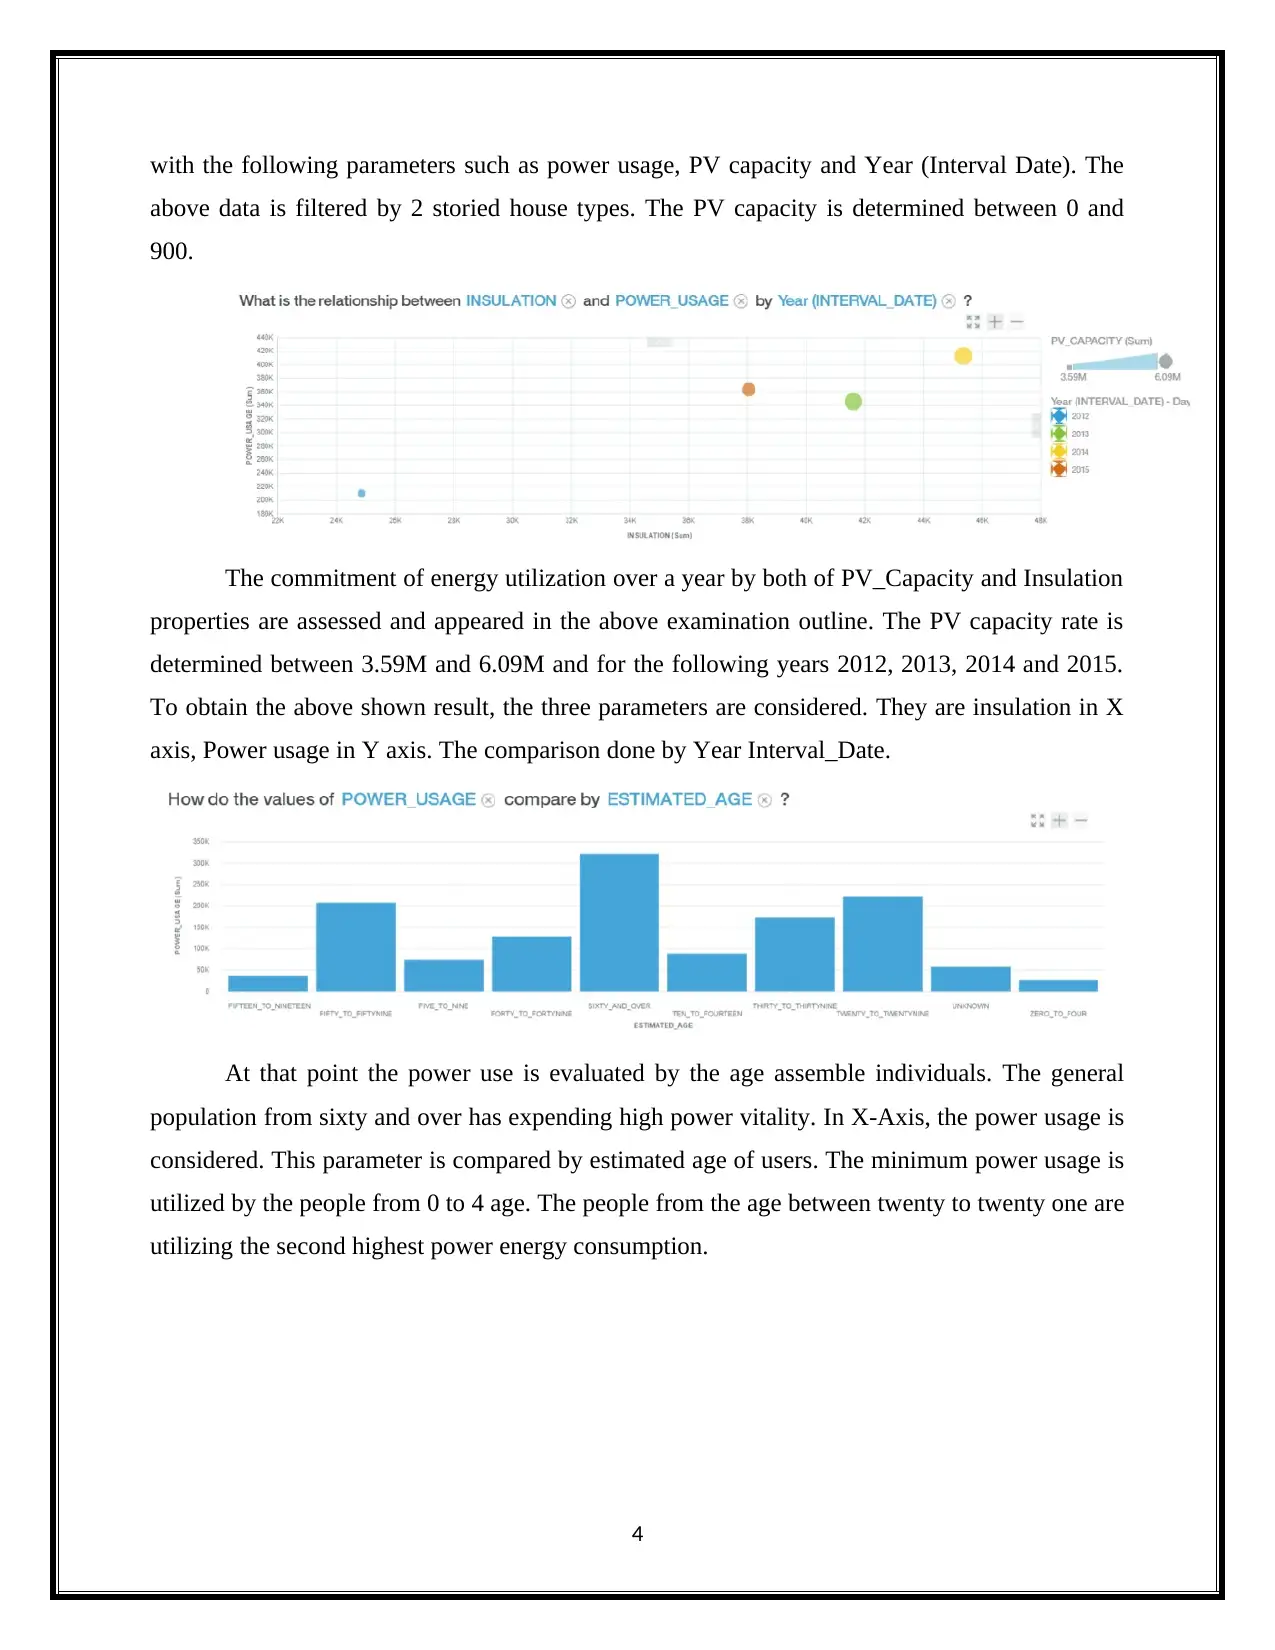
The commitment of energy utilization over a year by both of PV_Capacity and Insulation
properties are assessed and appeared in the above examination outline. The PV capacity rate is
determined between 3.59M and 6.09M and for the following years 2012, 2013, 2014 and 2015.
To obtain the above shown result, the three parameters are considered. They are insulation in X
axis, Power usage in Y axis. The comparison done by Year Interval_Date.
At that point the power use is evaluated by the age assemble individuals. The general
population from sixty and over has expending high power vitality. In X-Axis, the power usage is
considered. This parameter is compared by estimated age of users. The minimum power usage is
utilized by the people from 0 to 4 age. The people from the age between twenty to twenty one are
utilizing the second highest power energy consumption.
4
above data is filtered by 2 storied house types. The PV capacity is determined between 0 and
900.
The commitment of energy utilization over a year by both of PV_Capacity and Insulation
properties are assessed and appeared in the above examination outline. The PV capacity rate is
determined between 3.59M and 6.09M and for the following years 2012, 2013, 2014 and 2015.
To obtain the above shown result, the three parameters are considered. They are insulation in X
axis, Power usage in Y axis. The comparison done by Year Interval_Date.
At that point the power use is evaluated by the age assemble individuals. The general
population from sixty and over has expending high power vitality. In X-Axis, the power usage is
considered. This parameter is compared by estimated age of users. The minimum power usage is
utilized by the people from 0 to 4 age. The people from the age between twenty to twenty one are
utilizing the second highest power energy consumption.
4
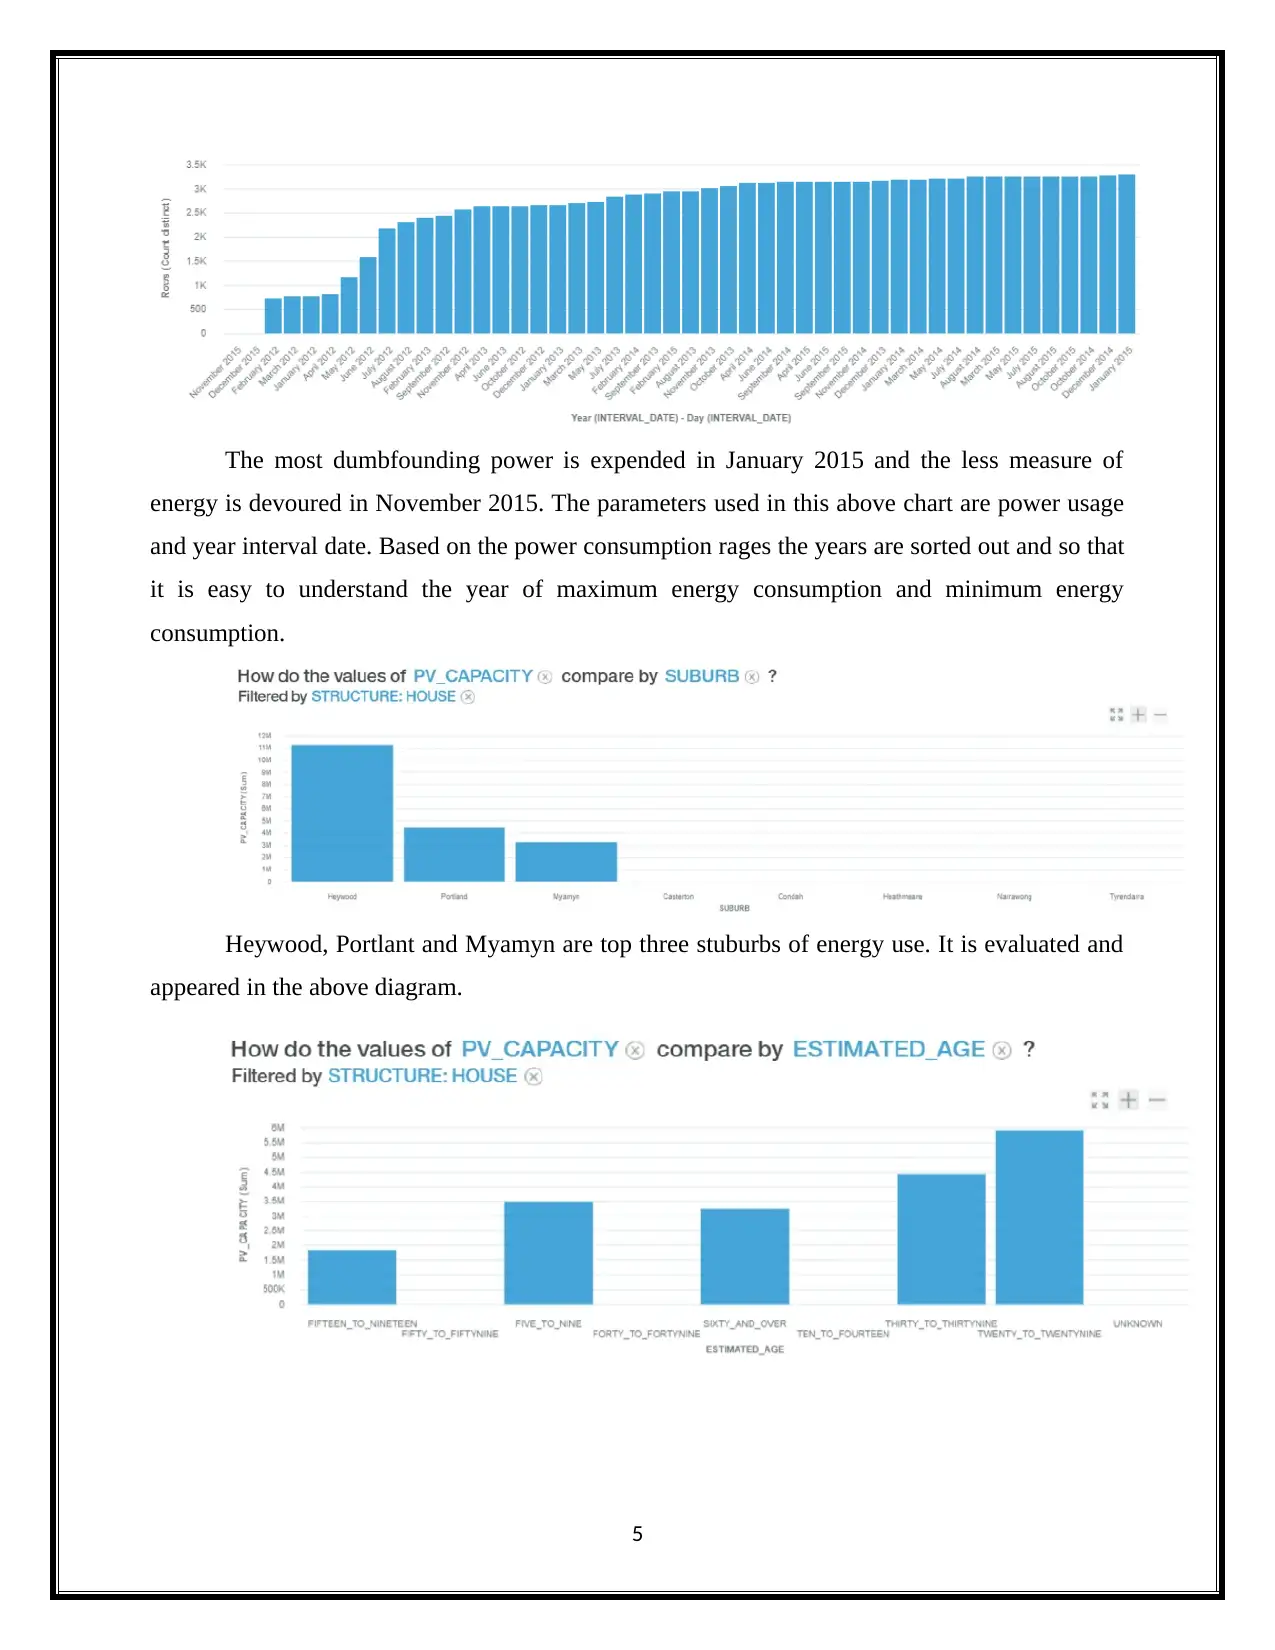
The most dumbfounding power is expended in January 2015 and the less measure of
energy is devoured in November 2015. The parameters used in this above chart are power usage
and year interval date. Based on the power consumption rages the years are sorted out and so that
it is easy to understand the year of maximum energy consumption and minimum energy
consumption.
Heywood, Portlant and Myamyn are top three stuburbs of energy use. It is evaluated and
appeared in the above diagram.
5
⊘ This is a preview!⊘
Do you want full access?
Subscribe today to unlock all pages.
Trusted by 1+ million students worldwide
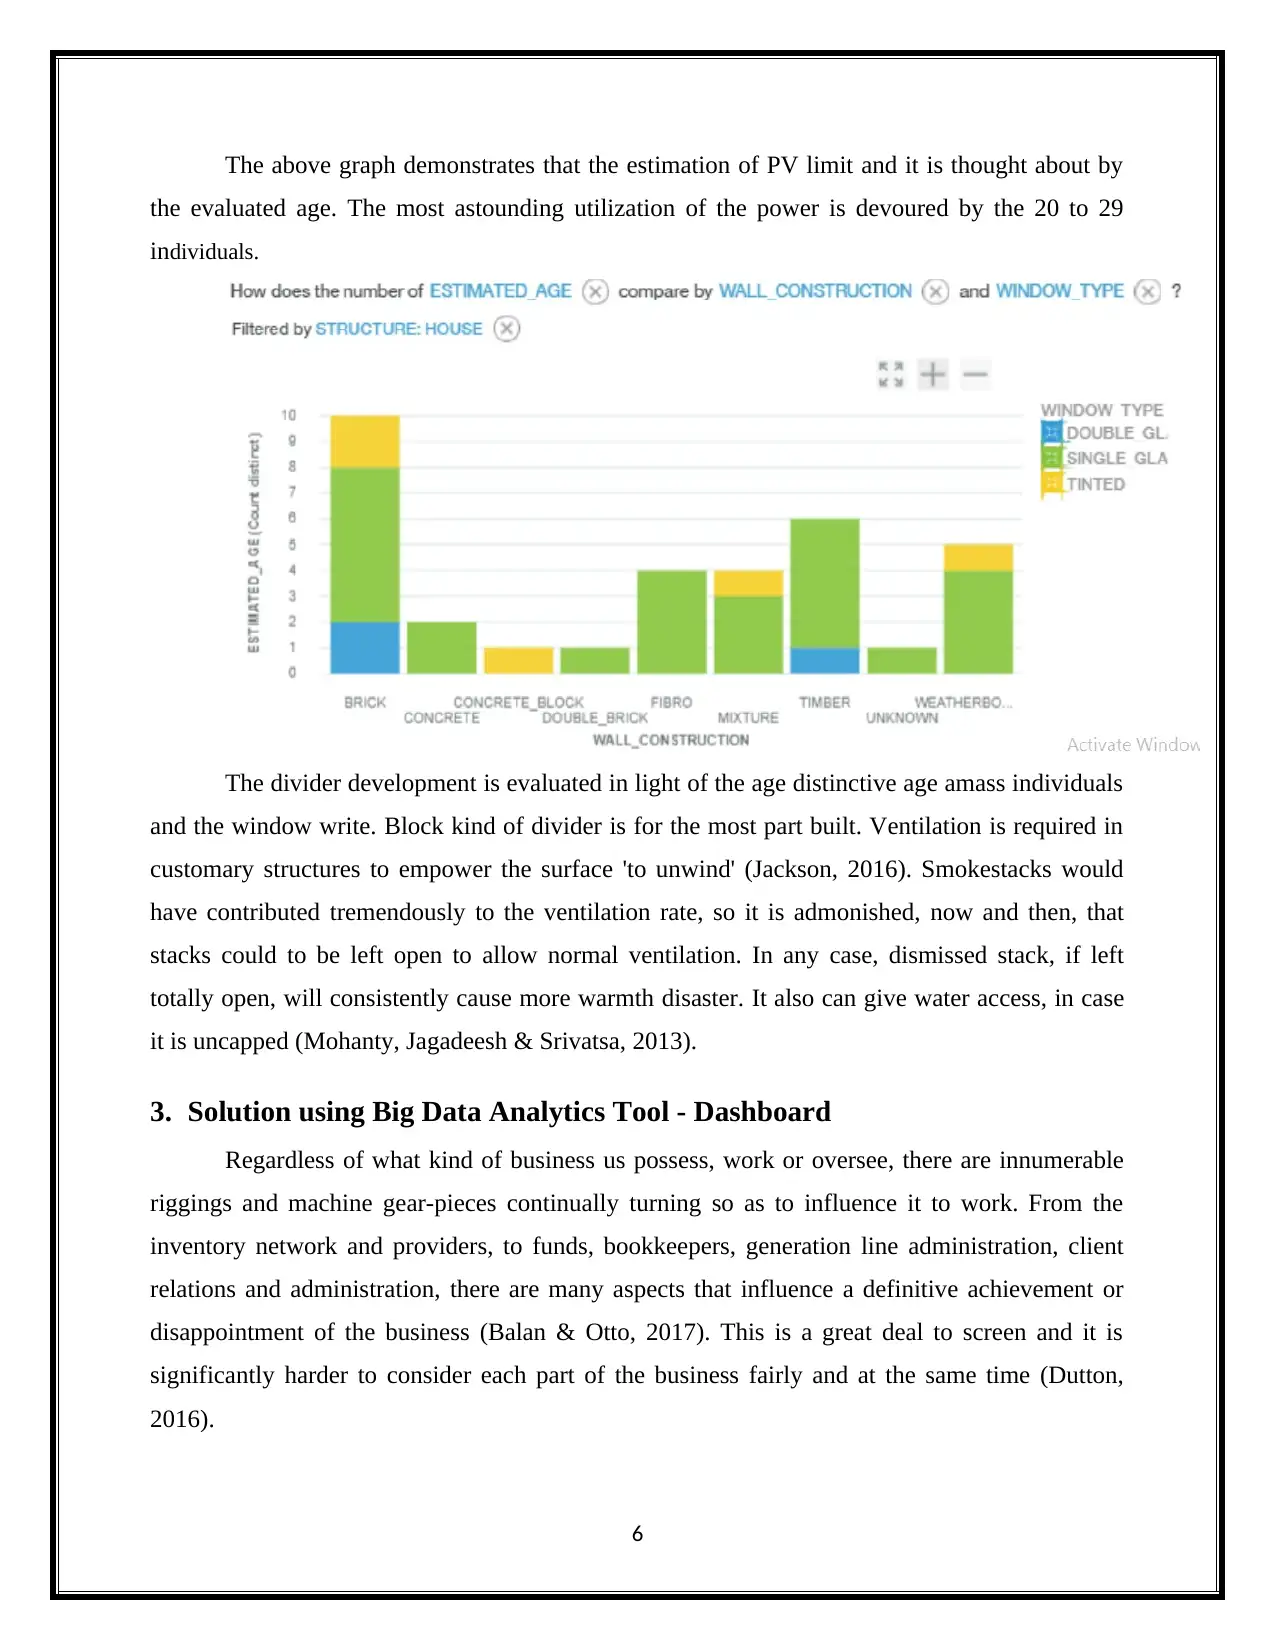
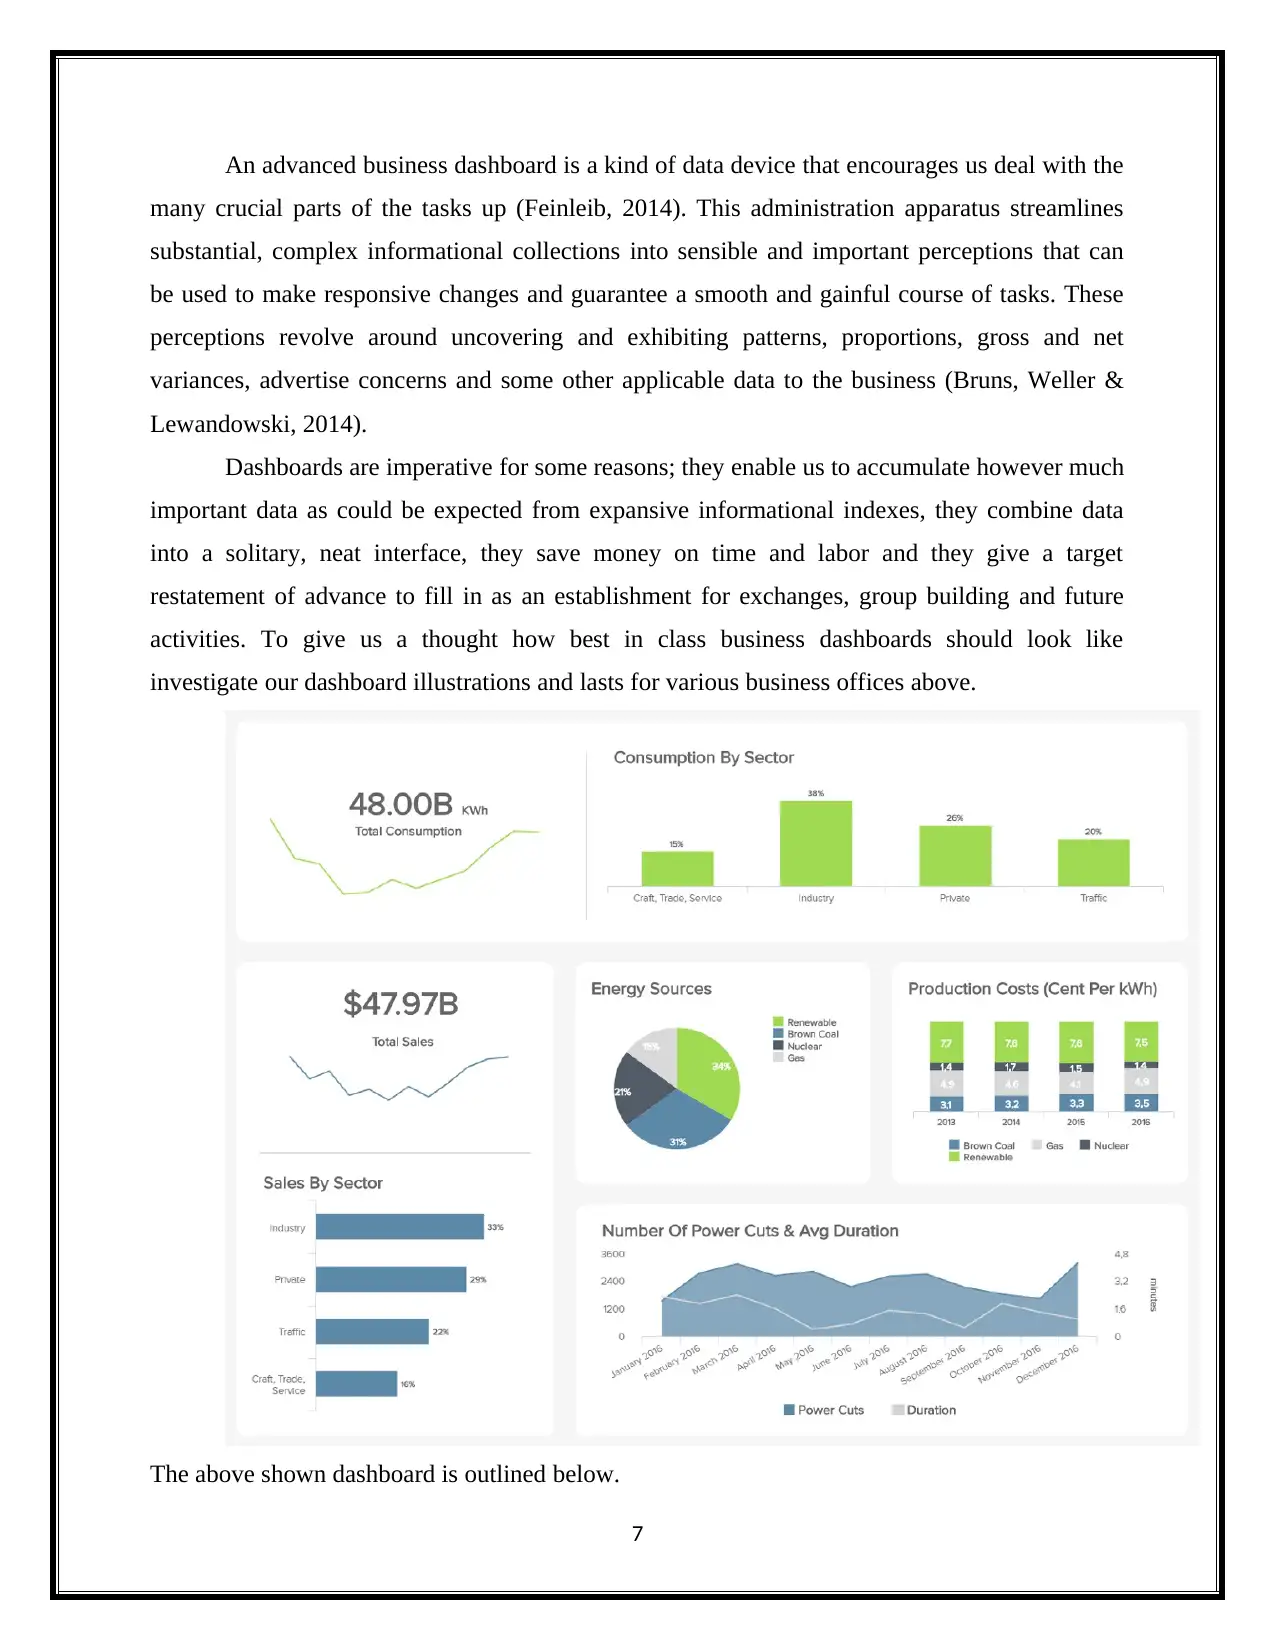
The above graph demonstrates that the estimation of PV limit and it is thought about by
the evaluated age. The most astounding utilization of the power is devoured by the 20 to 29
individuals.
The divider development is evaluated in light of the age distinctive age amass individuals
and the window write. Block kind of divider is for the most part built. Ventilation is required in
customary structures to empower the surface 'to unwind' (Jackson, 2016). Smokestacks would
have contributed tremendously to the ventilation rate, so it is admonished, now and then, that
stacks could to be left open to allow normal ventilation. In any case, dismissed stack, if left
totally open, will consistently cause more warmth disaster. It also can give water access, in case
it is uncapped (Mohanty, Jagadeesh & Srivatsa, 2013).
3. Solution using Big Data Analytics Tool - Dashboard
Regardless of what kind of business us possess, work or oversee, there are innumerable
riggings and machine gear-pieces continually turning so as to influence it to work. From the
inventory network and providers, to funds, bookkeepers, generation line administration, client
relations and administration, there are many aspects that influence a definitive achievement or
disappointment of the business (Balan & Otto, 2017). This is a great deal to screen and it is
significantly harder to consider each part of the business fairly and at the same time (Dutton,
2016).
6
Paraphrase This Document
Need a fresh take? Get an instant paraphrase of this document with our AI Paraphraser
An advanced business dashboard is a kind of data device that encourages us deal with the
many crucial parts of the tasks up (Feinleib, 2014). This administration apparatus streamlines
substantial, complex informational collections into sensible and important perceptions that can
be used to make responsive changes and guarantee a smooth and gainful course of tasks. These
perceptions revolve around uncovering and exhibiting patterns, proportions, gross and net
variances, advertise concerns and some other applicable data to the business (Bruns, Weller &
Lewandowski, 2014).
Dashboards are imperative for some reasons; they enable us to accumulate however much
important data as could be expected from expansive informational indexes, they combine data
into a solitary, neat interface, they save money on time and labor and they give a target
restatement of advance to fill in as an establishment for exchanges, group building and future
activities. To give us a thought how best in class business dashboards should look like
investigate our dashboard illustrations and lasts for various business offices above.
The above shown dashboard is outlined below.
7

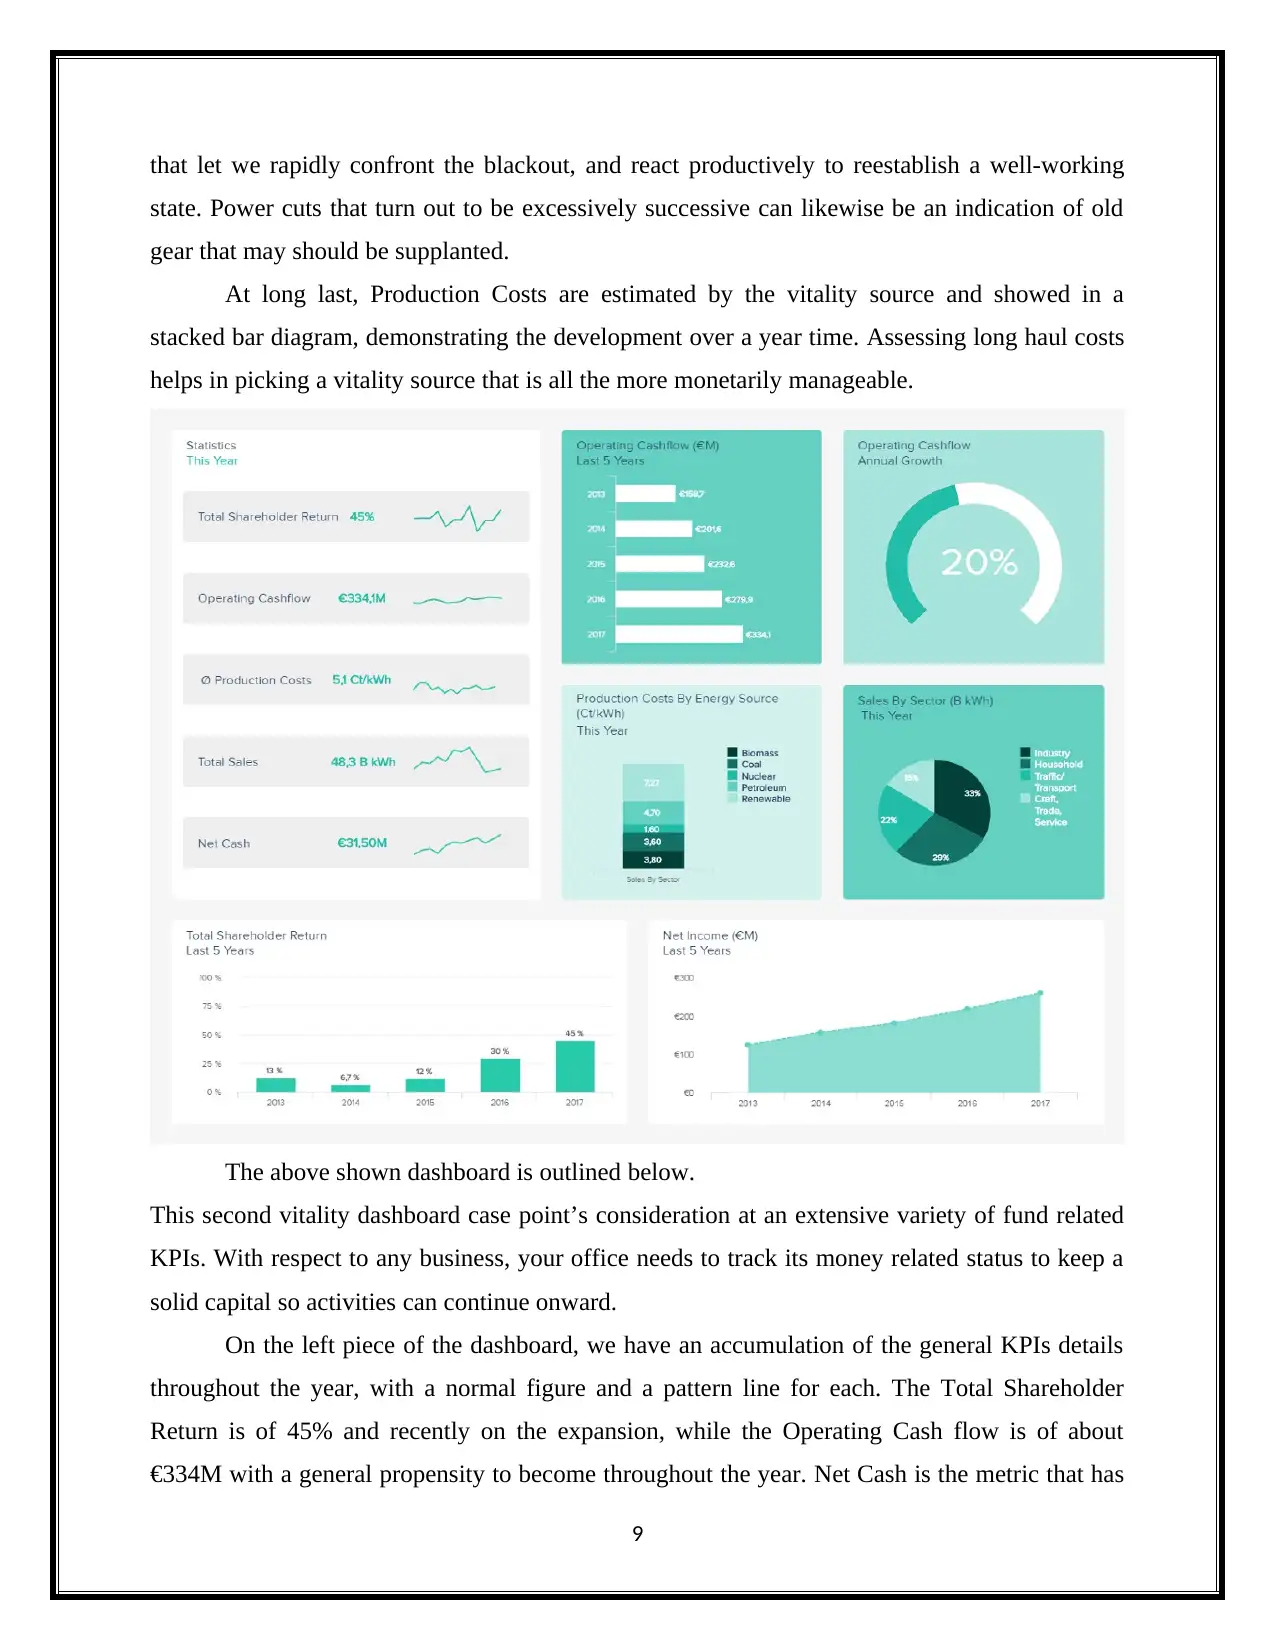
The organization has many locales creating vitality from various sorts of sources. As a
general director, we need a review of the considerable number of plants and of their yield to
administer the entire legitimately. This first vitality administration dashboard furnishes us with
the diagram we require: from the aggregate deals to the utilization by area, to the generation
costs per source write, we get the comprehensive view of the distinctive plants' execution.
The best piece of that vitality administration dashboard centers on the aggregate
utilization acknowledged by various parts. Without amaze, the industry area devoured the most
power, with 38%, while families and transports have 26% and 20% each. It is essential to know
how the utilization is circulated between the parts we supply, and how it develops, to
comprehend who the primary customers are and answer their necessities. Huge modern plants
require without a doubt more and distinctive kinds of vitality than a basic provincial family unit.
In addition, it won't be transported similarly. Separating the Total Consumption by Sector tells us
which territory goes through the amount of the power, a marker enabling us to adjust both
generation and conveyance as needs be. These bits of knowledge will extraordinarily help us in
arranging out the generation, it’s stockpiling and transport, and the staffing needs we require.
Underneath the utilization, we can discover the Sales separated by division too, which
take after an indistinguishable pattern from the utilization; yet additionally the utilization of
inexhaustible per part. Sustainable power sources are increasingly created as they are
increasingly required by customers, who have understood the human effect on its condition, and
that common assets that are not all vast. With a worldwide temperature alteration, individuals
search for elective energies that deliver less CO2 emanations and add to setting general
utilization on a supportable way. Up until this point, family units are the greatest searchers; yet
organizations and huge enterprises are progressively required to make strides toward
environmental friendliness due to their significant effect, because of the colossal measure of
vitality they devour.
On a more operational level, the base metric screens the downtime of the office by
figuring the quantity of Power Cuts and their Total Duration. Power blackouts are regularly
feared by office bosses, however they are not a terrible thing and help the plant perform better.
At the point when downtime is booked and arranged, it gives we time to complete upkeep work
that deals with the frameworks, and guarantees a powerful activity over the long haul. In any
case, control cuts can come as a shock – in such case situation, it is basic to have measures set up
8
⊘ This is a preview!⊘
Do you want full access?
Subscribe today to unlock all pages.
Trusted by 1+ million students worldwide
that let we rapidly confront the blackout, and react productively to reestablish a well-working
state. Power cuts that turn out to be excessively successive can likewise be an indication of old
gear that may should be supplanted.
At long last, Production Costs are estimated by the vitality source and showed in a
stacked bar diagram, demonstrating the development over a year time. Assessing long haul costs
helps in picking a vitality source that is all the more monetarily manageable.
The above shown dashboard is outlined below.
This second vitality dashboard case point’s consideration at an extensive variety of fund related
KPIs. With respect to any business, your office needs to track its money related status to keep a
solid capital so activities can continue onward.
On the left piece of the dashboard, we have an accumulation of the general KPIs details
throughout the year, with a normal figure and a pattern line for each. The Total Shareholder
Return is of 45% and recently on the expansion, while the Operating Cash flow is of about
€334M with a general propensity to become throughout the year. Net Cash is the metric that has
9
Paraphrase This Document
Need a fresh take? Get an instant paraphrase of this document with our AI Paraphraser
a reasonable development incline, while the Production Costs and Total Sales remained
somewhat even, with increments and reductions.
Every one of these measurements is itemized in whatever is left of the dashboard. The
first of them, Operating Cash flow, has had a yearly development of 20%, that we can see with
the even bar diagram demonstrating its advancement in the course of recent years. The Operating
Cash flow assesses if an organization can make enough money in order to manage yet in addition
develop its tasks.
The Production Costs showed are separated by the wellspring of vitality they start. We see
that inexhaustible has the most elevated generation costs with 7,27 penny for each kWh, while
biomass is the least expensive to make. As expressed in the principal vitality administration
dashboard, you have to assess costs after some time to know which is the most monetarily
reasonable. To ascertain the generation costs, frequently alluded to as "LCOE" for Leveled Cost
of Electricity, you have to partition the aggregate costs (fabricating, working and keeping up an
office over its lifetime), by the aggregate creation evaluated over that lifetime. You at that point
have the normal least cost at which power must be sold, in order to adjust the expenses with
benefits. Remember that an advantage like sunlight based, wind, and different renewables may
require greater forthright building costs, however are less expensive to work as they require less
fuel.
The Total Shareholder Return (TSR) is shown on the base, and demonstrates a development
more than 5 years. Communicated as a rate, it speaks to the distinction between the offer cost
between the start and the finish of the year, estimating the advance and execution of the
organization's stocks. Contrasting the TSR and those of your rivals will let you know whether
you are on the correct tracks. The thought is to convey long haul an incentive to the investors, by
creating money related advantages for them. It is a way the market assesses the execution of an
organization over a specific day and age. The Net Income speaks to the benefits an organization
makes, in the wake of concluding every one of the expenses of working together: interests,
duties, devaluation, and different costs. It is an essential pointer of how beneficial the
organization is. On this vitality monetary dashboard, the Net Income develops from about
€100M up to €280M throughout 4 years, which is a decent outcome.
10
4. Conclusion
The examination depends on which combination of highlights feature where efficiencies
could be made in the vitality utilization decrease and dissected the prescient model alongside the
discourse about request on future vitality utilize and CO2 gas outflow. This prescient
examination is finished by utilizing Watson Analytics.
References
Balan, S., & Otto, J. (2017). Business intelligence in healthcare with IBM Watson Content
Analytics. [San Bernardino, CA]: Shilpa Balab and Joseph Otto.
Bruns, A., Weller, K., & Lewandowski, D. (2014). Twitter data analytics. Bradford: Emerald
Group Publishing Limited.
Dutton, C. (2016). Learning Watson Analytics. [Carpinteria, Calif.]: Lynda.com.
Feinleib, D. (2014). Big Data Bootcamp. Berkeley, CA: Apress.
Hurwitz, J., Kaufman, M., & Bowles, A. (2015). Cognitive computing and big data analytics.
Indianapolis: John Wiley & Sons.
IBM Redbooks. (2014). Ibm watson content analytics. [Place of publication not identified]:
Vervante.
Jackson, S. (2016). Cult of analytics. London: Routledge.
Mohanty, S., Jagadeesh, M., & Srivatsa, H. (2013). Big Data Imperatives. Berkeley, CA: Apress.
11
⊘ This is a preview!⊘
Do you want full access?
Subscribe today to unlock all pages.
Trusted by 1+ million students worldwide
1 out of 12

Your All-in-One AI-Powered Toolkit for Academic Success.
+13062052269
info@desklib.com
Available 24*7 on WhatsApp / Email
![[object Object]](/_next/static/media/star-bottom.7253800d.svg)
Unlock your academic potential
Copyright © 2020–2026 A2Z Services. All Rights Reserved. Developed and managed by ZUCOL.