Big Data Analysis: ICT707 Project on Bike Sharing and Kaggle Data
VerifiedAdded on  2023/06/04
|7
|1262
|182
Project
AI Summary
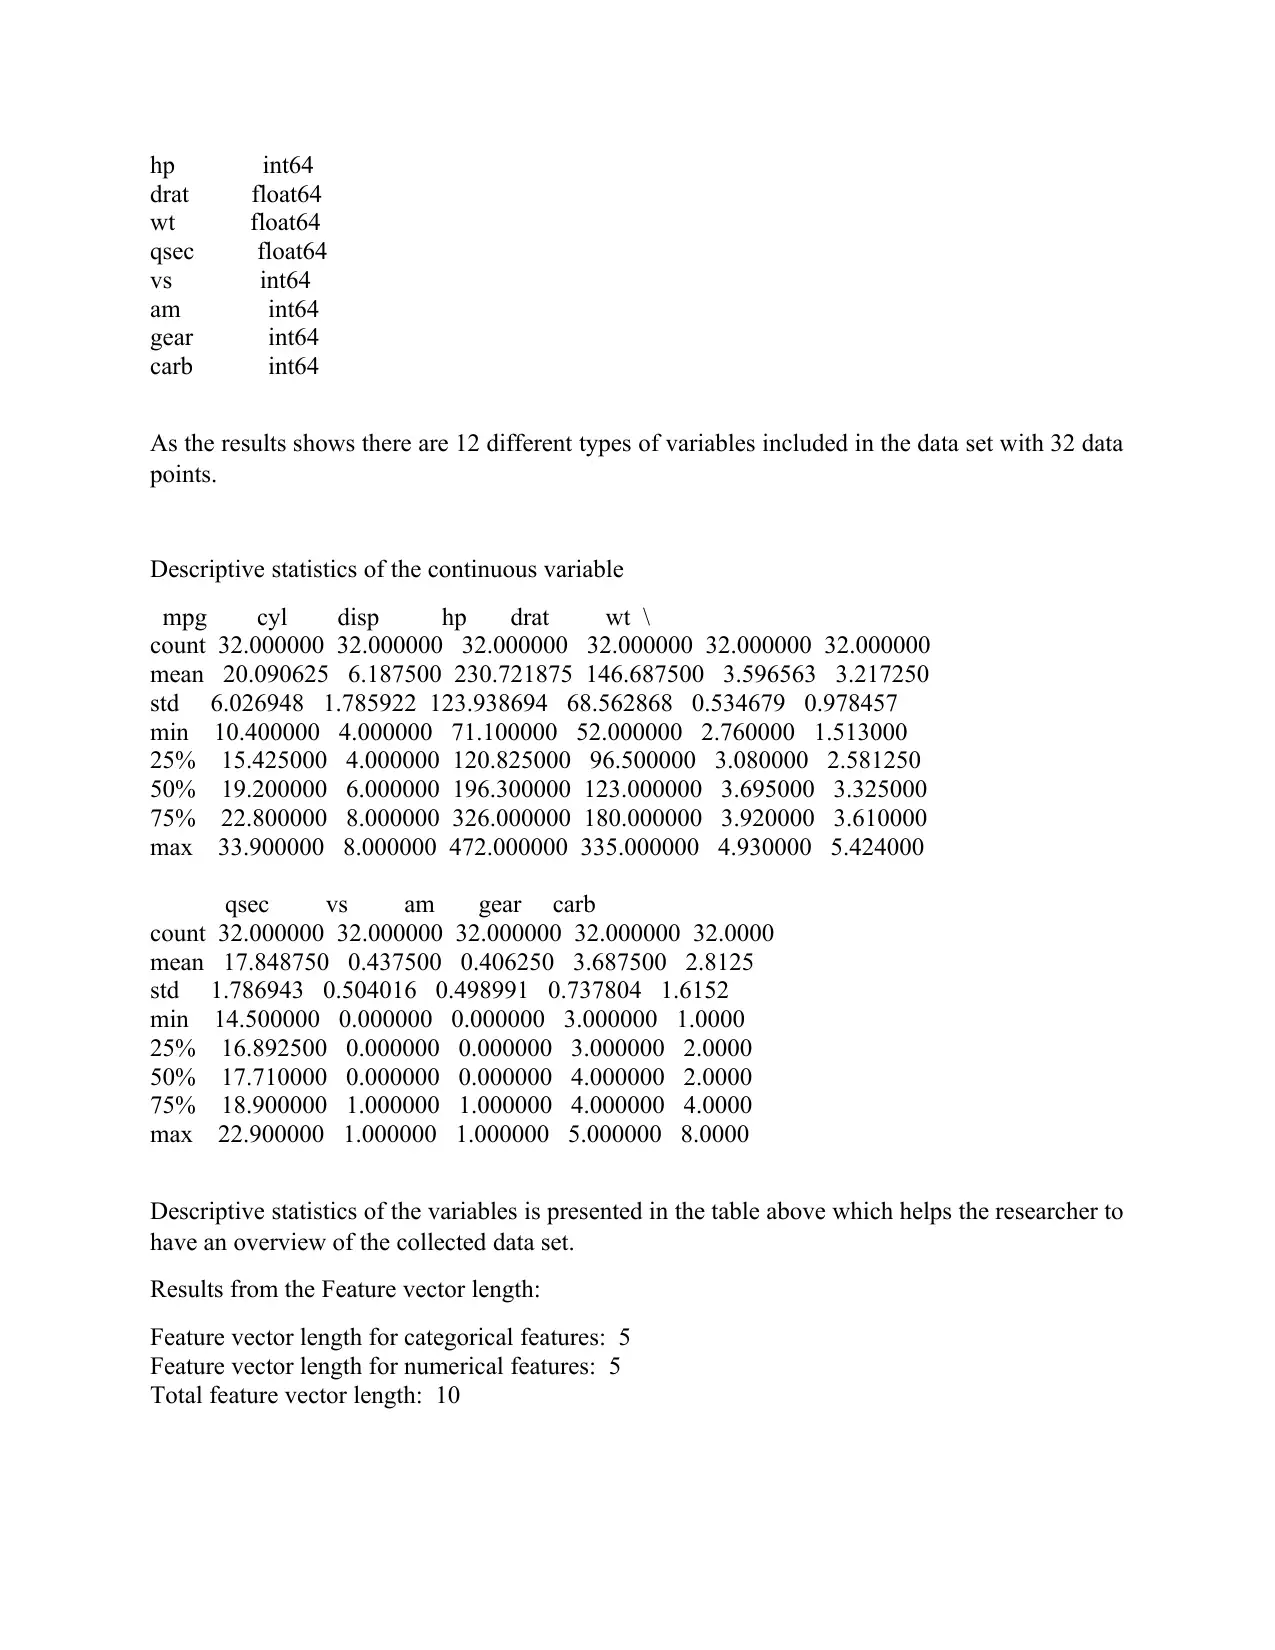
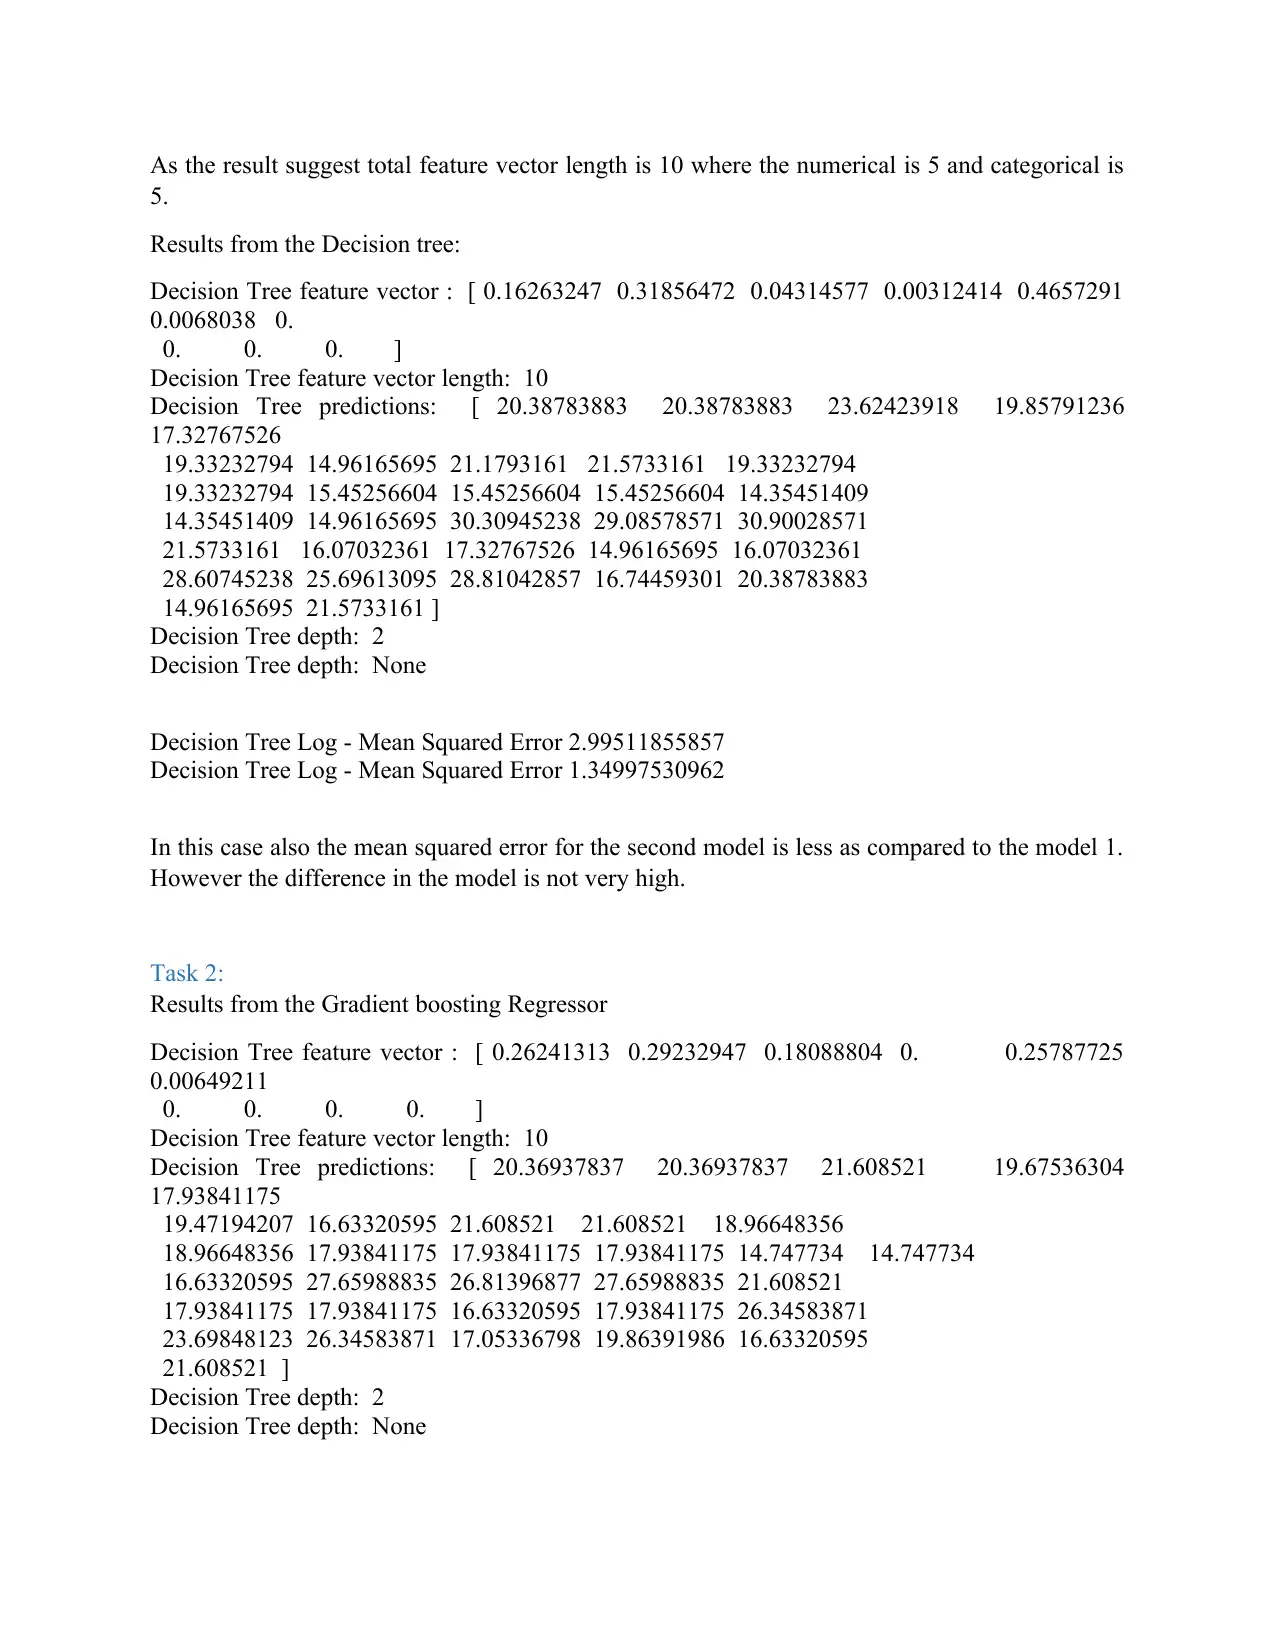
This Python project, conducted as part of the ICT707 Big Data course, involves the analysis of two datasets: bike sharing data and mtcars data from Kaggle. The project is divided into two sections, mirroring the assignment brief. The first section focuses on the bike sharing dataset, where descriptive statistics, including mean, median, and percentiles, are presented. Regression models, specifically Random Forest and Gradient Boosting Regressor, are applied to the data, and their performance is evaluated based on mean squared error. The second section uses the mtcars dataset from Kaggle, following a similar methodology. The project provides descriptive statistics, feature vector analysis, and the application of Decision Tree and Gradient Boosting Regressor models. Results, including feature vector lengths and mean squared error for each model, are presented, enabling a comparison of the models' effectiveness. The project demonstrates the application of data analysis techniques and regression modeling to real-world datasets, providing insights into model performance.

Python Project
Contents
SECTION A: Bike sharing Data..................................................................................................................1
Task 1:.....................................................................................................................................................1
Task 2:.....................................................................................................................................................4
SECTION B: Kaggle Data..........................................................................................................................4
Task 1:.....................................................................................................................................................4
Task 2:.....................................................................................................................................................6
SECTION A: Bike sharing Data
Results from the bike sharing data is shown in the first section. The random forest model and the
gradient bosting regressor model has been performed with this data set and the results are shown
below.
Task 1:
Types of the data set used in the study
(17379, 17)
instant int64
dteday object
season int64
yr int64
mnth int64
hr int64
holiday int64
weekday int64
workingday int64
Paraphrase This Document
Need a fresh take? Get an instant paraphrase of this document with our AI Paraphraser

weathersit int64
temp float64
atemp float64
hum float64
windspeed float64
casual int64
registered int64
cnt int64
dtype: object
Descriptive statistics of the data set :
instant season yr mnth hr \
count 17379.0000 17379.000000 17379.000000 17379.000000 17379.000000
mean 8690.0000 2.501640 0.502561 6.537775 11.546752
std 5017.0295 1.106918 0.500008 3.438776 6.914405
min 1.0000 1.000000 0.000000 1.000000 0.000000
25% 4345.5000 2.000000 0.000000 4.000000 6.000000
50% 8690.0000 3.000000 1.000000 7.000000 12.000000
75% 13034.5000 3.000000 1.000000 10.000000 18.000000
max 17379.0000 4.000000 1.000000 12.000000 23.000000
holiday weekday workingday weathersit temp \
count 17379.000000 17379.000000 17379.000000 17379.000000 17379.000000
mean 0.028770 3.003683 0.682721 1.425283 0.496987
std 0.167165 2.005771 0.465431 0.639357 0.192556
min 0.000000 0.000000 0.000000 1.000000 0.020000
25% 0.000000 1.000000 0.000000 1.000000 0.340000
50% 0.000000 3.000000 1.000000 1.000000 0.500000
75% 0.000000 5.000000 1.000000 2.000000 0.660000
max 1.000000 6.000000 1.000000 4.000000 1.000000
atemp hum windspeed casual registered \
count 17379.000000 17379.000000 17379.000000 17379.000000 17379.000000
mean 0.475775 0.627229 0.190098 35.676218 153.786869
std 0.171850 0.192930 0.122340 49.305030 151.357286
min 0.000000 0.000000 0.000000 0.000000 0.000000
25% 0.333300 0.480000 0.104500 4.000000 34.000000
50% 0.484800 0.630000 0.194000 17.000000 115.000000
75% 0.621200 0.780000 0.253700 48.000000 220.000000
max 1.000000 1.000000 0.850700 367.000000 886.000000
cnt
count 17379.000000
mean 189.463088

std 181.387599
min 1.000000
25% 40.000000
50% 142.000000
75% 281.000000
max 977.000000
The results from the descriptive statistics is shown in the table above and the results includes the
value for mean, median, standard deviation and the three major percentiles.
Results from the feature length:
Feature vector length for categorical features: 4
Feature vector length for numerical features: 7
Total feature vector length: 11
Results from the Random forest regression model
Decision Tree feature vector : [ 0. 0. 0. 0. 0. 0. 0. 0. 0. 0. 1.]
Decision Tree feature vector length: 10
Decision Tree predictions: [ 38.07836056 38.07836056 38.07836056 ..., 38.07836056
38.07836056
38.07836056]
Decision Tree depth: 2
Decision Tree depth: None
Results from the Decision tree log
Decision Tree Log - Mean Squared Error 3648.31141046
Decision Tree Log - Mean Squared Error 43.7264464287
The results from the decision tree and the decision tree log is shown in the table above and the it
shows that the decision tree log for the first model is 3648.311 whereas in the second decision
⊘ This is a preview!⊘
Do you want full access?
Subscribe today to unlock all pages.

Trusted by 1+ million students worldwide

tree log mean squared error is 43.72. On the basis of the errors it can be said that the second
model is better as the error value is less.
Task 2:
Results from the task 2 has been discussed in the current section
Gradient booster Regression
Decision Tree feature vector : [ 0. 0. 0. 0. 0. 0. 0.
0. 0. 0.03307816 0.96692184]
Decision Tree feature vector length: 10
Decision Tree predictions: [ 87.22443325 87.22443325 87.22443325 ..., 117.91996176
99.23814659
87.22443325]
Decision Tree depth: 2
Decision Tree depth: None
Decision tree log
For the gradient booster regression the decision tree log has been shown below.
Decision Tree Log - Mean Squared Error 6359.19130385
Decision Tree Log - Mean Squared Error 57.0455144575
As the results shows in this case also the mean squared error is less in the second case, which
means that the second model is better as compared to the first one.
SECTION B: Kaggle Data
For the second part of the project the data from the Kaggle has been downloaded and similar
methodology was used to analyze the data. In this case the mtcars data from kaggle has been
used for the analysis purpose and the results from the analysis are shown in the below section.
Task 1:
Description of the data
(32, 12)
Unnamed: 0 object
mpg float64
cyl int64
disp float64
Paraphrase This Document
Need a fresh take? Get an instant paraphrase of this document with our AI Paraphraser

hp int64
drat float64
wt float64
qsec float64
vs int64
am int64
gear int64
carb int64
As the results shows there are 12 different types of variables included in the data set with 32 data
points.
Descriptive statistics of the continuous variable
mpg cyl disp hp drat wt \
count 32.000000 32.000000 32.000000 32.000000 32.000000 32.000000
mean 20.090625 6.187500 230.721875 146.687500 3.596563 3.217250
std 6.026948 1.785922 123.938694 68.562868 0.534679 0.978457
min 10.400000 4.000000 71.100000 52.000000 2.760000 1.513000
25% 15.425000 4.000000 120.825000 96.500000 3.080000 2.581250
50% 19.200000 6.000000 196.300000 123.000000 3.695000 3.325000
75% 22.800000 8.000000 326.000000 180.000000 3.920000 3.610000
max 33.900000 8.000000 472.000000 335.000000 4.930000 5.424000
qsec vs am gear carb
count 32.000000 32.000000 32.000000 32.000000 32.0000
mean 17.848750 0.437500 0.406250 3.687500 2.8125
std 1.786943 0.504016 0.498991 0.737804 1.6152
min 14.500000 0.000000 0.000000 3.000000 1.0000
25% 16.892500 0.000000 0.000000 3.000000 2.0000
50% 17.710000 0.000000 0.000000 4.000000 2.0000
75% 18.900000 1.000000 1.000000 4.000000 4.0000
max 22.900000 1.000000 1.000000 5.000000 8.0000
Descriptive statistics of the variables is presented in the table above which helps the researcher to
have an overview of the collected data set.
Results from the Feature vector length:
Feature vector length for categorical features: 5
Feature vector length for numerical features: 5
Total feature vector length: 10

As the result suggest total feature vector length is 10 where the numerical is 5 and categorical is
5.
Results from the Decision tree:
Decision Tree feature vector : [ 0.16263247 0.31856472 0.04314577 0.00312414 0.4657291
0.0068038 0.
0. 0. 0. ]
Decision Tree feature vector length: 10
Decision Tree predictions: [ 20.38783883 20.38783883 23.62423918 19.85791236
17.32767526
19.33232794 14.96165695 21.1793161 21.5733161 19.33232794
19.33232794 15.45256604 15.45256604 15.45256604 14.35451409
14.35451409 14.96165695 30.30945238 29.08578571 30.90028571
21.5733161 16.07032361 17.32767526 14.96165695 16.07032361
28.60745238 25.69613095 28.81042857 16.74459301 20.38783883
14.96165695 21.5733161 ]
Decision Tree depth: 2
Decision Tree depth: None
Decision Tree Log - Mean Squared Error 2.99511855857
Decision Tree Log - Mean Squared Error 1.34997530962
In this case also the mean squared error for the second model is less as compared to the model 1.
However the difference in the model is not very high.
Task 2:
Results from the Gradient boosting Regressor
Decision Tree feature vector : [ 0.26241313 0.29232947 0.18088804 0. 0.25787725
0.00649211
0. 0. 0. 0. ]
Decision Tree feature vector length: 10
Decision Tree predictions: [ 20.36937837 20.36937837 21.608521 19.67536304
17.93841175
19.47194207 16.63320595 21.608521 21.608521 18.96648356
18.96648356 17.93841175 17.93841175 17.93841175 14.747734 14.747734
16.63320595 27.65988835 26.81396877 27.65988835 21.608521
17.93841175 17.93841175 16.63320595 17.93841175 26.34583871
23.69848123 26.34583871 17.05336798 19.86391986 16.63320595
21.608521 ]
Decision Tree depth: 2
Decision Tree depth: None
⊘ This is a preview!⊘
Do you want full access?
Subscribe today to unlock all pages.

Trusted by 1+ million students worldwide

Decision Tree Log - Mean Squared Error 2.99511855857
Decision Tree Log - Mean Squared Error 1.34997530962
In this case also the mean squared error are less in the second case as compared to the first case.
Decision Tree Log - Mean Squared Error 1.34997530962
In this case also the mean squared error are less in the second case as compared to the first case.
1 out of 7
Your All-in-One AI-Powered Toolkit for Academic Success.
 +13062052269
info@desklib.com
Available 24*7 on WhatsApp / Email
Unlock your academic potential
Copyright © 2020–2026 A2Z Services. All Rights Reserved. Developed and managed by ZUCOL.