Bio Statistics: Data Analysis - University, Course, Semester Details

Verified

Added on  2021/06/14

|8
|813
|164
Homework Assignment
AI Summary
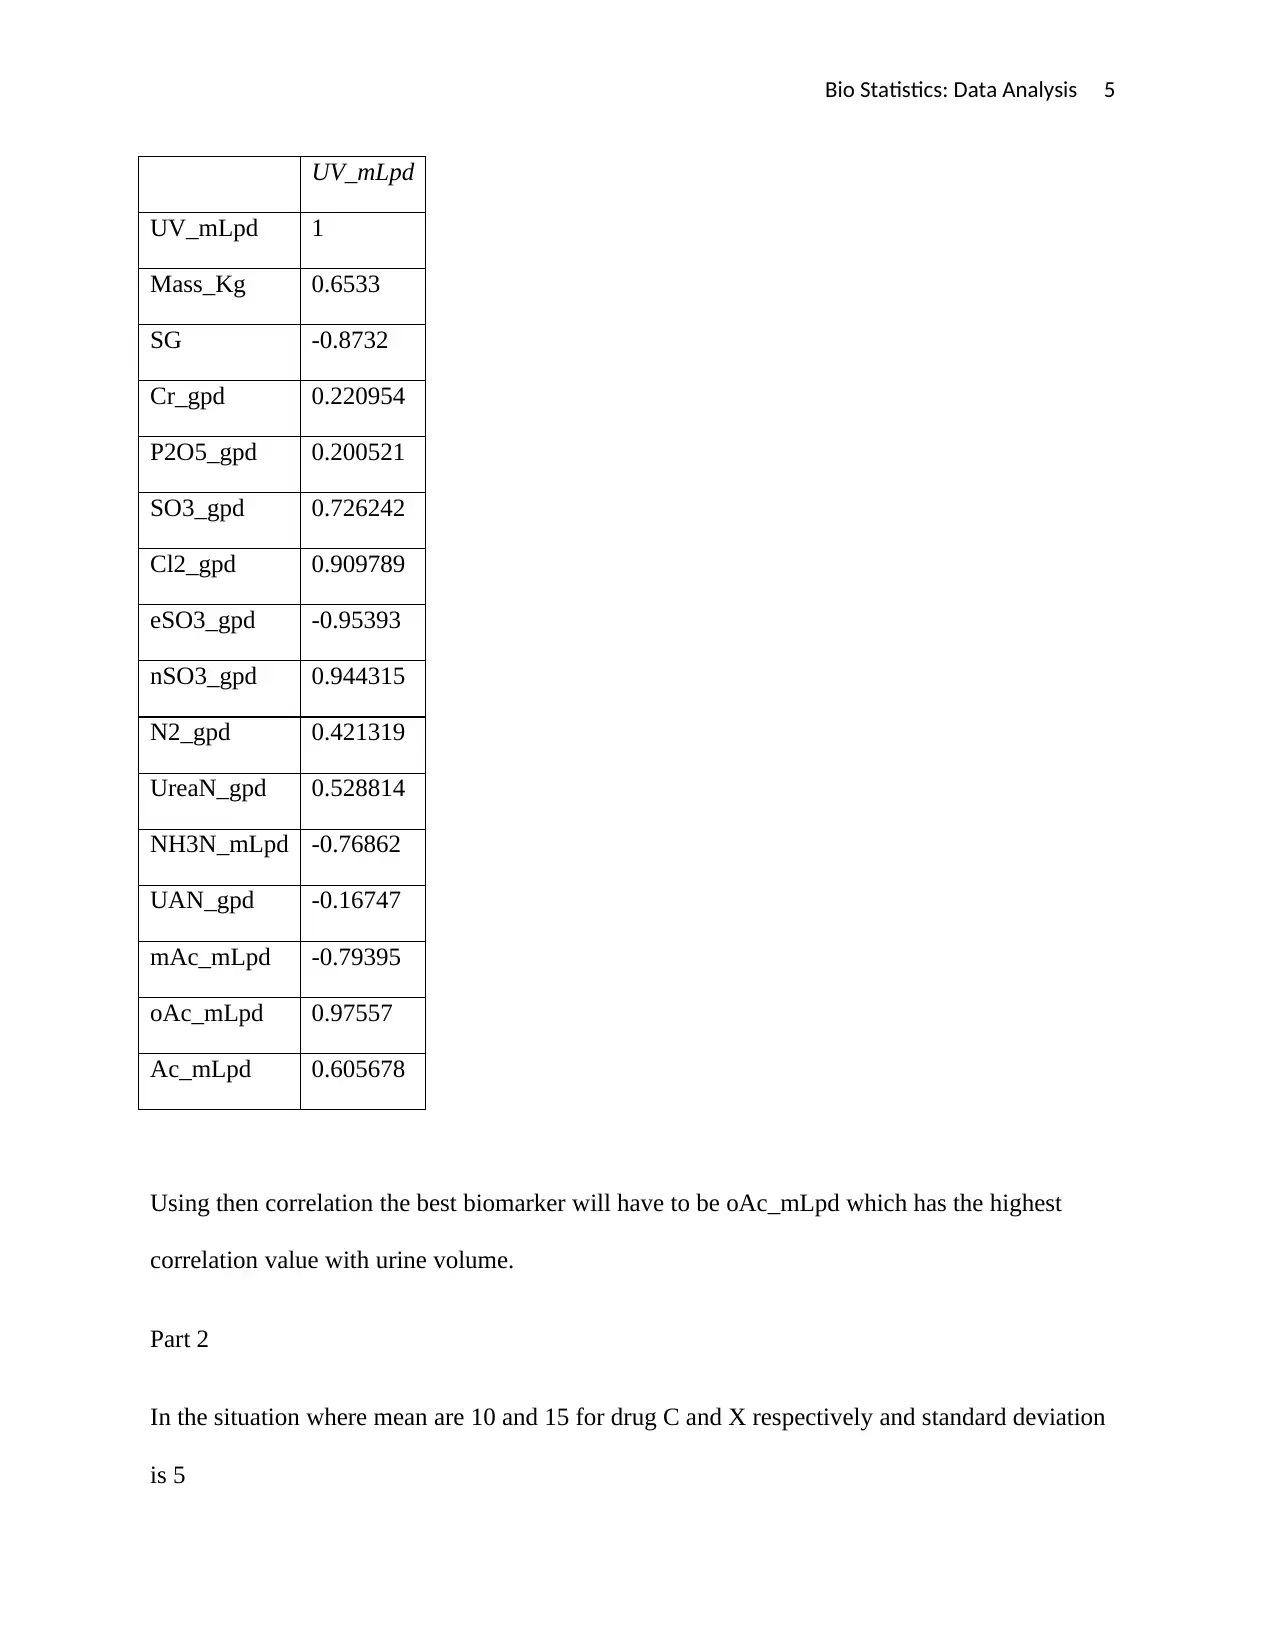
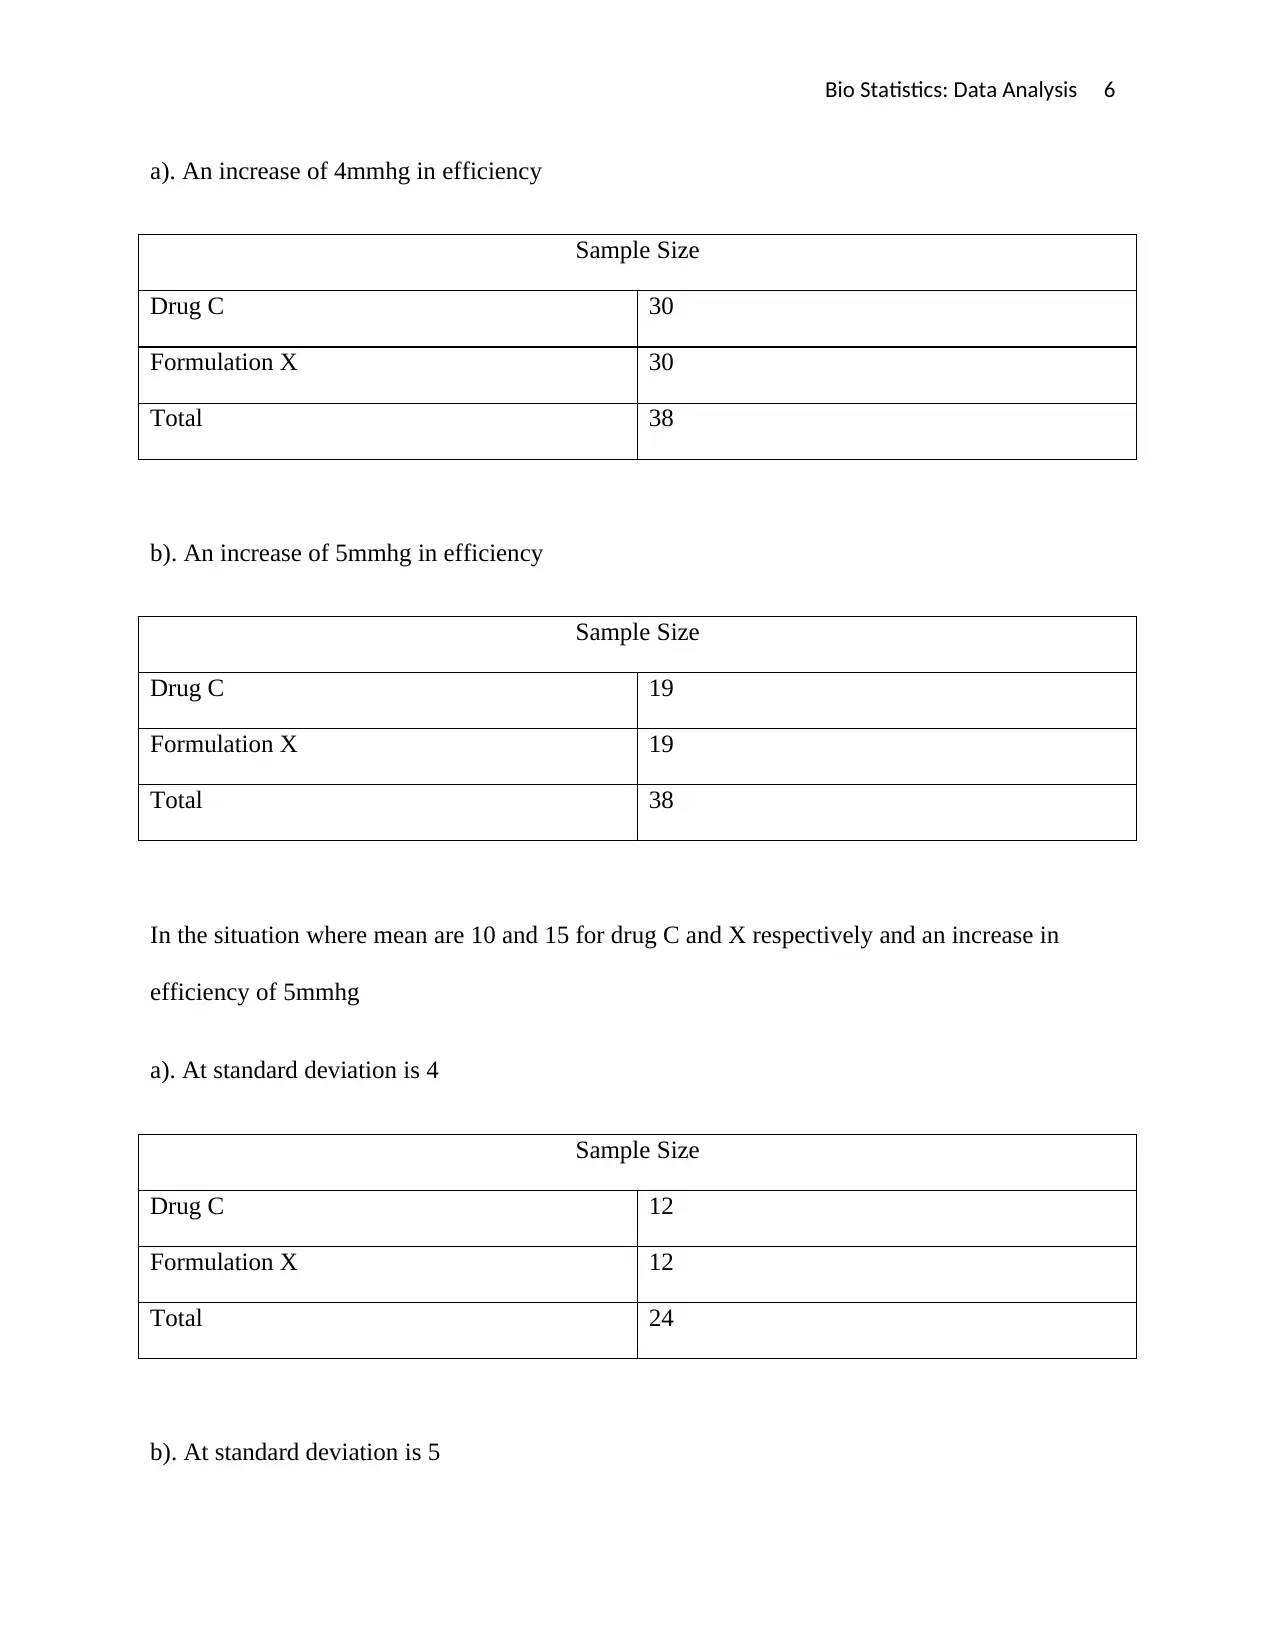
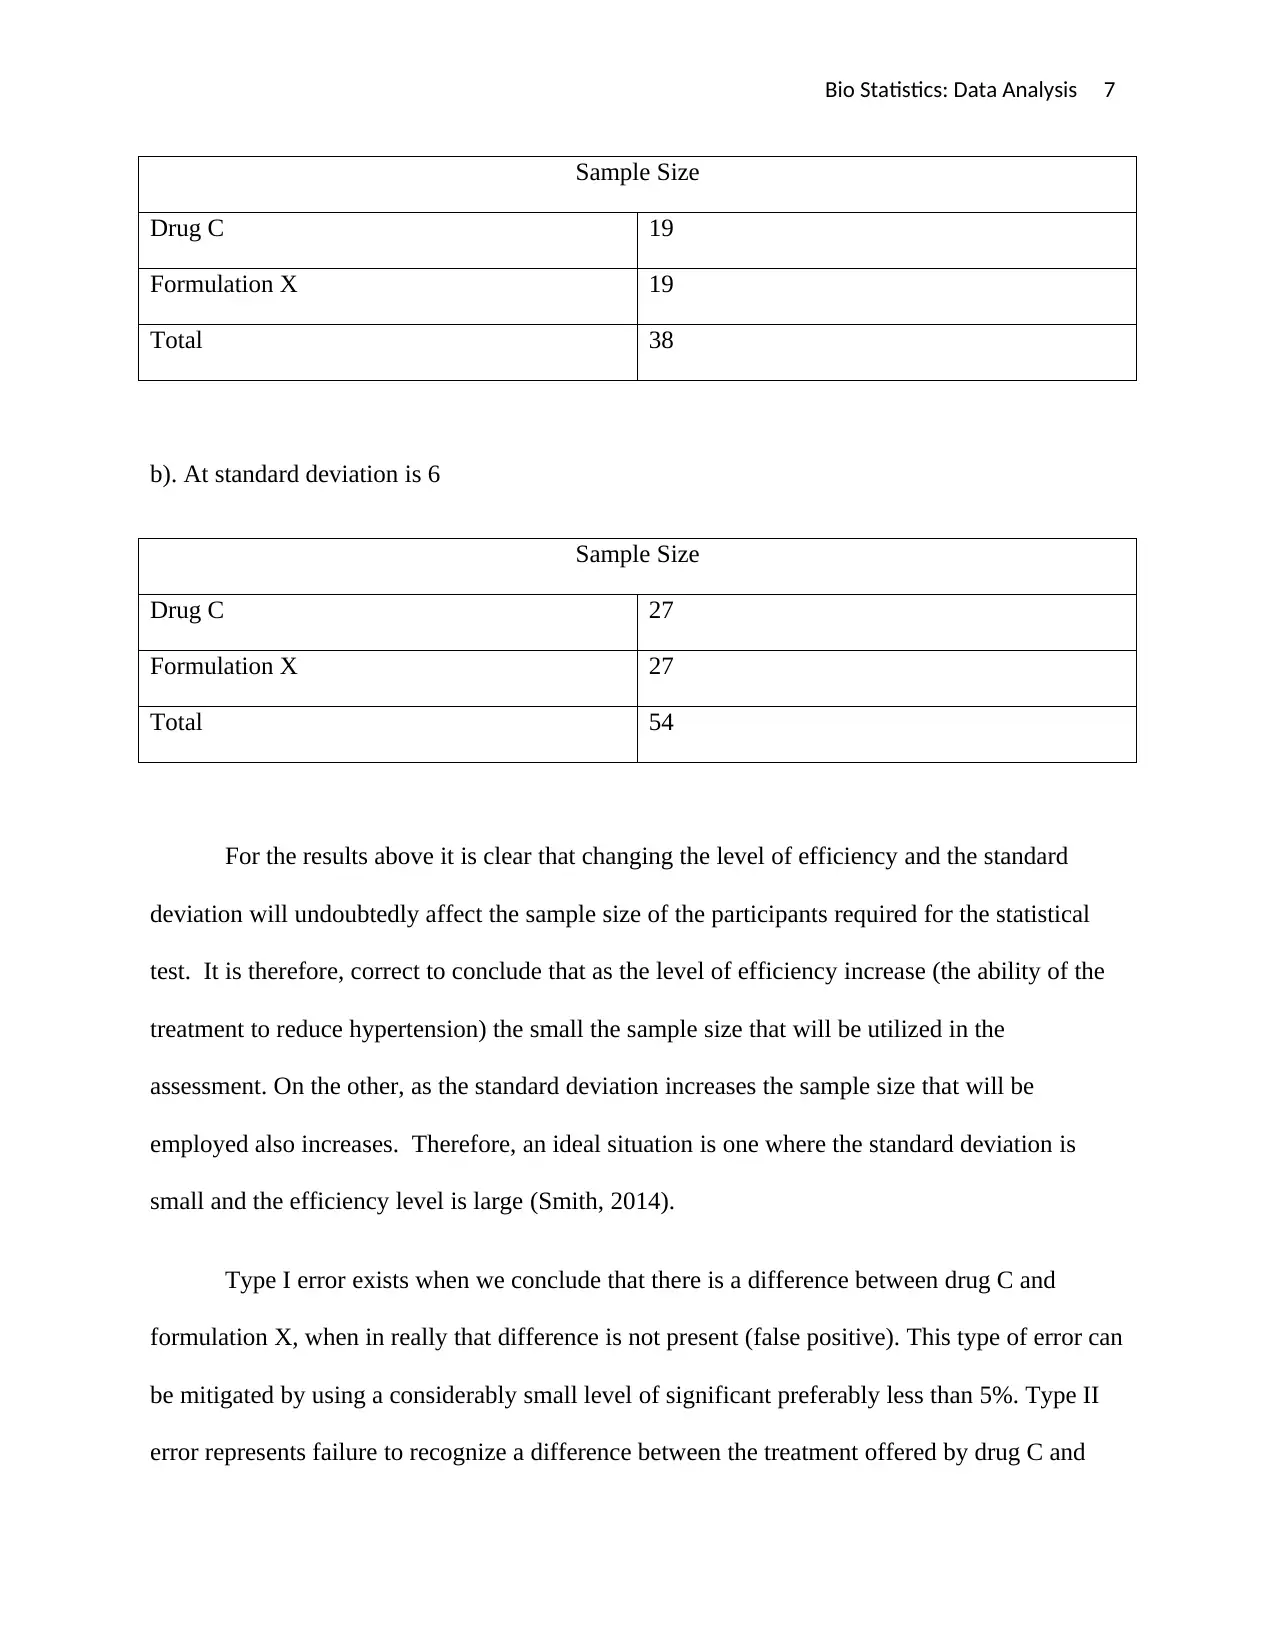
This bio statistics assignment solution provides a comprehensive analysis of data, focusing on variability assessment, ANOVA tests, and correlation analysis to identify biomarkers. The first part of the assignment examines the variability of different variables like UV_mLpd, SG, and Cr_gpd, using an ANOVA test to assess variability within and between groups. It then uses correlation analysis to determine the best biomarker for urine volume, concluding that oAc_mLpd is the most suitable. The second part of the assignment delves into sample size calculations, demonstrating how changes in efficiency levels and standard deviations affect the required sample size for statistical tests related to drug efficacy. The solution also discusses Type I and Type II errors, explaining how to mitigate them through appropriate levels of significance and statistical power. References to relevant research papers are included to support the analysis.
Document Page
Bio Statistics: Data Analysis 1
BIO STATISTICS: DATA ANALYSIS
By (Name)
The Name of the Class (Course)
Professor (Tutor)
The Name of the School (University)
The City and State where it is located
The Date
tabler-icon-diamond-filled.svg

Paraphrase This Document

Need a fresh take? Get an instant paraphrase of this document with our AI Paraphraser
Document Page
Bio Statistics: Data Analysis 2
Bio Statistics: Data Analysis
Part 1
The charts are indicated below for the various variables
1396.5625 1514.375 1321.875 1353.4375 1364.285714 1930
0
2
4
6
8
10
12
14
16
18
Parametric Variables
SG
Cr_gpd
P2O5_gp
d
SO3_gpd
Cl2_gpd
eSO3_gp
d
nSO3_gp
d
N2_gpd
UreaN_g
pd
NH3N_m
Lpd
UAN_gpd
UV_mLPd
Mean Values
Document Page
Bio Statistics: Data Analysis 3
1396.5625 1514.375 1321.875 1353.4375 1364.285714 1930
0
100
200
300
400
500
600
700
800
Parametric Variables 2
mAc_mLpd
oAc_mLpd
Ac_mLpd
UV_mLPd
Mean Values
Variability in the variable “UV_mLpd” can be considered moderately even with a single
extreme outliner observed on the 3 day that significantly influences the overall results. The
variability for SG variable is very consistent and within a small margin indicating limited
deviations in the values observed throughout the six day. The same can be said for the variable
Cr_gpd the variation is limited within a point 0.14 margin. On the other hand the variation so for
the other variables contains more than one outliner indicating inconsistence in variation form one
day to next (Heron, 2009). For the assessment of variability within and between groups by
formulating assessment based on Urine volume and any one of the other variables we will use an
Anova test with a confidence interval of 95%. For instance, the results of an Anova test
conducted Urine volume and two other variables have the following results:
Anova: Single Factor
Document Page
Bio Statistics: Data Analysis 4
SUMMARY
Groups Count Sum Average Variance
UV_mLpd 5 1608.244 321.6488 2593.61
4
SG 5 0.023413 0.004683 1.49E-06
Cr_gpd 5 1.287963 0.257593 0.00511
ANOVA
Source of
Variation
SS df MS F P-
value
F crit
Between
Groups
344579 2 172289.5 199.284
6
6.23E-
10
3.885294
Within Groups 10374.4
8
12 864.5398
Total 354953.
4
14
In this situation, a biomarker is a naturally occurring characteristic that can be used to identify a
particular pathological process or condition. The use of correlation analysis will aid with
selection of the most suitable variable parameter to be used as a biomarker.
Correlation results for Mean
tabler-icon-diamond-filled.svg

Paraphrase This Document

Need a fresh take? Get an instant paraphrase of this document with our AI Paraphraser
Document Page
Bio Statistics: Data Analysis 5
UV_mLpd
UV_mLpd 1
Mass_Kg 0.6533
SG -0.8732
Cr_gpd 0.220954
P2O5_gpd 0.200521
SO3_gpd 0.726242
Cl2_gpd 0.909789
eSO3_gpd -0.95393
nSO3_gpd 0.944315
N2_gpd 0.421319
UreaN_gpd 0.528814
NH3N_mLpd -0.76862
UAN_gpd -0.16747
mAc_mLpd -0.79395
oAc_mLpd 0.97557
Ac_mLpd 0.605678
Using then correlation the best biomarker will have to be oAc_mLpd which has the highest
correlation value with urine volume.
Part 2
In the situation where mean are 10 and 15 for drug C and X respectively and standard deviation
is 5
Document Page
Bio Statistics: Data Analysis 6
a). An increase of 4mmhg in efficiency
Sample Size
Drug C 30
Formulation X 30
Total 38
b). An increase of 5mmhg in efficiency
Sample Size
Drug C 19
Formulation X 19
Total 38
In the situation where mean are 10 and 15 for drug C and X respectively and an increase in
efficiency of 5mmhg
a). At standard deviation is 4
Sample Size
Drug C 12
Formulation X 12
Total 24
b). At standard deviation is 5
Document Page
Bio Statistics: Data Analysis 7
Sample Size
Drug C 19
Formulation X 19
Total 38
b). At standard deviation is 6
Sample Size
Drug C 27
Formulation X 27
Total 54
For the results above it is clear that changing the level of efficiency and the standard
deviation will undoubtedly affect the sample size of the participants required for the statistical
test. It is therefore, correct to conclude that as the level of efficiency increase (the ability of the
treatment to reduce hypertension) the small the sample size that will be utilized in the
assessment. On the other, as the standard deviation increases the sample size that will be
employed also increases. Therefore, an ideal situation is one where the standard deviation is
small and the efficiency level is large (Smith, 2014).
Type I error exists when we conclude that there is a difference between drug C and
formulation X, when in really that difference is not present (false positive). This type of error can
be mitigated by using a considerably small level of significant preferably less than 5%. Type II
error represents failure to recognize a difference between the treatment offered by drug C and
tabler-icon-diamond-filled.svg

Paraphrase This Document

Need a fresh take? Get an instant paraphrase of this document with our AI Paraphraser
Document Page
Bio Statistics: Data Analysis 8
formulation X (false negative). A type II error can be reduced by ensuring the statistical power
is greater than or equal to 95% (Charan & Biswas, 2013).
chevron_up_icon
1 out of 8
circle_padding
hide_on_mobile
zoom_out_icon
[object Object]