Ask a question from expert
Bio statistics manuscript | Descriptive statistics
60 Pages6295 Words275 Views
Added on 2020-01-07
Bio statistics manuscript | Descriptive statistics
Added on 2020-01-07
BookmarkShareRelated Documents
Bio statistics manuscript TASK 1 1
TABLE OF CONTENTS1....................................................................................................................................................................................................................2a. Mean, standard deviation, minimum and maximum values for age ...................................................................................................2b. Frequency (% and number) of students in each of new age categories...............................................................................................22. ..................................................................................................................................................................................................................3Descriptive statistics for demographic information ................................................................................................................................33....................................................................................................................................................................................................................3Mean for aggression, thrill seeking and risk acceptance differing from various demographics.............................................................34....................................................................................................................................................................................................................9In terms of depression is there difference among depressed and not depressed group in accordance with following............................95..................................................................................................................................................................................................................10RTA once crash as dependent variable performing binary logistic regression.....................................................................................106..................................................................................................................................................................................................................20Obesity as dependent variable performing binary logistic regression ..................................................................................................202

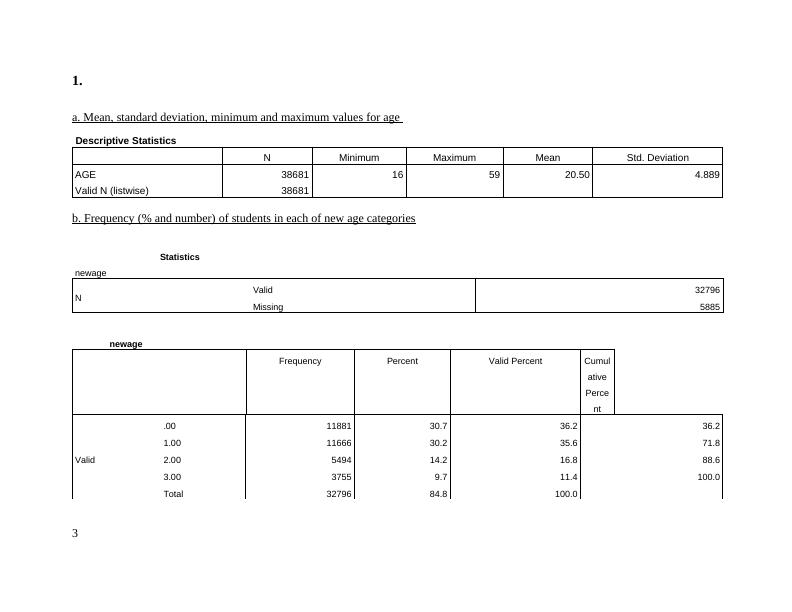
1.a. Mean, standard deviation, minimum and maximum values for age Descriptive StatisticsNMinimumMaximumMeanStd. DeviationAGE38681165920.504.889Valid N (listwise)38681b. Frequency (% and number) of students in each of new age categoriesStatisticsnewageNValid32796Missing5885newageFrequencyPercentValid PercentCumulativePercentValid.001188130.736.236.21.001166630.235.671.82.00549414.216.888.63.0037559.711.4100.0Total3279684.8100.03
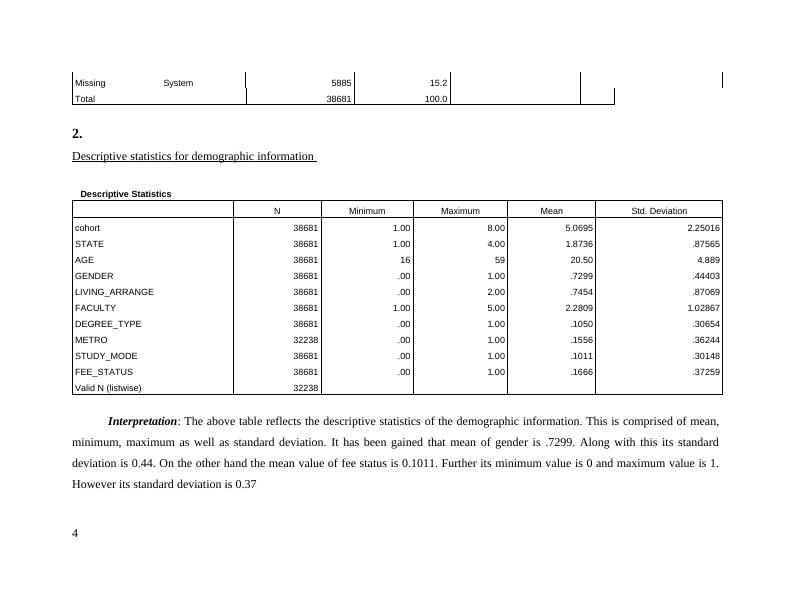
MissingSystem588515.2Total38681100.02. Descriptive statistics for demographic information Descriptive StatisticsNMinimumMaximumMeanStd. Deviationcohort386811.008.005.06952.25016STATE386811.004.001.8736.87565AGE38681165920.504.889GENDER38681.001.00.7299.44403LIVING_ARRANGE38681.002.00.7454.87069FACULTY386811.005.002.28091.02867DEGREE_TYPE38681.001.00.1050.30654METRO32238.001.00.1556.36244STUDY_MODE38681.001.00.1011.30148FEE_STATUS38681.001.00.1666.37259Valid N (listwise)32238Interpretation: The above table reflects the descriptive statistics of the demographic information. This is comprised of mean,minimum, maximum as well as standard deviation. It has been gained that mean of gender is .7299. Along with this its standarddeviation is 0.44. On the other hand the mean value of fee status is 0.1011. Further its minimum value is 0 and maximum value is 1.However its standard deviation is 0.374
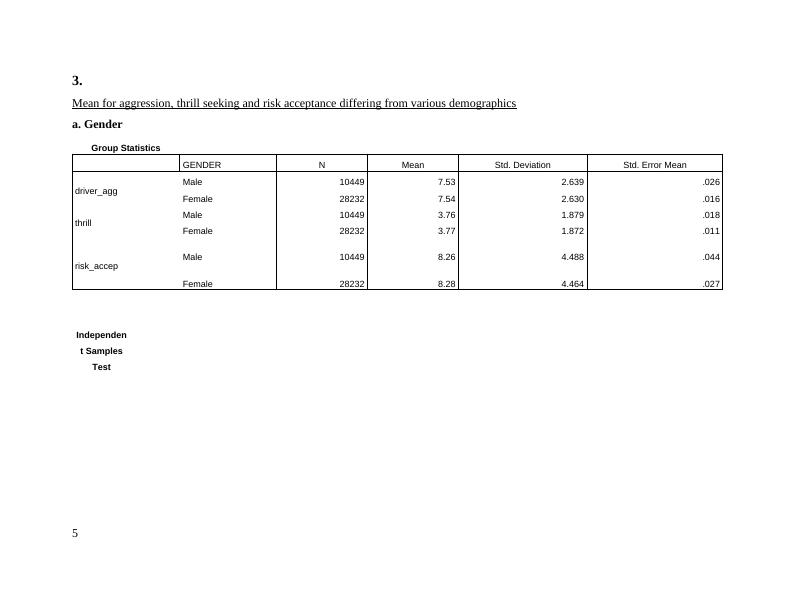
3.Mean for aggression, thrill seeking and risk acceptance differing from various demographicsa. Gender Group StatisticsGENDERNMeanStd. DeviationStd. Error Meandriver_aggMale104497.532.639.026Female282327.542.630.016thrillMale104493.761.879.018Female282323.771.872.011risk_accepMale104498.264.488.044Female282328.284.464.027Independent SamplesTest5
Levene's Test for Equalityof Variancest-testforEqualityofMeansFSig.tdfSig. (2-tailed)MeanDifferenceStd. ErrorDifference95% Confidence Interval ofthe Difference6
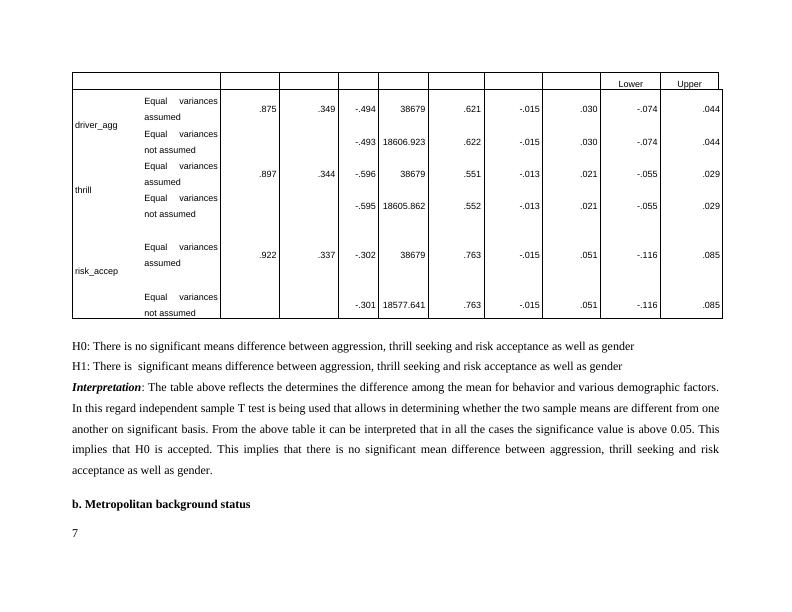
LowerUpperdriver_aggEqual variancesassumed.875.349-.49438679.621-.015.030-.074.044Equal variancesnot assumed-.49318606.923.622-.015.030-.074.044thrillEqual variancesassumed.897.344-.59638679.551-.013.021-.055.029Equal variancesnot assumed-.59518605.862.552-.013.021-.055.029risk_accepEqual variancesassumed.922.337-.30238679.763-.015.051-.116.085Equal variancesnot assumed-.30118577.641.763-.015.051-.116.085H0: There is no significant means difference between aggression, thrill seeking and risk acceptance as well as genderH1: There is significant means difference between aggression, thrill seeking and risk acceptance as well as genderInterpretation: The table above reflects the determines the difference among the mean for behavior and various demographic factors.In this regard independent sample T test is being used that allows in determining whether the two sample means are different from oneanother on significant basis. From the above table it can be interpreted that in all the cases the significance value is above 0.05. Thisimplies that H0 is accepted. This implies that there is no significant mean difference between aggression, thrill seeking and riskacceptance as well as gender. b. Metropolitan background status 7
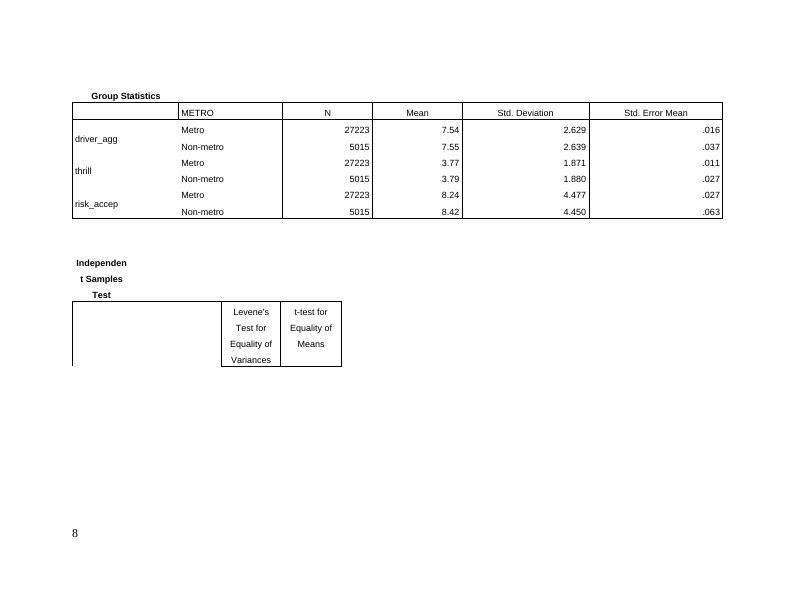
Group StatisticsMETRONMeanStd. DeviationStd. Error Meandriver_aggMetro272237.542.629.016Non-metro50157.552.639.037thrillMetro272233.771.871.011Non-metro50153.791.880.027risk_accepMetro272238.244.477.027Non-metro50158.424.450.063Independent SamplesTestLevene'sTest forEquality ofVariancest-test forEquality ofMeans8
End of preview
Want to access all the pages? Upload your documents or become a member.
Related Documents
Data Analysis: Descriptive Statistics and Tests for Mean Differenceslg...
|15
|2791
|155
Analysis of Dataset in Biostatisticslg...
|23
|4406
|97
Difference in Mean Aggression, Thrill Seeking, and Risk Accepting between Genders, Metropolitan Backgrounds, and Study Modeslg...
|16
|2947
|51
Test for Difference in Mean Aggression, Thrill Seeking, and Risk Acceptinglg...
|19
|3679
|60
Difference in Mean Aggression, Thrill Seeking, and Risk Accepting between Genders, Metropolitan Backgrounds, and Study Modeslg...
|16
|2232
|87
Difference in Mean Aggression, Thrill Seeking, and Risk Accepting between Genders, Metropolitan Backgrounds, and Study Modeslg...
|15
|2774
|55