Biochemical Analysis of Blood: Protein, Albumin, and Bilirubin Levels
VerifiedAdded on 2023/05/30
|13
|2493
|360
AI Summary
This experiment aims to find out the relationship between the protein and albumin content and their significance in the body. The methods used for this experiment was albumin by bromocresol green binding (38-50gl-1), total protein by biuret method (60-880gl-1), bilirubin-direct <7um, and biuret total between 2 to 20um.
Contribute Materials
Your contribution can guide someone’s learning journey. Share your
documents today.

Biochemical analysis of blood1
BIOCHEMICAL ANALYSIS OF BLOOD
Name:
Department:
School:
Date:
BIOCHEMICAL ANALYSIS OF BLOOD
Name:
Department:
School:
Date:
Secure Best Marks with AI Grader
Need help grading? Try our AI Grader for instant feedback on your assignments.
Biochemical analysis of blood 2
Abstract
Blood comprises of cells and cellular bits that are suspended in a liquid medium. The liquid can
be either plasma or the serum relying upon treating after a specimen has been taken. Several
methods exist in an examination of the protein and albumin content in the blood sample. This
experiment aims to find out the relationship between the protein and albumin content and their
significance in the body. The methods used for this experiment was albumin by bromocresol
green binding (38-50gl-1), total protein by biuret method (60-880gl-1), bilirubin-direct <7um, and
biuret total between 2 to 20um. The results of patients showed lower protein concentration and a
higher concentration of the bilirubin-direct. Patient 2 showed extremely high concentration of
bilirubin, demonstrating the conclusion of the unconjugated Hyperbilirubinemia. Therefore, the
experiments result matched with the literature review of the topic.
Biochemical analysis of blood 3
Introduction
Active portions isolated by a preparative fractionation action may be exposed to a number of
investigative fractionation routines to assess their concentration. In an investigative fractionation,
thus, a trivial amount of trial is forgone to gain info about the situation of concentration of the
materials being examined (Zelig et al. 2015). Of the several physicochemical methods which
have backed the awareness of proteins and nucleic acids, electrophoretic approaches fill a rank of
a primary significance (Bier 2013). Electrophoresis discovers its highest importance in the
examination of blends and in the purity resolve, even though certain forms of electrophoresis
may be applied on a preparative measure (Bier 2013). Normally, blood comprises cells and
cellular bits are suspended in a liquid medium. The serum is obtained when the blood is
detached from the movement and permitted to clot whereas plasma is when the blood is stopped
from clotting by use of anticoagulants. Blood trials must be done on the precise sample that
permits analytes measurement without interferences from additives utilised to avert clotting
(Mamun et al. 2013). Generally, quality control denotes to the routine of identifying an
investigative error within the laboratory to make sure both the accuracy and reliability of trial
result to offer the best probable patient attention. Unpredictable performance can result in
misdiagnosis, late cure and augmented charges due to retesting (Mamun et al. 2013). Thus, of
great significance is to warrant all results offered to be both reliable and accurate. In clinical
trials, changes may happen in one, numerous or all plasma protein portions and this variation
may not considerably affect the entire protein level (Bhat, Wadhwa, Singh and Singh 2013).
Biochemical analysis of blood 4
Aim of experiment
First, to perform a total protein to a patient’s sample using the biuret technique that measures the
colour created when copper reacts with a peptide link. The colour development intensity is
directly proportionate to the number of peptide links involved in the reaction.
Second, to determine the albumin level to a patient using an anionic color bromocresol green
(BCG). Measurement of soluble bilirubin can be done directly by joining to diazotized
sulphanilic acid to create a red substance (direct bilirubin).
Third, the experiment aim to find the bilirubin-total and bilirubin-direct in the patient, evaluated
when bilirubin is released from albumin by reaction with caffeine benzoate (Bhat, Wadhwa,
Singh and Singh 2013).
Methods
The approaches utilised were as defined in the timetable with the following particulars.
Serum protein electrophoresis was done by first making note of the control name, allocation
number and expiry date. Tank was prepared by putting barbital buffer in the two reservoirs. The
cellulose acetate paper strips soaked in barbital buffer were removed from tank using forceps.
Using the applicator, the control and patient samples were applied to the cellulose acetate strip
about cm from the cathode end. The strips were placed into the tank and current adjusted to
provide 2.0mA per strip. After 90 minutes the power supply was turned off. Strips were removed
from the tank and allowed to dry.
Secure Best Marks with AI Grader
Need help grading? Try our AI Grader for instant feedback on your assignments.
Biochemical analysis of blood 5
Patient samples and QC trials were prepared in the total protein by biuret method. The solution
was mixed thoroughly and established for 30 minutes and finally examined at the absorbance
wavelength of 550nm.
Albumin determination by bromocresol green binding was performed by running the patient and
QC samples in identical and mixed carefully and incubated for 10 minutes. The
spectrophotometer was adjusted to absorbance of zero with a blank at a wavelength of 628nm.
Finally, bilirubin-jendrassik and Grof method was done with QC and patient samples in
duplicate. The samples were mixed systematically and incubated at room temperature for 10
minutes. The absorbance of the samples was read at a wavelength of 607nm against water as
zero blank
Biochemical analysis of blood 6
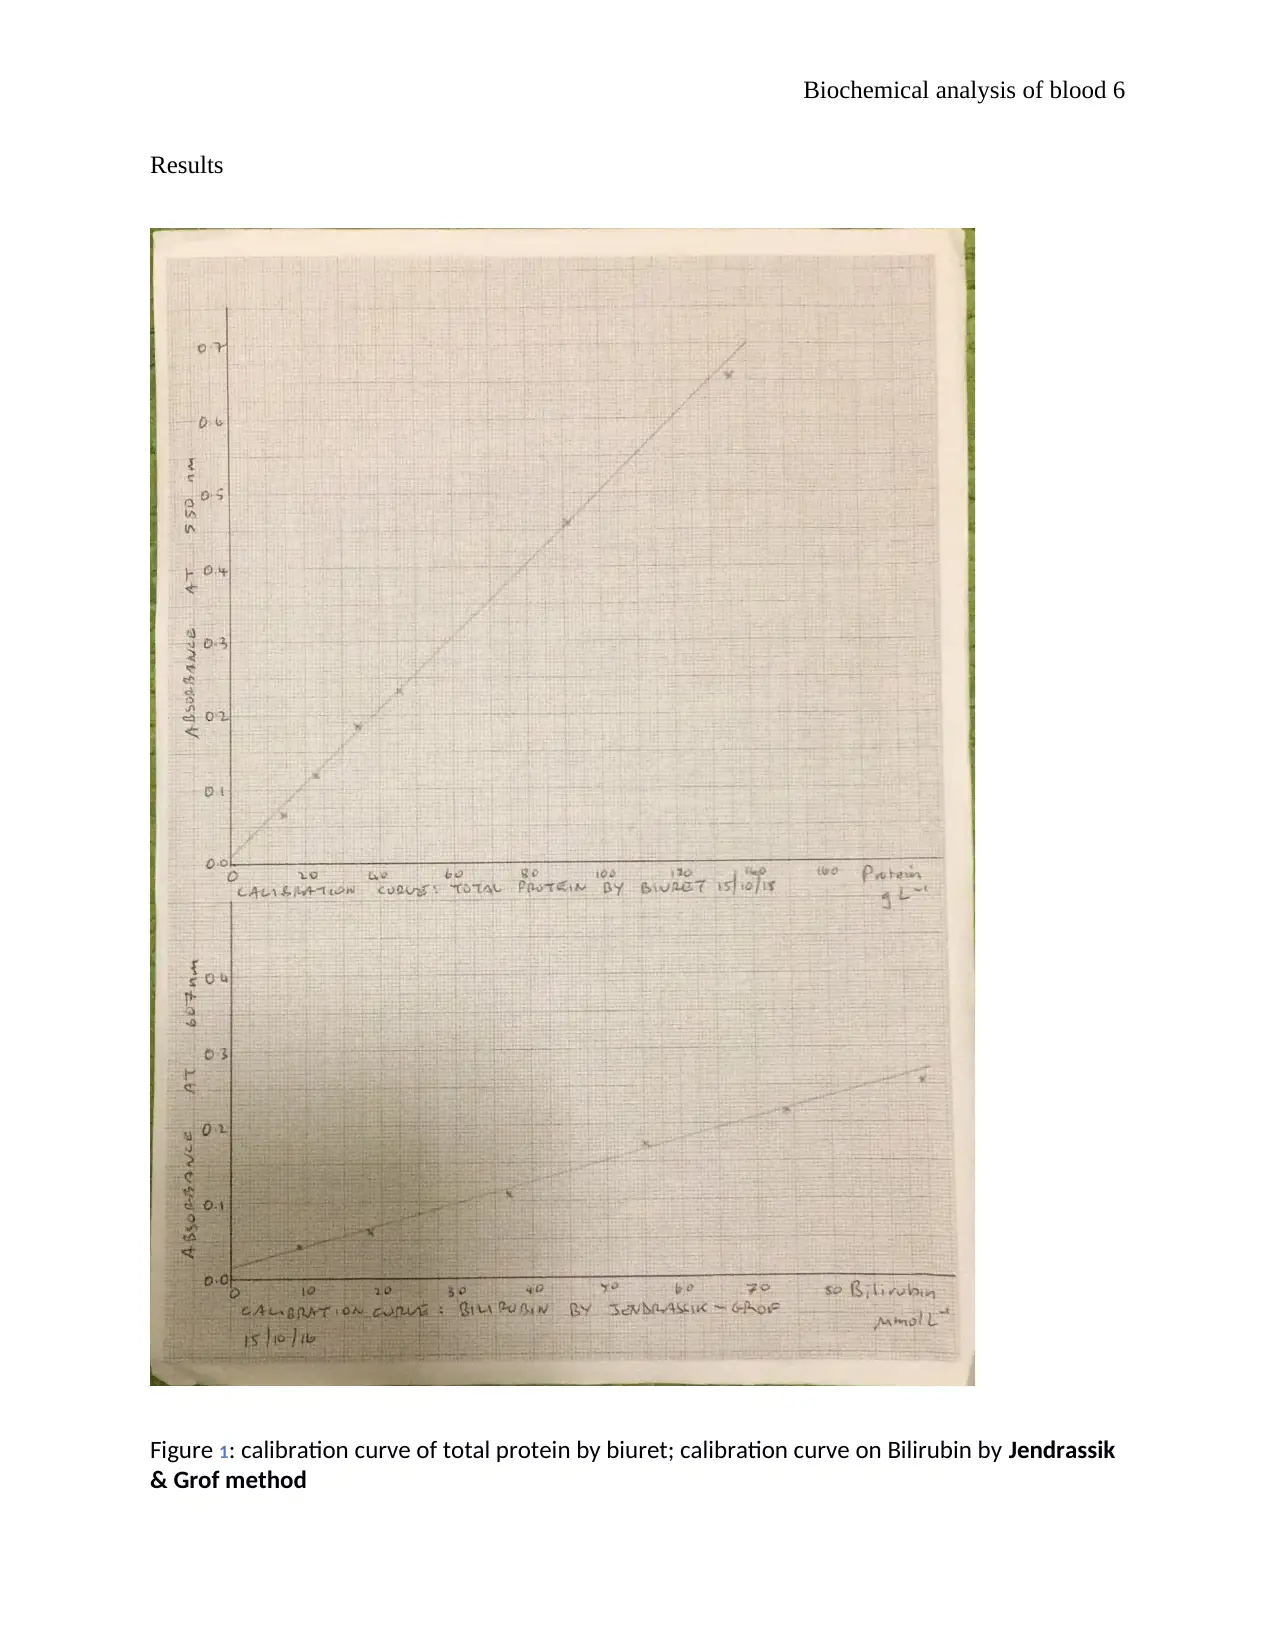
Results
Figure 1: calibration curve of total protein by biuret; calibration curve on Bilirubin by Jendrassik
& Grof method
Results
Figure 1: calibration curve of total protein by biuret; calibration curve on Bilirubin by Jendrassik
& Grof method
Biochemical analysis of blood 7
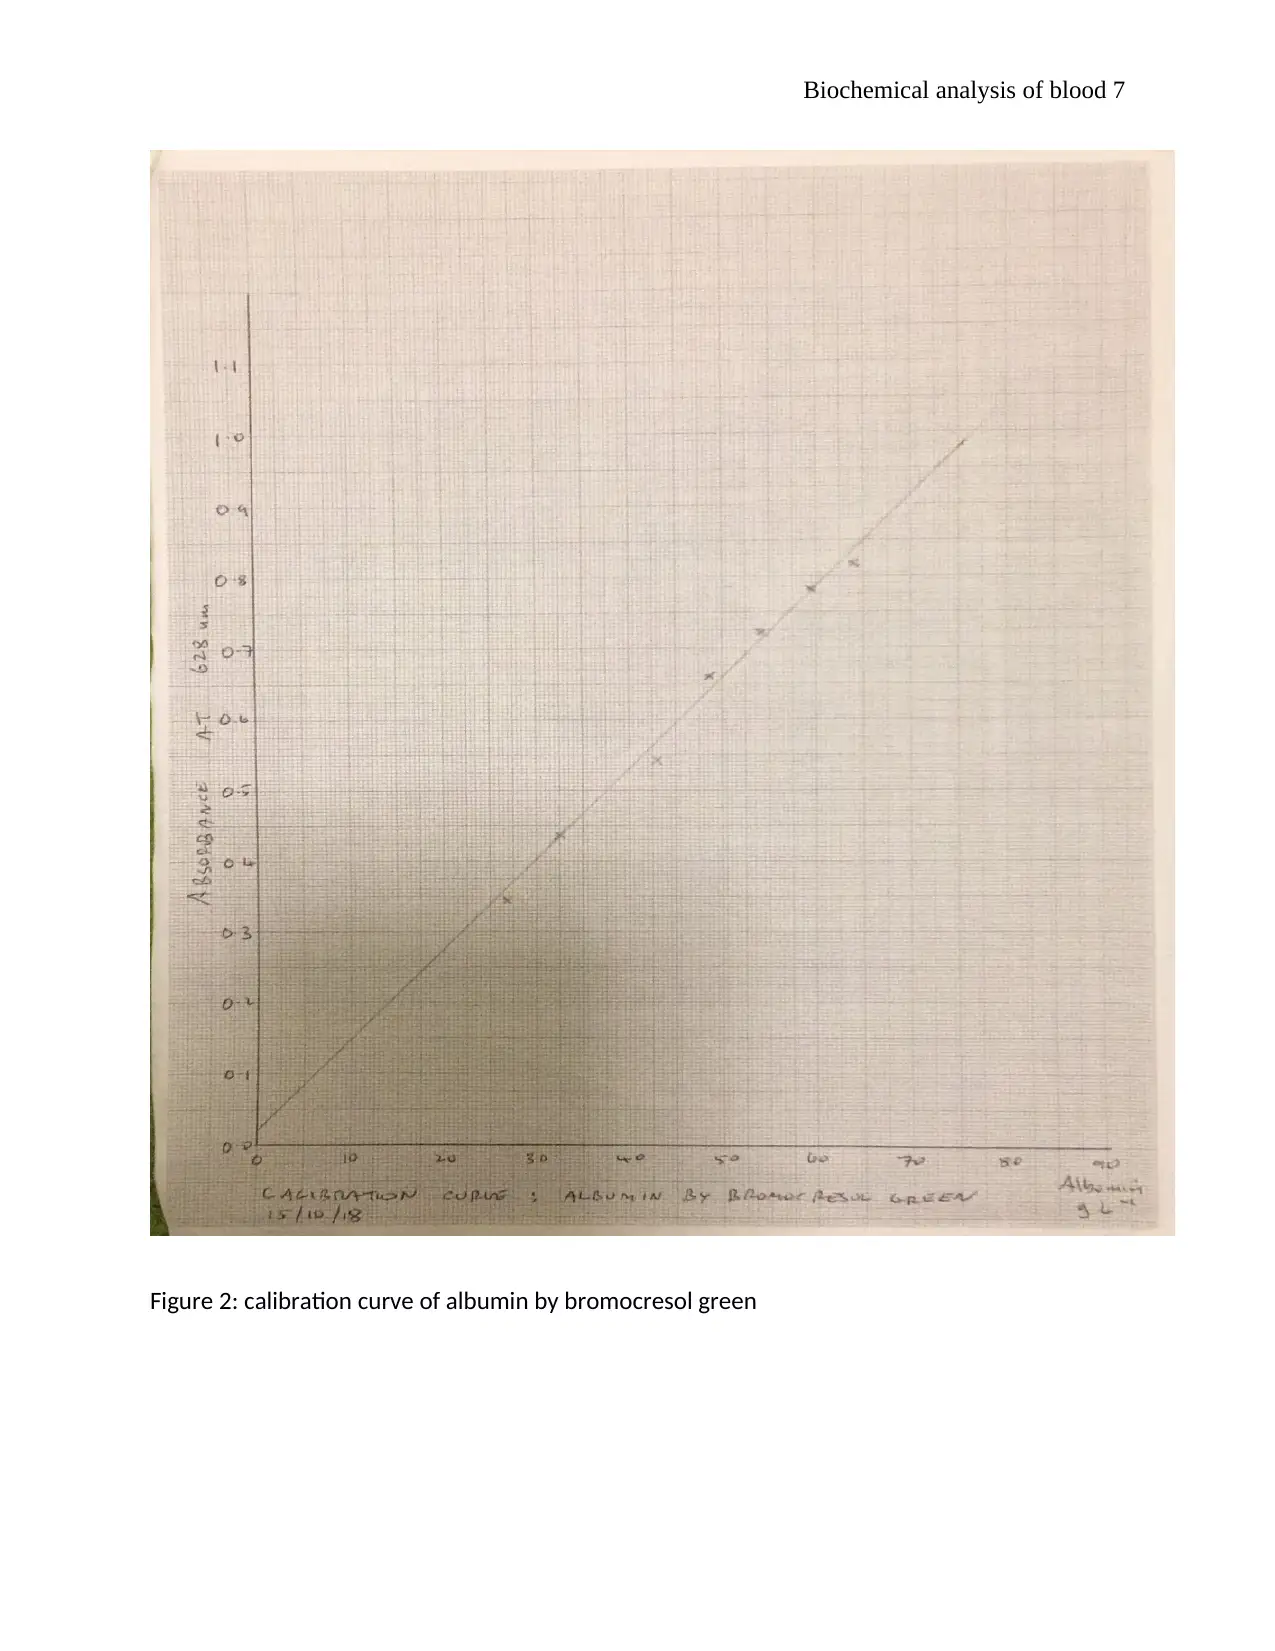
Figure 2: calibration curve of albumin by bromocresol green
Figure 2: calibration curve of albumin by bromocresol green
Paraphrase This Document
Need a fresh take? Get an instant paraphrase of this document with our AI Paraphraser
Biochemical analysis of blood 8
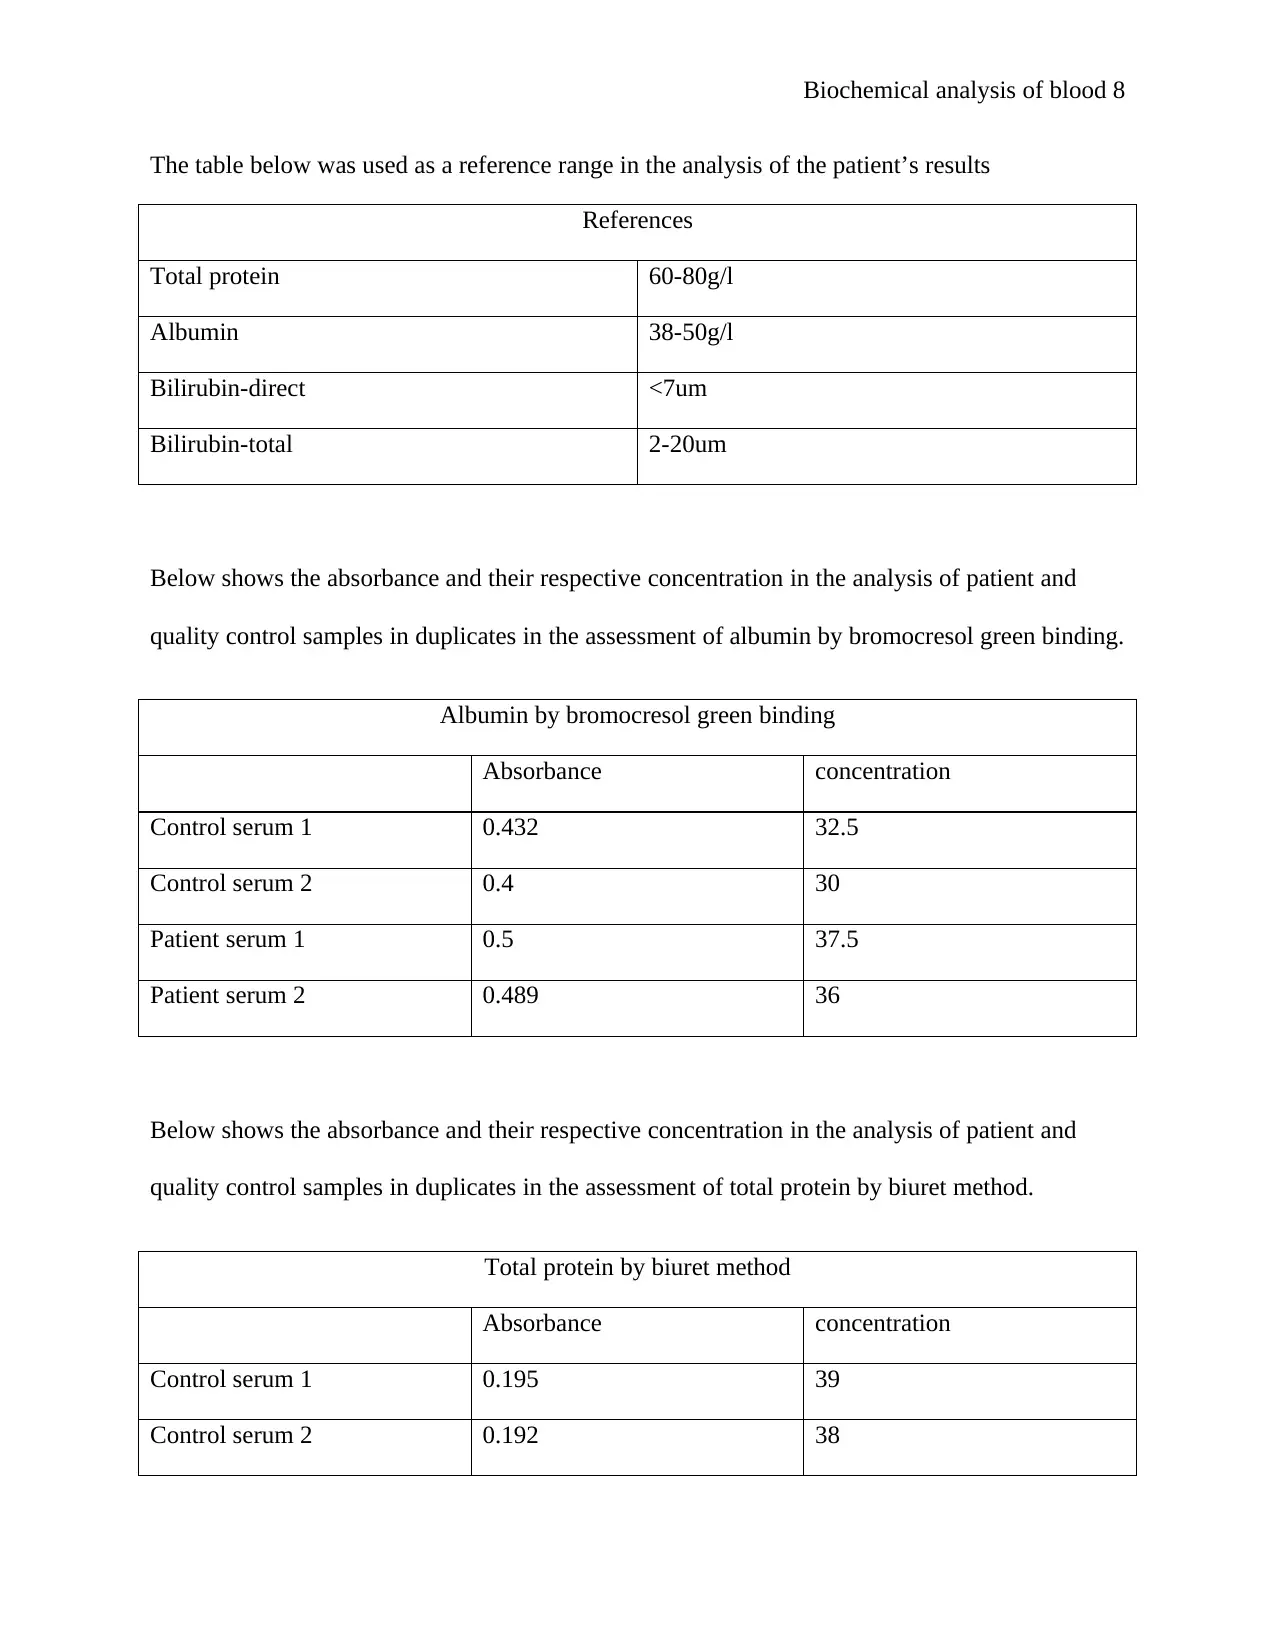
The table below was used as a reference range in the analysis of the patient’s results
References
Total protein 60-80g/l
Albumin 38-50g/l
Bilirubin-direct <7um
Bilirubin-total 2-20um
Below shows the absorbance and their respective concentration in the analysis of patient and
quality control samples in duplicates in the assessment of albumin by bromocresol green binding.
Albumin by bromocresol green binding
Absorbance concentration
Control serum 1 0.432 32.5
Control serum 2 0.4 30
Patient serum 1 0.5 37.5
Patient serum 2 0.489 36
Below shows the absorbance and their respective concentration in the analysis of patient and
quality control samples in duplicates in the assessment of total protein by biuret method.
Total protein by biuret method
Absorbance concentration
Control serum 1 0.195 39
Control serum 2 0.192 38
Biochemical analysis of blood 9
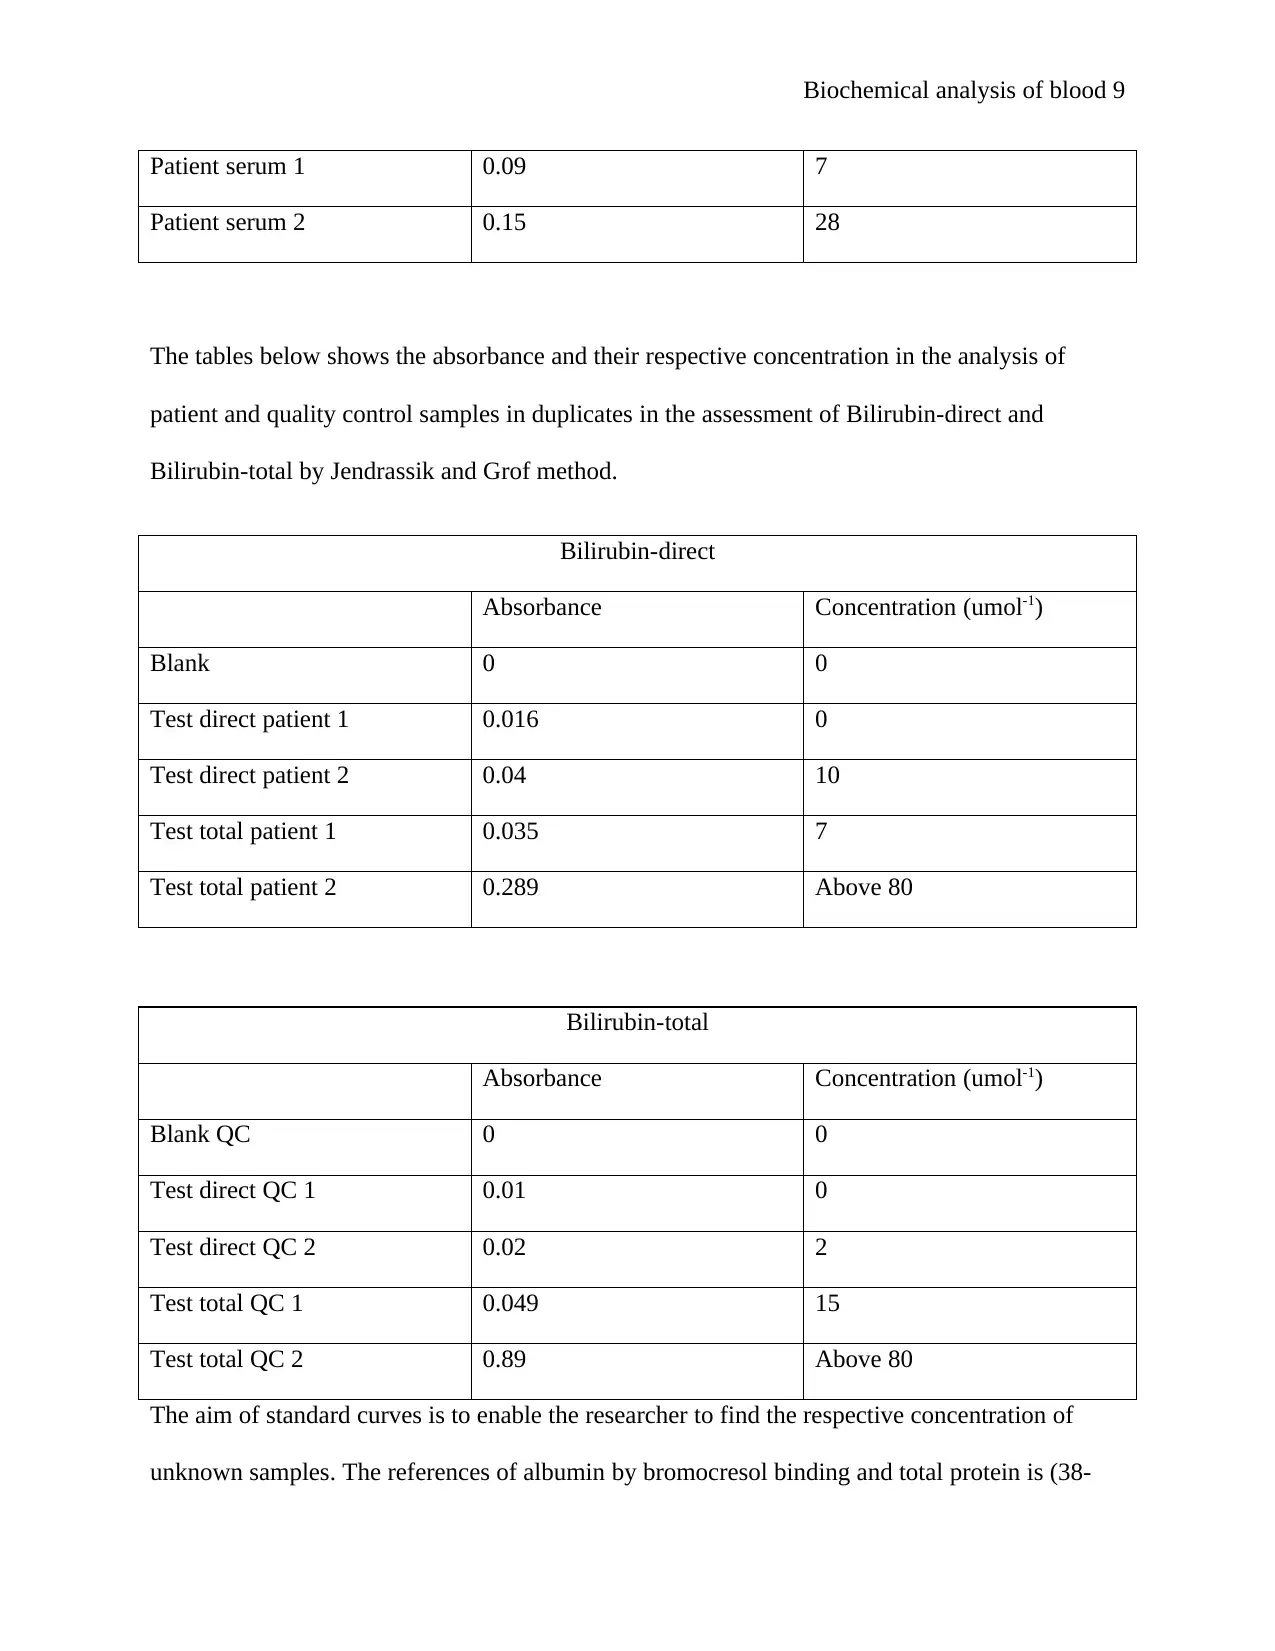
Patient serum 1 0.09 7
Patient serum 2 0.15 28
The tables below shows the absorbance and their respective concentration in the analysis of
patient and quality control samples in duplicates in the assessment of Bilirubin-direct and
Bilirubin-total by Jendrassik and Grof method.
Bilirubin-direct
Absorbance Concentration (umol-1)
Blank 0 0
Test direct patient 1 0.016 0
Test direct patient 2 0.04 10
Test total patient 1 0.035 7
Test total patient 2 0.289 Above 80
Bilirubin-total
Absorbance Concentration (umol-1)
Blank QC 0 0
Test direct QC 1 0.01 0
Test direct QC 2 0.02 2
Test total QC 1 0.049 15
Test total QC 2 0.89 Above 80
The aim of standard curves is to enable the researcher to find the respective concentration of
unknown samples. The references of albumin by bromocresol binding and total protein is (38-
Biochemical analysis of blood 10
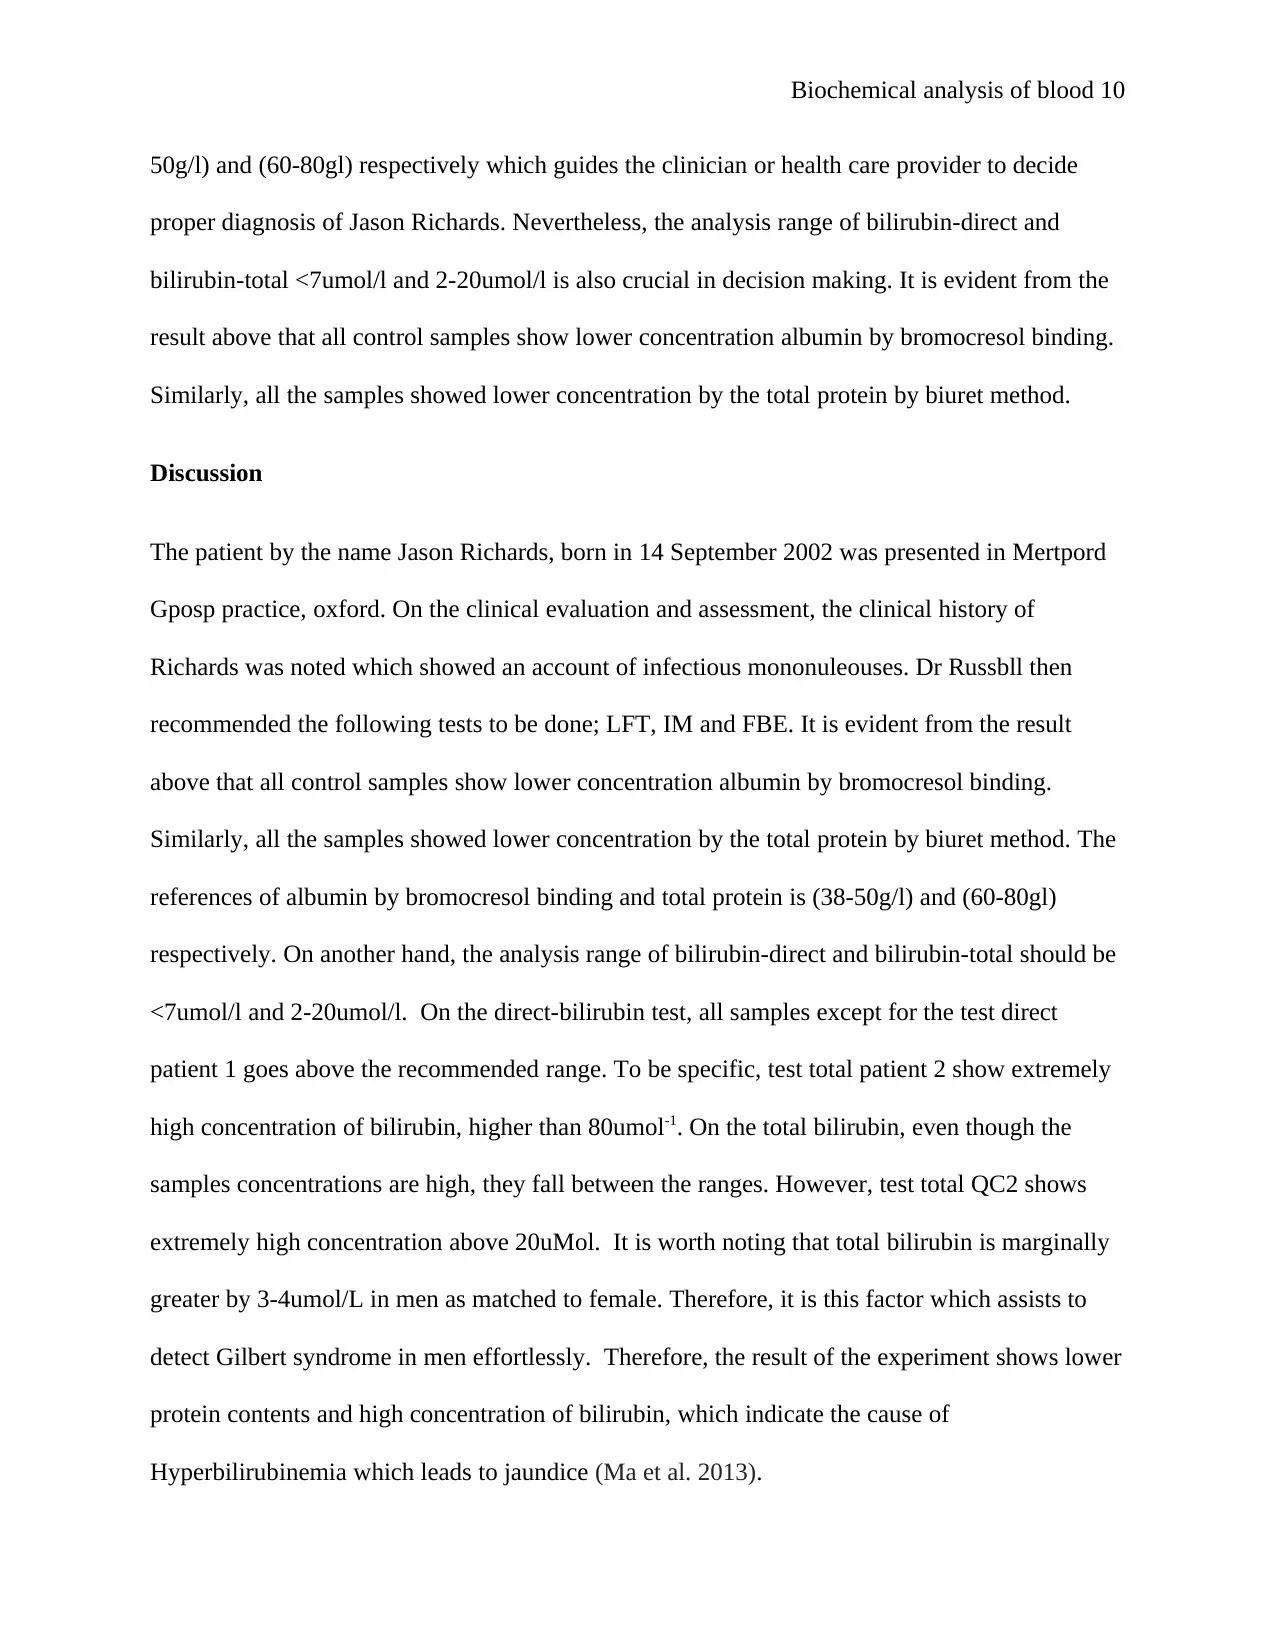
50g/l) and (60-80gl) respectively which guides the clinician or health care provider to decide
proper diagnosis of Jason Richards. Nevertheless, the analysis range of bilirubin-direct and
bilirubin-total <7umol/l and 2-20umol/l is also crucial in decision making. It is evident from the
result above that all control samples show lower concentration albumin by bromocresol binding.
Similarly, all the samples showed lower concentration by the total protein by biuret method.
Discussion
The patient by the name Jason Richards, born in 14 September 2002 was presented in Mertpord
Gposp practice, oxford. On the clinical evaluation and assessment, the clinical history of
Richards was noted which showed an account of infectious mononuleouses. Dr Russbll then
recommended the following tests to be done; LFT, IM and FBE. It is evident from the result
above that all control samples show lower concentration albumin by bromocresol binding.
Similarly, all the samples showed lower concentration by the total protein by biuret method. The
references of albumin by bromocresol binding and total protein is (38-50g/l) and (60-80gl)
respectively. On another hand, the analysis range of bilirubin-direct and bilirubin-total should be
<7umol/l and 2-20umol/l. On the direct-bilirubin test, all samples except for the test direct
patient 1 goes above the recommended range. To be specific, test total patient 2 show extremely
high concentration of bilirubin, higher than 80umol-1. On the total bilirubin, even though the
samples concentrations are high, they fall between the ranges. However, test total QC2 shows
extremely high concentration above 20uMol. It is worth noting that total bilirubin is marginally
greater by 3-4umol/L in men as matched to female. Therefore, it is this factor which assists to
detect Gilbert syndrome in men effortlessly. Therefore, the result of the experiment shows lower
protein contents and high concentration of bilirubin, which indicate the cause of
Hyperbilirubinemia which leads to jaundice (Ma et al. 2013).
Secure Best Marks with AI Grader
Need help grading? Try our AI Grader for instant feedback on your assignments.
Biochemical analysis of blood 11
In the case of liver failure, the protein intensities would be minimised and the bilirubin strengths
would be raised (Firneisz 2014). The levels of direct and total bilirubin can assist in the resolve
of cause of Hyperbilirubinemia which leads to jaundice. There are several limitations in the
performing of the test. First, lack of sensitivity: the LFT may be regular in definite liver illnesses
such as cirrhosis, congenital hepatic fibrosis and non-cirrhotic portal fibrosis (Firneisz 2014).
Second, the lack of specificity: they are not precise for any specific ailment. Serum albumin may
be reduced in prolonged ailment and also in nephritic condition. Aminotransferases may be
increased in cardiac and hepatic illnesses (Taverna, Marie, Mira and Guidet 2013). Excluding
serum bile acids, the LFT is not specific for liver disease and all factors may be raised for
pathological courses outsides the liver (Taverna, Marie, Mira and Guidet 2013). Therefore, LFT
is perceived to have certain benefits as well as limits at the same period. Hence, it is crucial to
outlook them keeping the clinical summary of the patient in mind. Hyperbilirubinemia results
from lessened uptake or overproduction, secretion or conjugation from hepatocytes to bile ducts
(Musso et al. 2014).
To conclude, Gilbert’s syndrome warrants particular attention. This is a typical, benign condition
categorised by unconjugated Hyperbilirubinemia, which is worsened by not eating. It does not
need any exact action and the patient should be comforted. Uneven isolated unconjugated
Hyperbilirubinemia may also be comprehended in fulminant Wilson’s syndrome. It is also worth
noting that the bilirubin intensities of more than 85umol/l in the existence of normal hepatic
function cannot be elucidated by long-lasting hemolysis only. Therefore, the experiment showed
positive results concurred with the literature on the topic.
References
Biochemical analysis of blood 12
Bhat, A.A., Wadhwa, D.R., Singh, S.P. and Singh, I., 2013. Haematological and biochemical
analysis in canine enteritis. Veterinary World, 6(7). [Online]. Retrieved at:
https://cyberleninka.org/article/n/473200.pdf, [Accessed on 26 November 2018].
Bier, M. ed., 2013. Electrophoresis: theory, methods, and applications. Elsevier. [Online].
Retrieved at: https://books.google.com/books?
hl=en&lr=&id=qSsXBQAAQBAJ&oi=fnd&pg=PP1&dq=serum+protein+electrophoresis+in+hu
mans&ots=MkKFpzGvrp&sig=rAo5okLVnt6TrY_ZTwp1Tc1Cc8c, [Accessed on 26 November
2018].
Firneisz, G., 2014. Non-alcoholic fatty liver disease and type 2 diabetes mellitus: the liver
disease of our age?. World journal of gastroenterology: WJG, 20(27), p.9072. [Online].
Retrieved at: https://www.ncbi.nlm.nih.gov/pmc/articles/PMC4112878/, [Accessed on 26
November 2018].
Ma, Y.Y., Li, L., Yu, C.H., Shen, Z., Chen, L.H. and Li, Y.M., 2013. Effects of probiotics on
nonalcoholic fatty liver disease: a meta-analysis. World journal of gastroenterology:
WJG, 19(40), p.6911. [Online]. Retrieved at:
https://www.ncbi.nlm.nih.gov/pmc/articles/PMC3812493/, [Accessed on 26 November 2018].
Mamun, M.A., Hassan, M.M., Shaikat, A.H., Islam, S.K.M.A., Hoque, M.A., Uddin, M. and
Hossain, M.B., 2013. Biochemical analysis of blood of native cattle in the hilly area of
Bangladesh. Bangladesh Journal of Veterinary Medicine, 11(1), pp.51-56. [Online]. Retrieved
at: https://www.researchgate.net/profile/Mohammad_Hassan24/publication/
269561879_Biochemical_analysis_of_blood_of_native_cattle_in_the_hilly_area_of_Bangladesh
/links/57ce49e008ae83b37460ebc4.pdf, [Accessed on 26 November 2018].
Biochemical analysis of blood 13
Musso, G., Gambino, R., Tabibian, J.H., Ekstedt, M., Kechagias, S., Hamaguchi, M., Hultcrantz,
R., Hagström, H., Yoon, S.K., Charatcharoenwitthaya, P. and George, J., 2014. Association of
non-alcoholic fatty liver disease with chronic kidney disease: a systematic review and meta-
analysis. PLoS medicine, 11(7), p.e1001680. [Online]. Retrieved at:
http://journals.plos.org/plosmedicine/article?id=10.1371/journal.pmed.1001680, [Accessed on 26
November 2018]. , [Accessed on 26 November 2018].
Taverna, M., Marie, A.L., Mira, J.P. and Guidet, B., 2013. Specific antioxidant properties of
human serum albumin. Annals of intensive care, 3(1), p.4. [Online]. Retrieved at:
https://link.springer.com/article/10.1186/2110-5820-3-4, [Accessed on 26 November 2018].
Zelig, U., Barlev, E., Bar, O., Gross, I., Flomen, F., Mordechai, S., Kapelushnik, J., Nathan, I.,
Kashtan, H., Wasserberg, N. and Madhala-Givon, O., 2015. Early detection of breast cancer
using total biochemical analysis of peripheral blood components: a preliminary study. BMC
cancer, 15(1), p.408. [Online]. Retrieved at:
https://bmccancer.biomedcentral.com/articles/10.1186/s12885-015-1414-7, [Accessed on 26
November 2018].
1 out of 13
Your All-in-One AI-Powered Toolkit for Academic Success.
+13062052269
info@desklib.com
Available 24*7 on WhatsApp / Email
![[object Object]](/_next/static/media/star-bottom.7253800d.svg)
Unlock your academic potential
© 2024 | Zucol Services PVT LTD | All rights reserved.