Monash University: BCH3042 Cell Signal Transduction Apoptosis Report

Verified

Added on  2023/06/03

|4
|618
|152
Practical Assignment
AI Summary
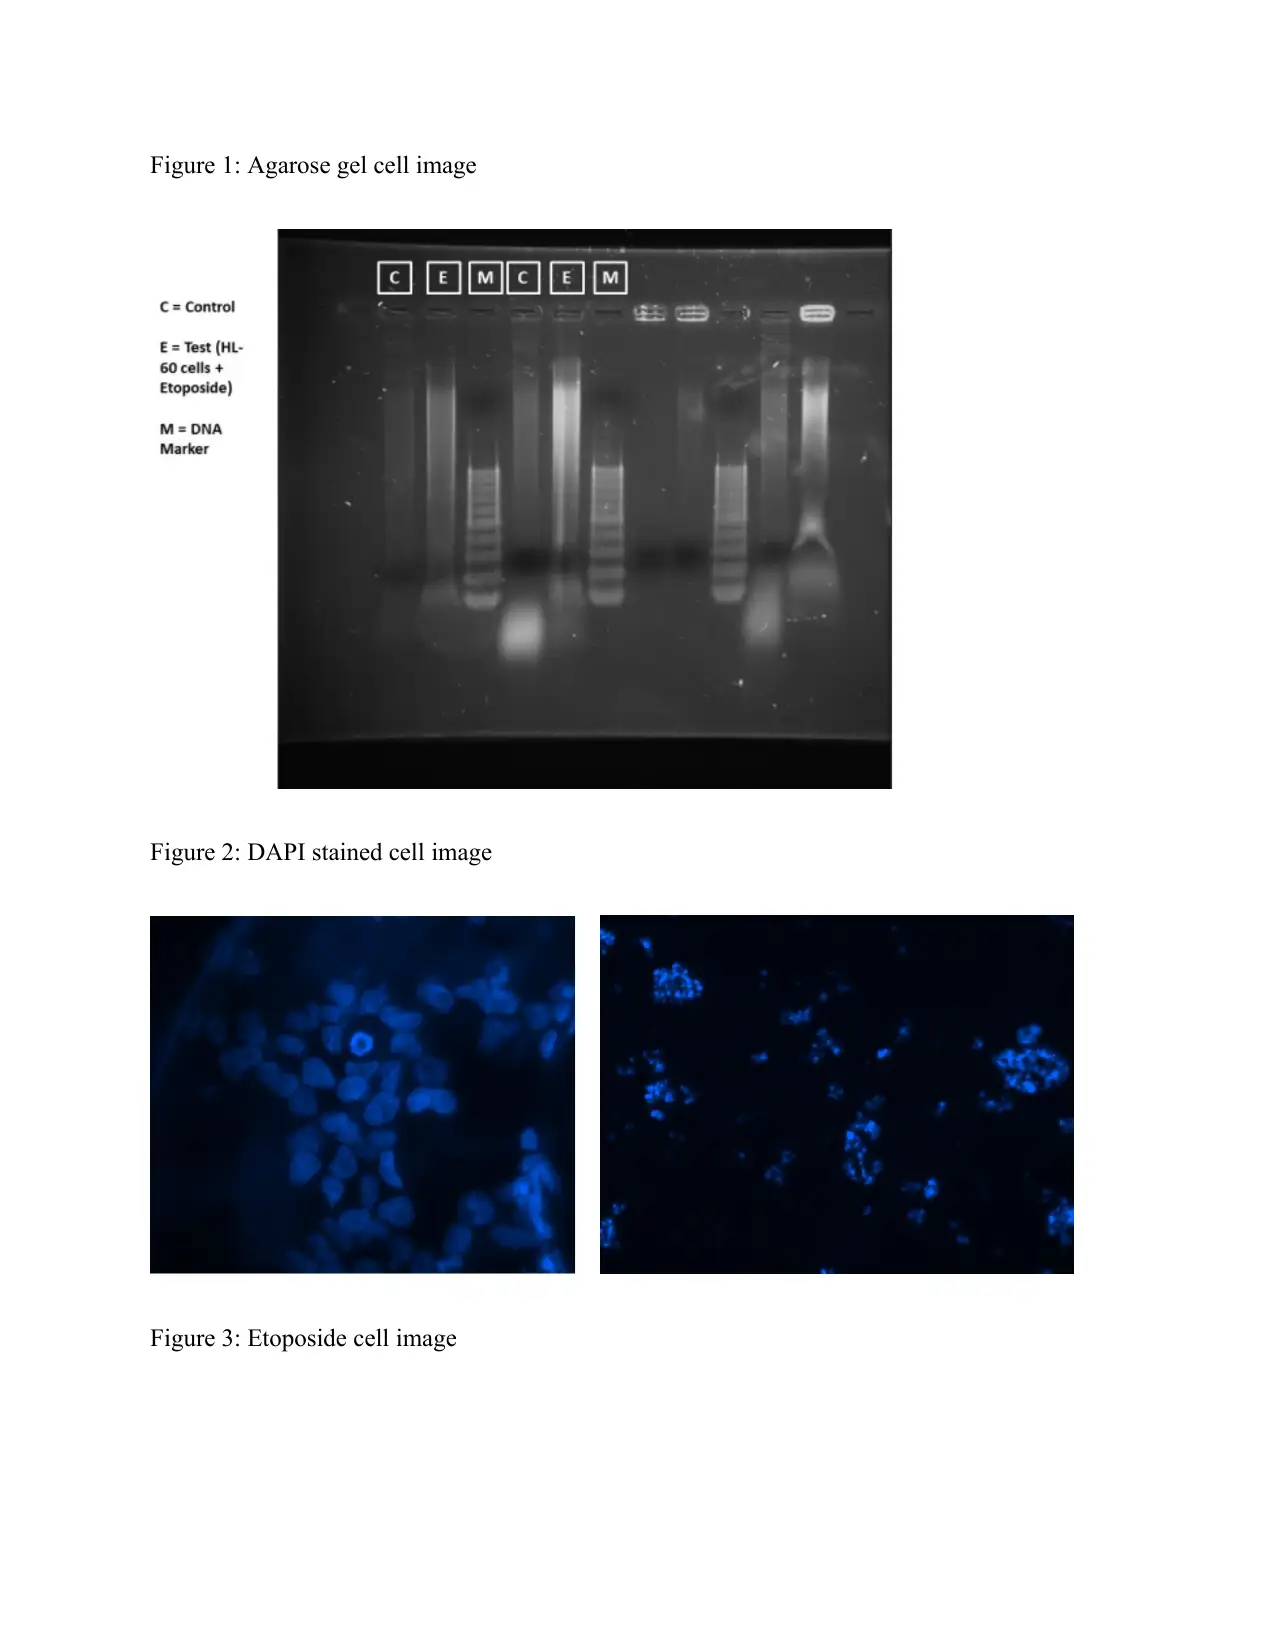
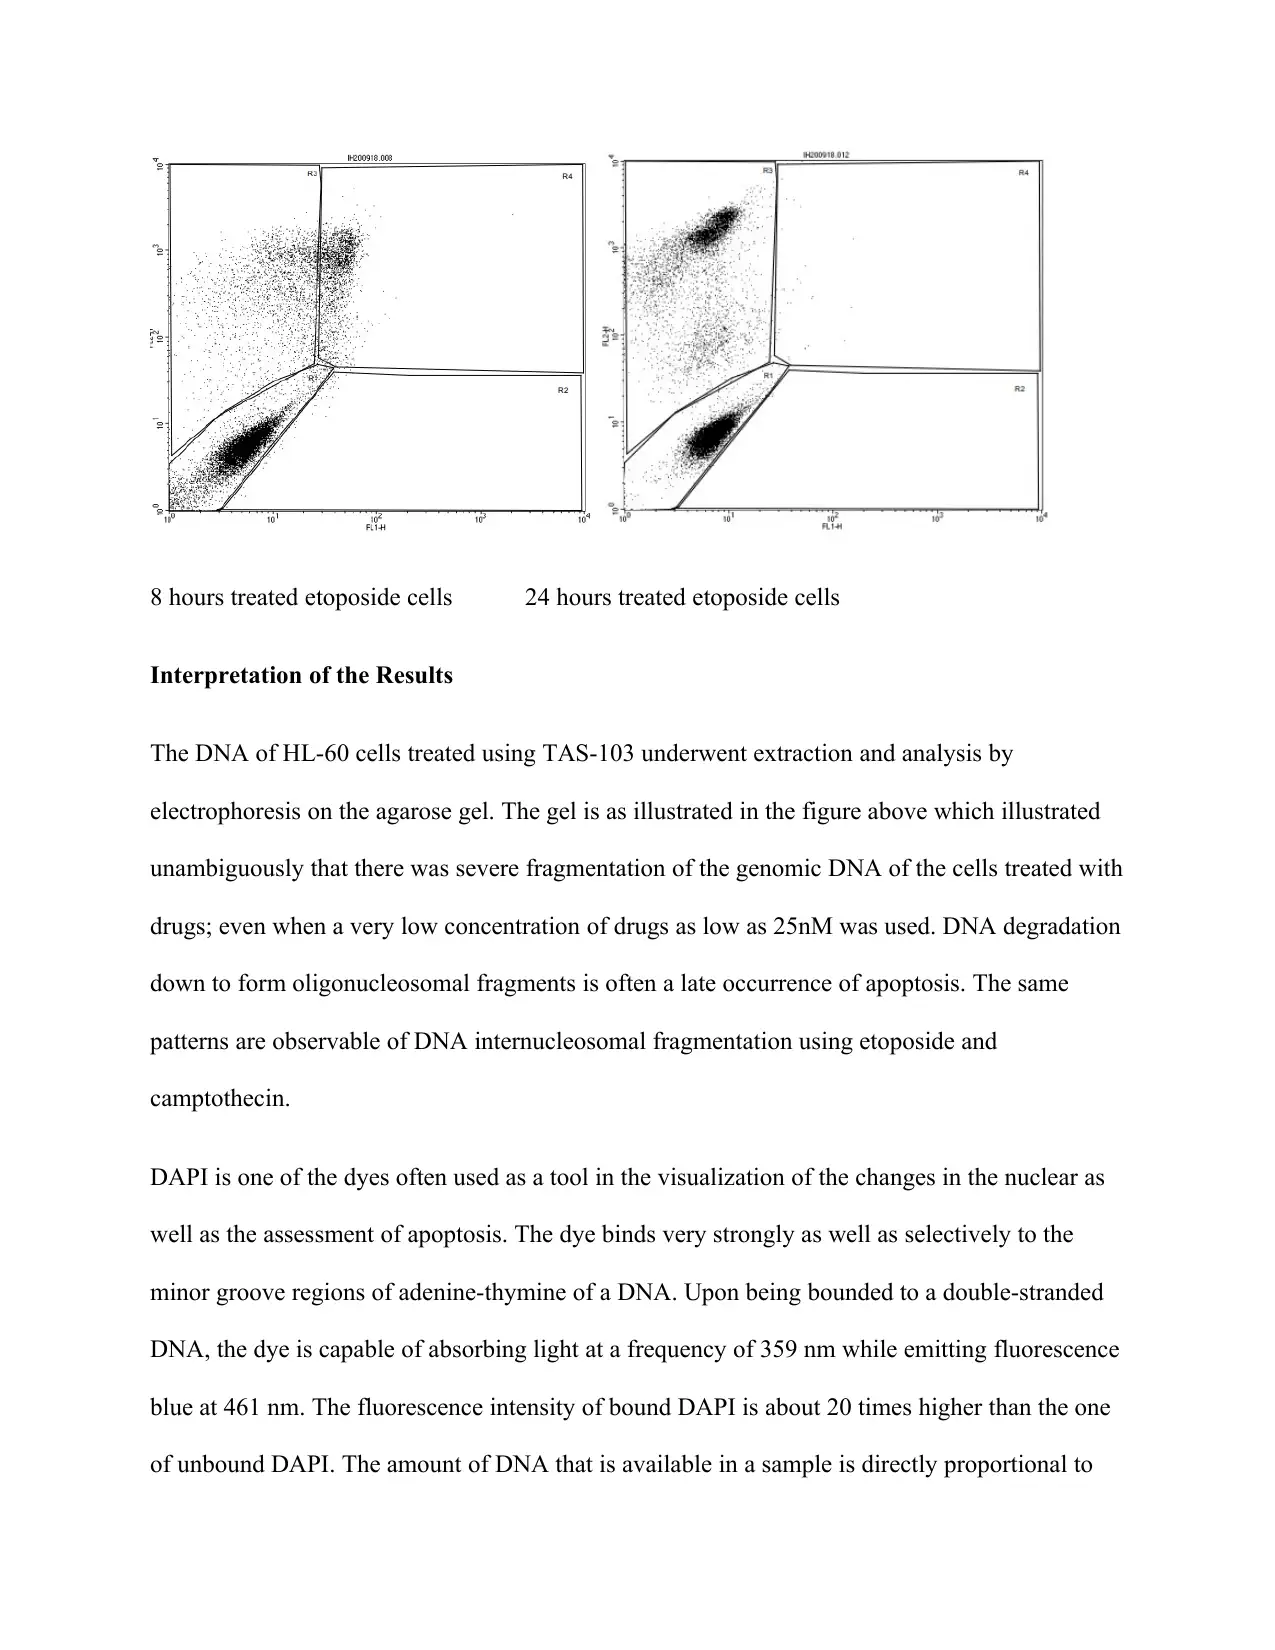
This report analyzes the effects of TAS-103, etoposide, and camptothecin on HL-60 cells, focusing on DNA fragmentation and apoptosis. DNA extraction and agarose gel electrophoresis revealed severe DNA degradation, even at low drug concentrations. DAPI staining indicated low DNA concentration and irregular cell morphology, suggesting protein aggregates with lysosomes. Observations from 8 to 24 hours post-etoposide treatment indicated a late phase of apoptosis, characterized by cell shrinkage, apoptotic body formation, membrane blebbing, and DNA fragmentation. The study contrasts DAPI staining with FASC analysis, highlighting DAPI's ability to provide detailed cellular information, while FASC offers insights into the relative number of DNA cells. Desklib provides a platform to access similar solved assignments.
Document Page
BIOCHEMISTRY LAB
[Author Name(s), First M. Last, Omit Titles and Degrees]
[Institutional Affiliation(s)]
tabler-icon-diamond-filled.svg

Paraphrase This Document

Need a fresh take? Get an instant paraphrase of this document with our AI Paraphraser
Document Page
Figure 1: Agarose gel cell image
Figure 2: DAPI stained cell image
Figure 3: Etoposide cell image
Document Page
8 hours treated etoposide cells 24 hours treated etoposide cells
Interpretation of the Results
The DNA of HL-60 cells treated using TAS-103 underwent extraction and analysis by
electrophoresis on the agarose gel. The gel is as illustrated in the figure above which illustrated
unambiguously that there was severe fragmentation of the genomic DNA of the cells treated with
drugs; even when a very low concentration of drugs as low as 25nM was used. DNA degradation
down to form oligonucleosomal fragments is often a late occurrence of apoptosis. The same
patterns are observable of DNA internucleosomal fragmentation using etoposide and
camptothecin.
DAPI is one of the dyes often used as a tool in the visualization of the changes in the nuclear as
well as the assessment of apoptosis. The dye binds very strongly as well as selectively to the
minor groove regions of adenine-thymine of a DNA. Upon being bounded to a double-stranded
DNA, the dye is capable of absorbing light at a frequency of 359 nm while emitting fluorescence
blue at 461 nm. The fluorescence intensity of bound DAPI is about 20 times higher than the one
of unbound DAPI. The amount of DNA that is available in a sample is directly proportional to
Document Page
the fluorescence. From the obtained results of the experiment, it is observable that the
concentration of the fluorescence is relatively low hence indicating that the cell that was used in
the experiment had minimal amount of DNA. Still from the findings, the cell seems to be located
off the nucleus and definitely very big and has an irregular shape that may not allow it to fit
within the endosomal compartment. The cell may be protein aggregates that likely have
lysosomes.
From the results of the experiment, from the 08 hour to the 24 hours of the etoposide, it is
deducible that the phase of the apoptosis is at the late phase. During this stage, there are
experienced gross morphological variations in the cells that are noticed in a conspicuous manner.
Among these changes include the shrinkage of the cell, formation of the bodies of apoptotic,
blebbing of the membrane as well as fragmentation of the DNA. Such changes van is noticed
through the use of microscopy of simple phase contrast. Nonetheless, investigation off the
changes into finer details would call for the use of antibody based methods most of which are
readily available. Shrinkage of the cell takes place due to the serine or threonine kinase which
tends to reorganize the cytoskeleton. Stain for actin is one of the best ways of visualizing such a
physical arrangement that is encompasses the grater section of the cytoskeleton and is often
cleaved during the stages of late apoptosis.
The results of DAPI staining provide a clearer picture of the cell that is under study as compared
to the results of FASC analysis. From the DAPI staining results, the location of the cell can be
predicted, its composition as well as the probable size and where it may fit. On the other hand,
the FASC results provide an idea on the relative number of DNA cells that are inside the
organelle. From a combination of both results, a biter understanding of the cell is gained.
chevron_up_icon
1 out of 4
circle_padding
hide_on_mobile
zoom_out_icon
[object Object]