University Biochemistry Lab Report: Biuret Assay and Protein Analysis
VerifiedAdded on 2022/09/08
|9
|1678
|17
Report
AI Summary
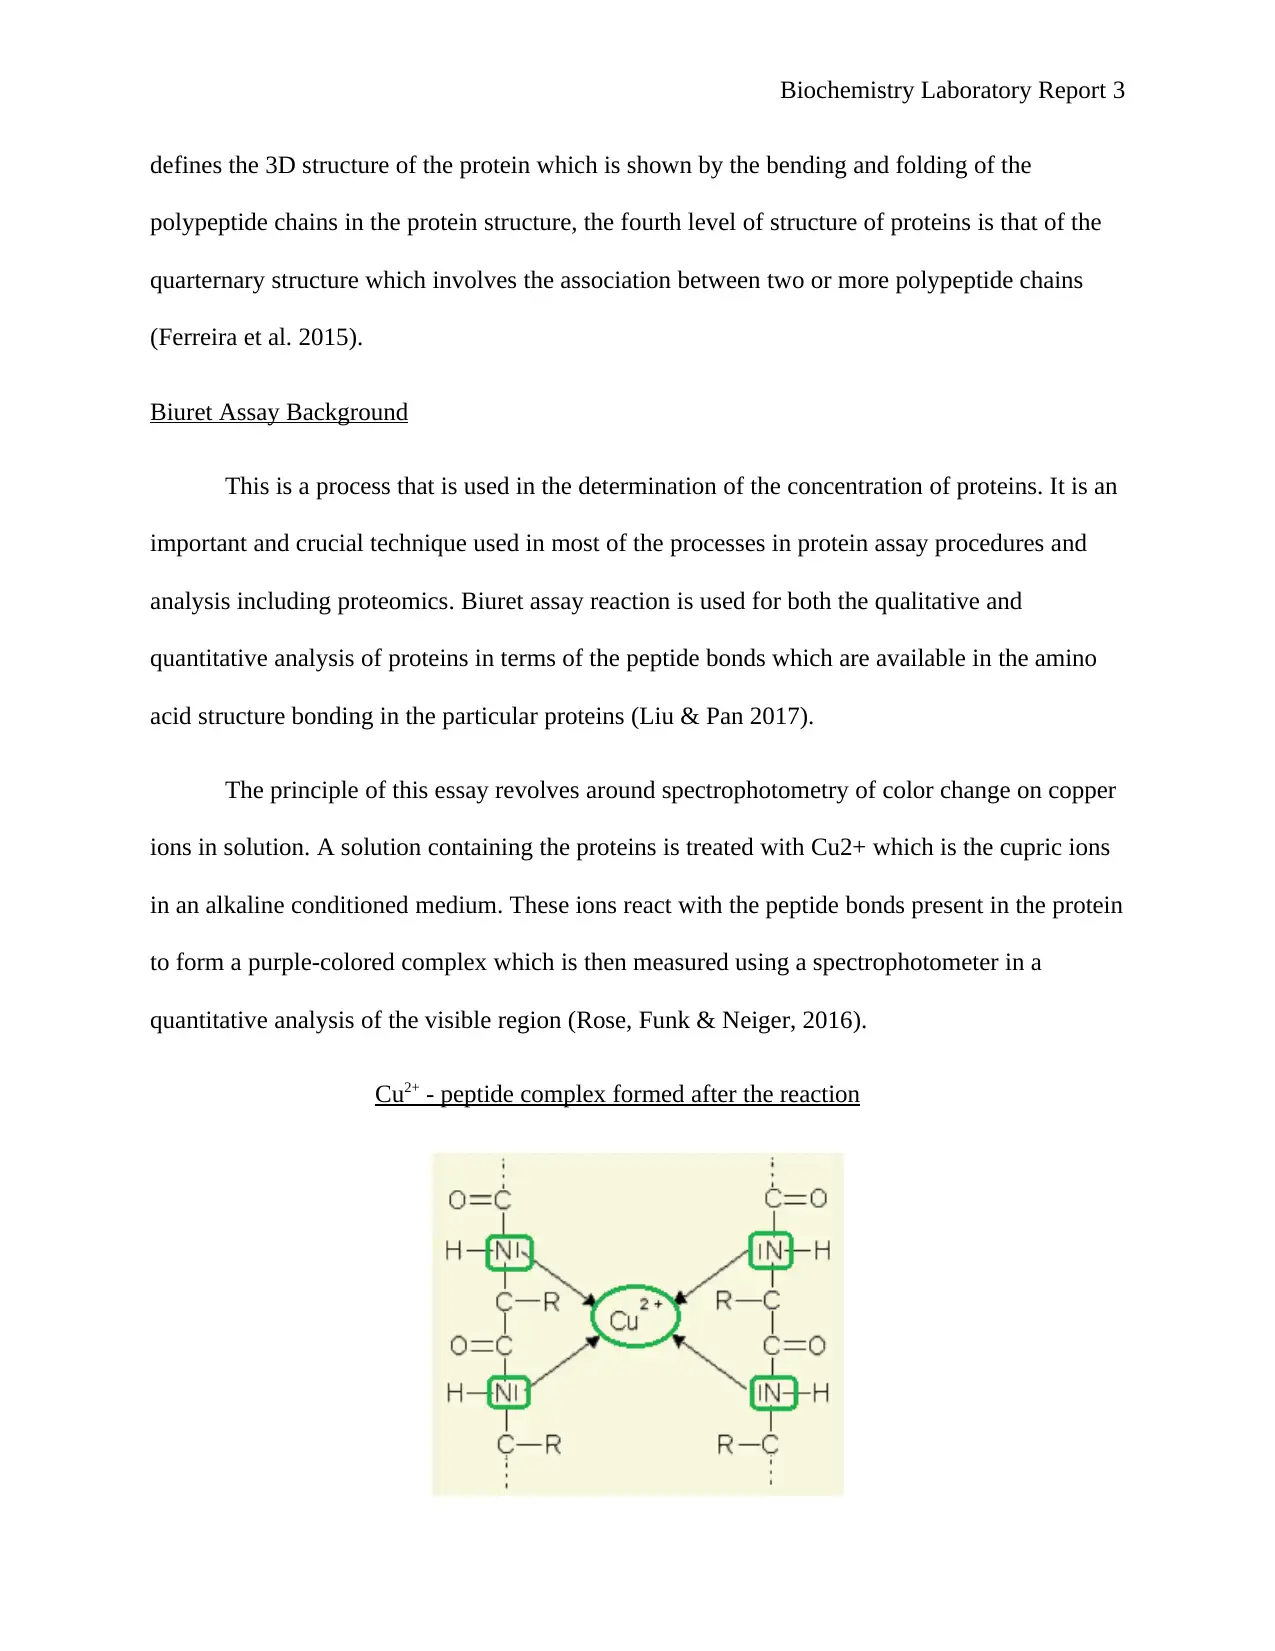
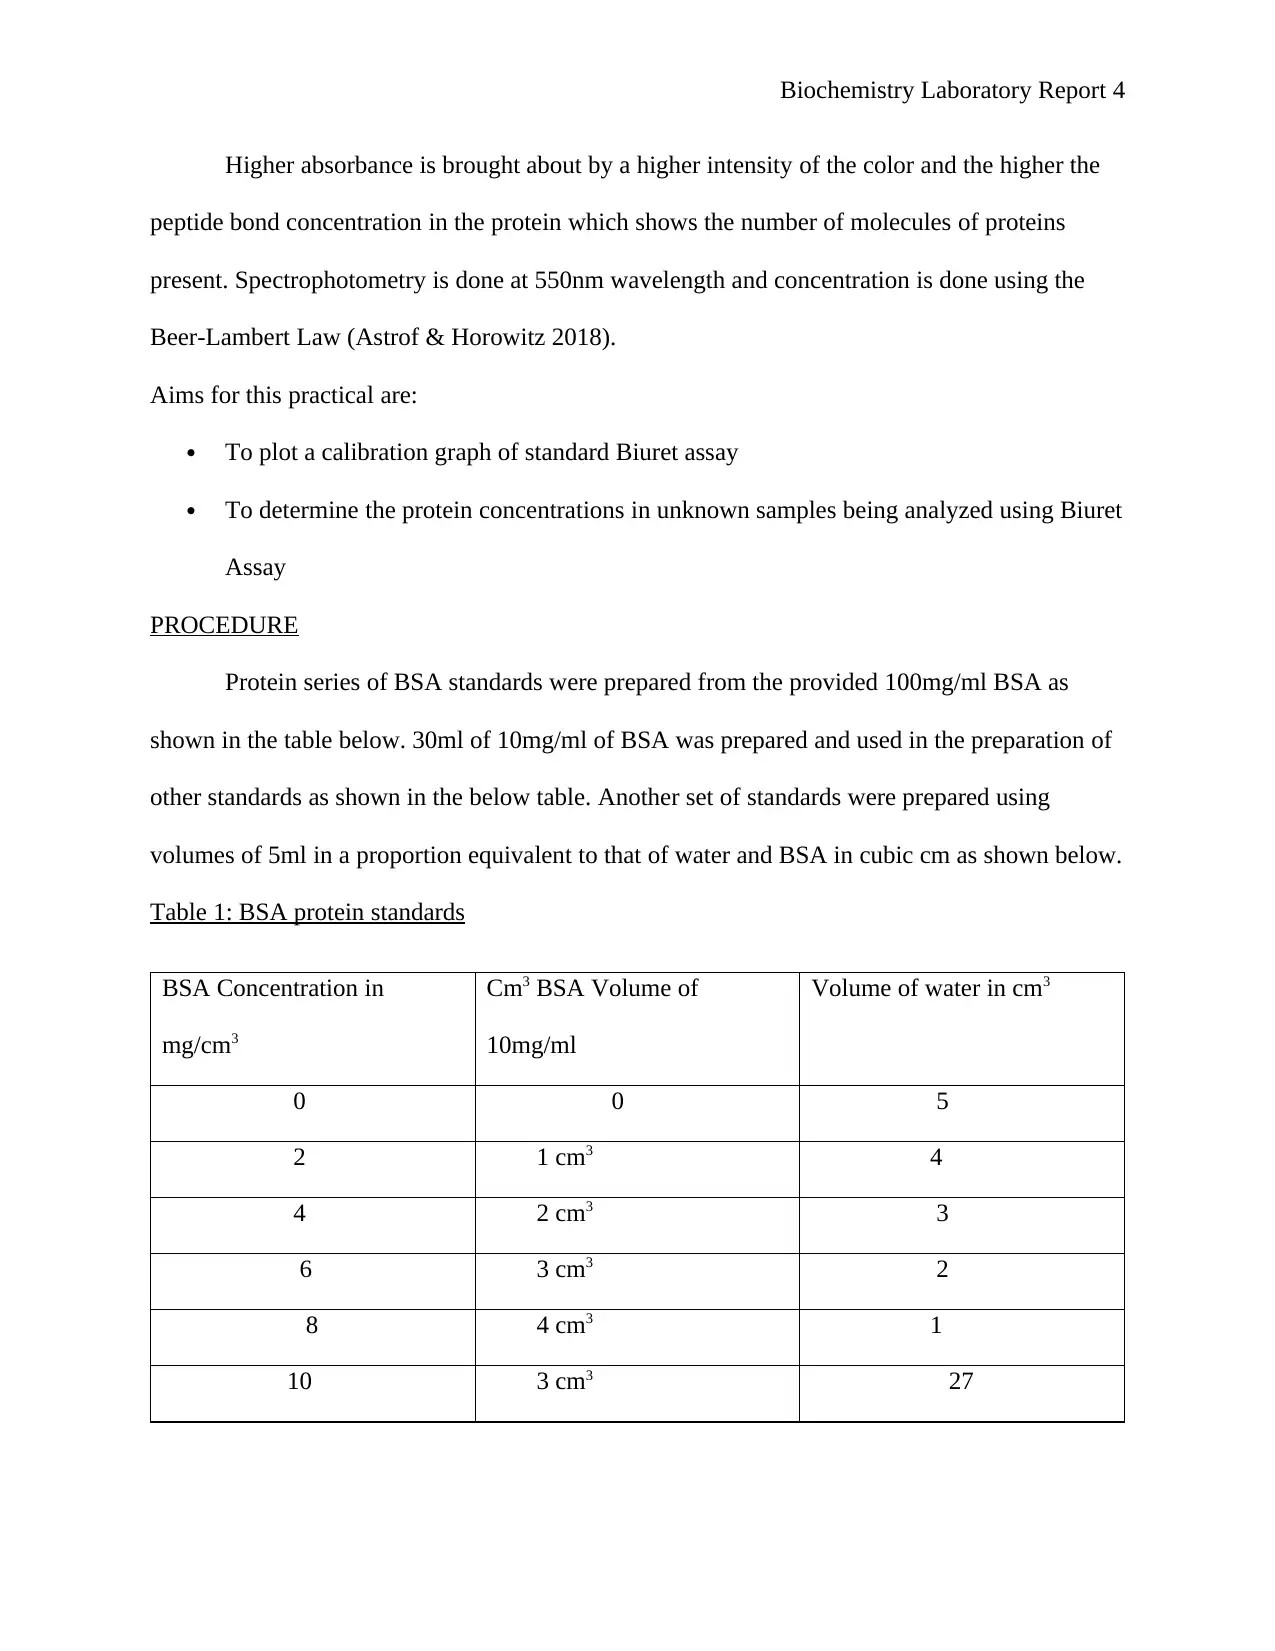
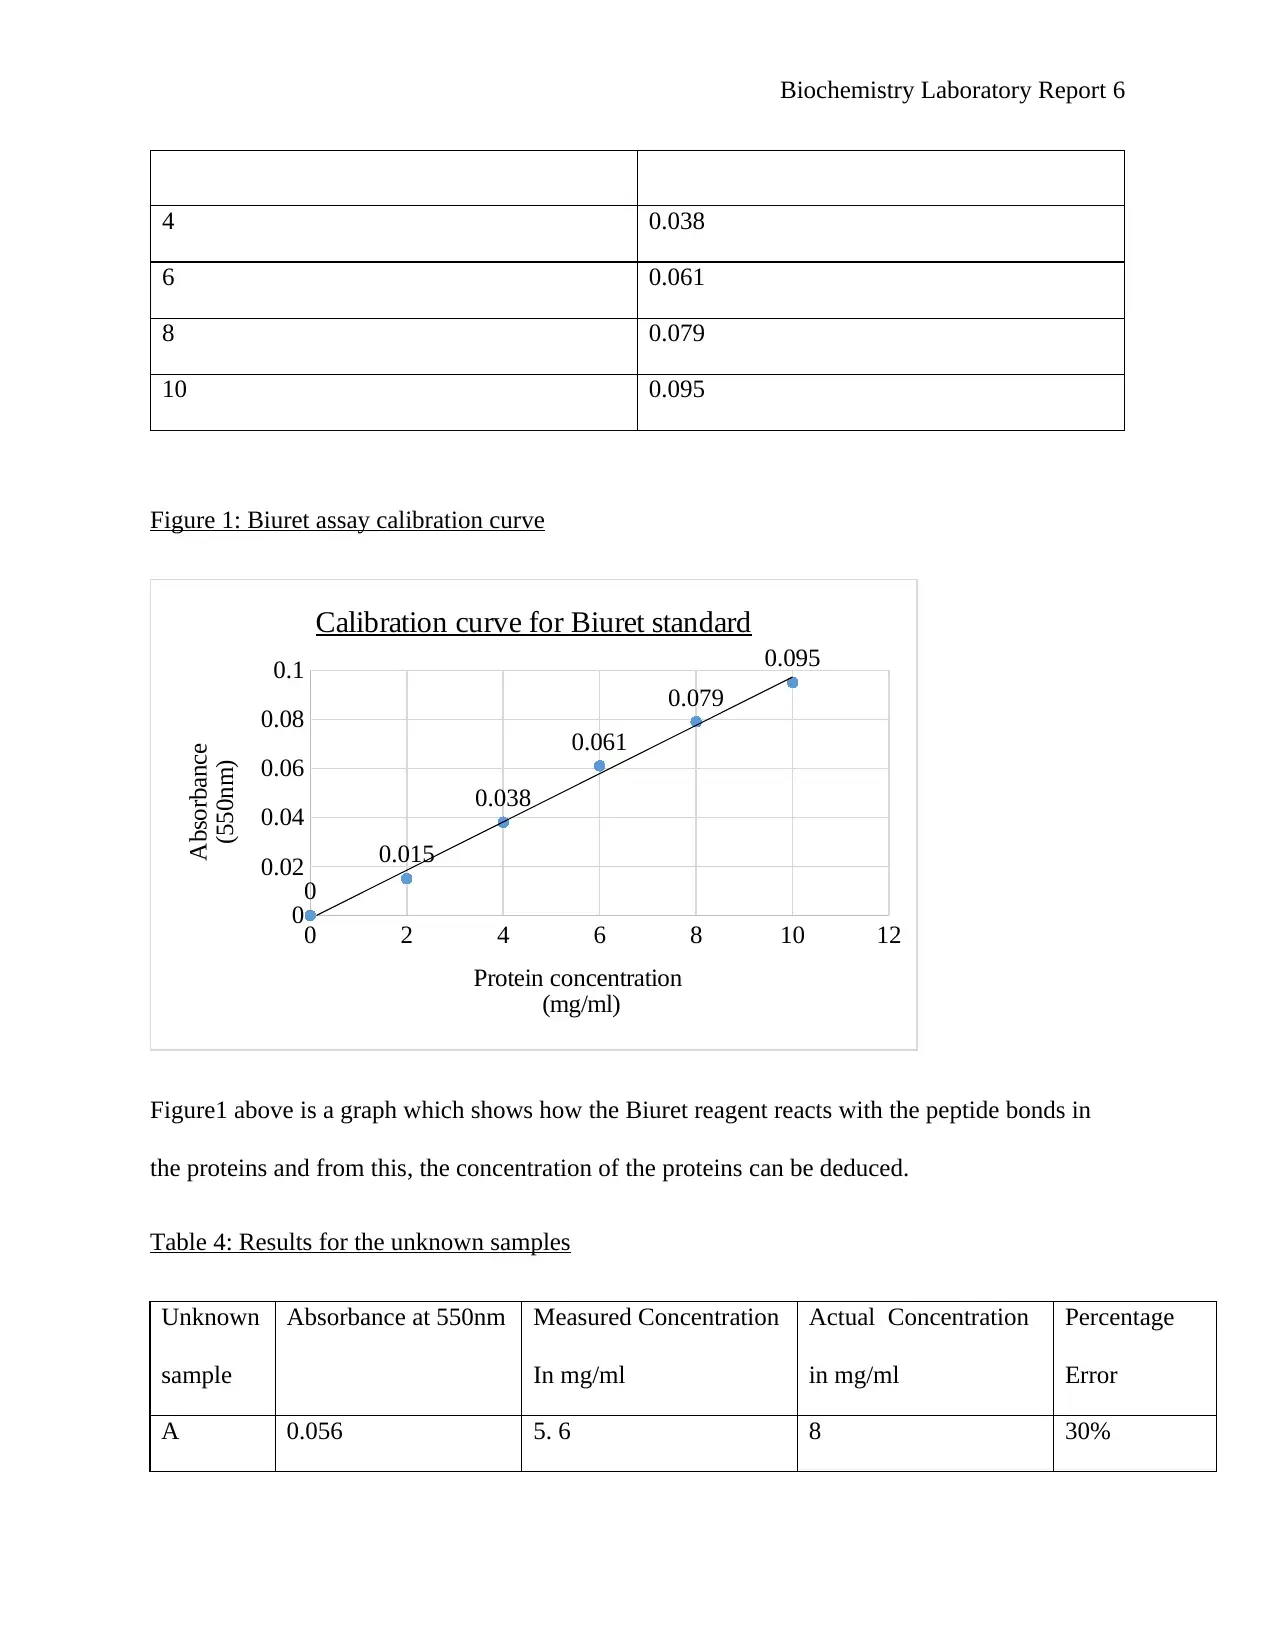
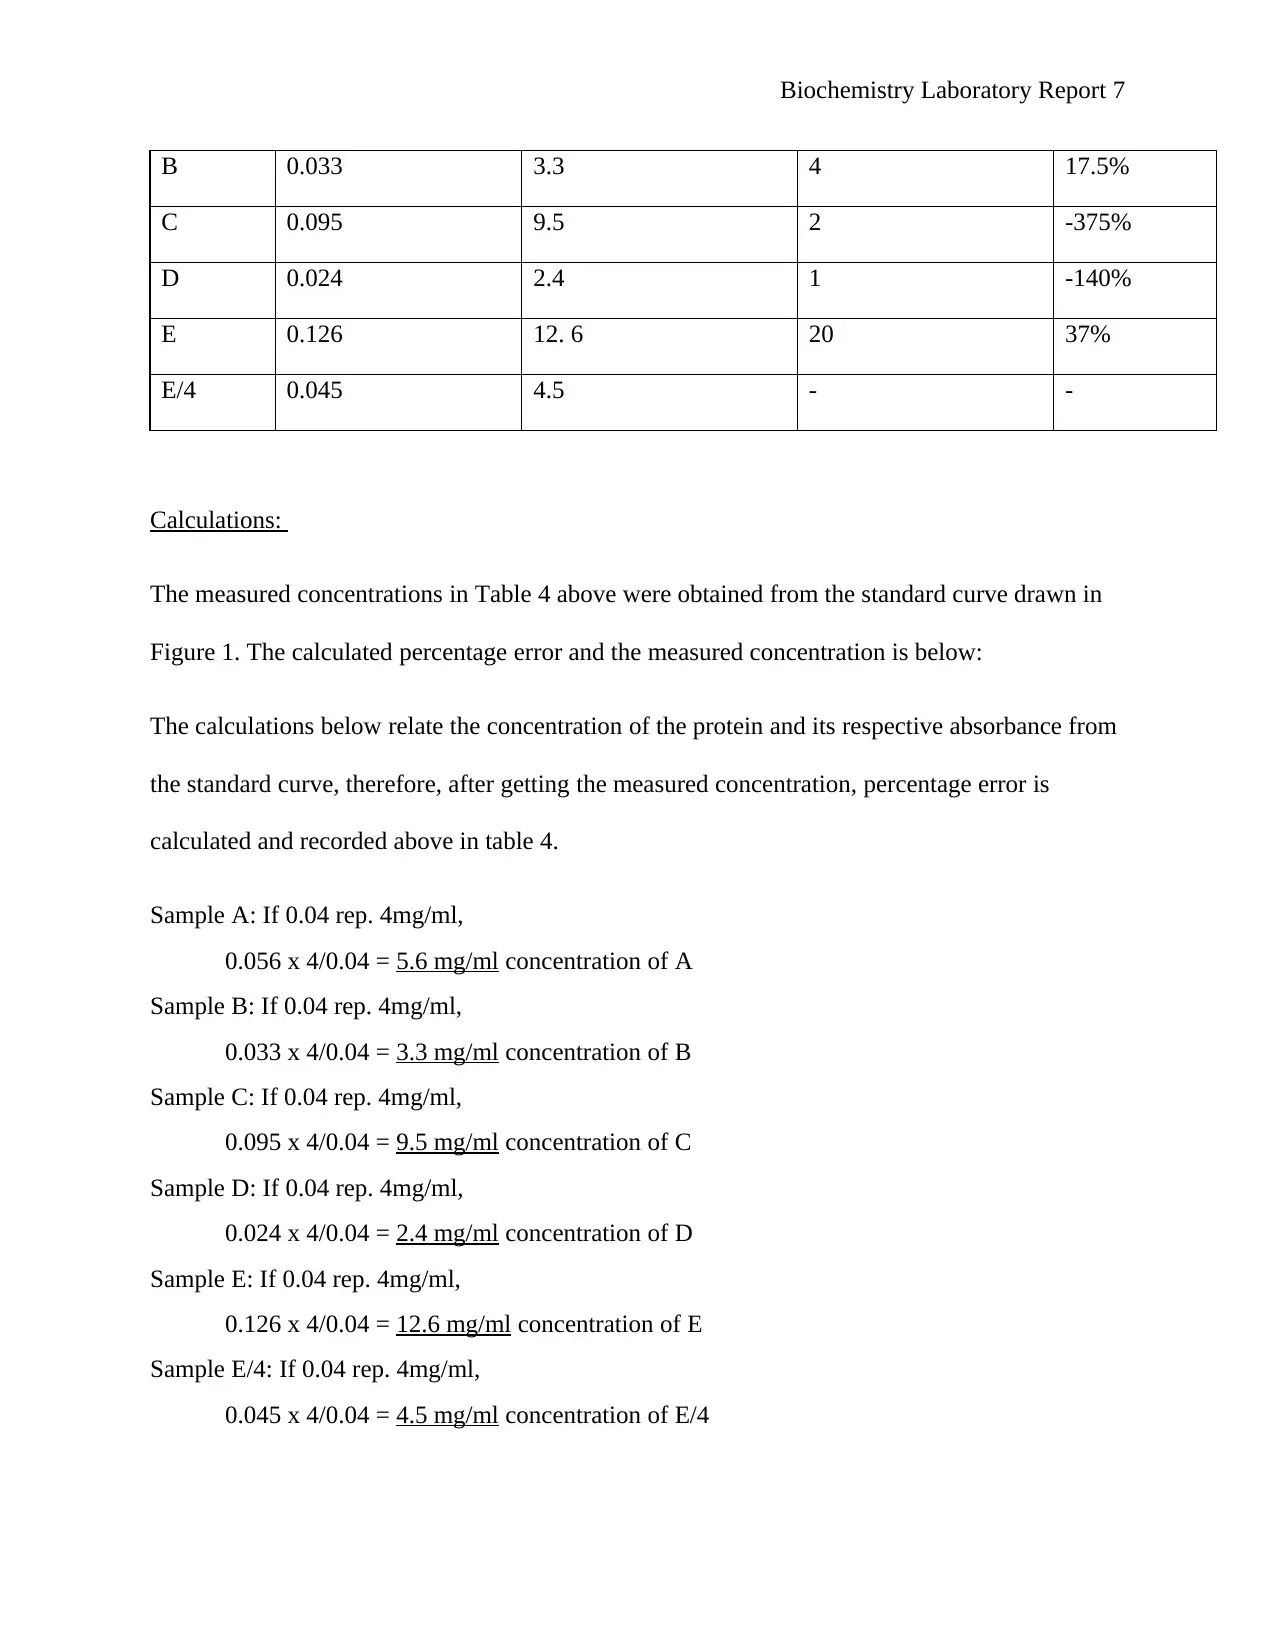
This Biochemistry lab report details an experiment using the Biuret assay to determine protein concentrations in unknown samples. The report begins with an introduction to proteins, their structures, and the Biuret assay background. The procedure involved preparing BSA standards, reacting them with Biuret reagent, and measuring absorbance using a spectrophotometer at 550nm. Results include a calibration curve and absorbance readings for unknown samples, from which protein concentrations were calculated using the Beer-Lambert law. The discussion analyzes the relationship between absorbance and concentration, while the conclusion highlights the assay's application in medical analysis, such as in urine tests for kidney disorders. The report also includes tables of data and a graph illustrating the calibration curve, along with the calculations for determining the percentage error. It also references relevant scientific articles that support the background information and experimental methods used.
1 out of 9
Related Documents


Your All-in-One AI-Powered Toolkit for Academic Success.
+13062052269
info@desklib.com
Available 24*7 on WhatsApp / Email
![[object Object]](/_next/static/media/star-bottom.7253800d.svg)
Copyright © 2020–2026 A2Z Services. All Rights Reserved. Developed and managed by ZUCOL.