BY270 Biochemistry Practical: Clotting Tests, Quality Control Analysis
VerifiedAdded on 2023/04/21
|8
|1421
|272
Practical Assignment
AI Summary
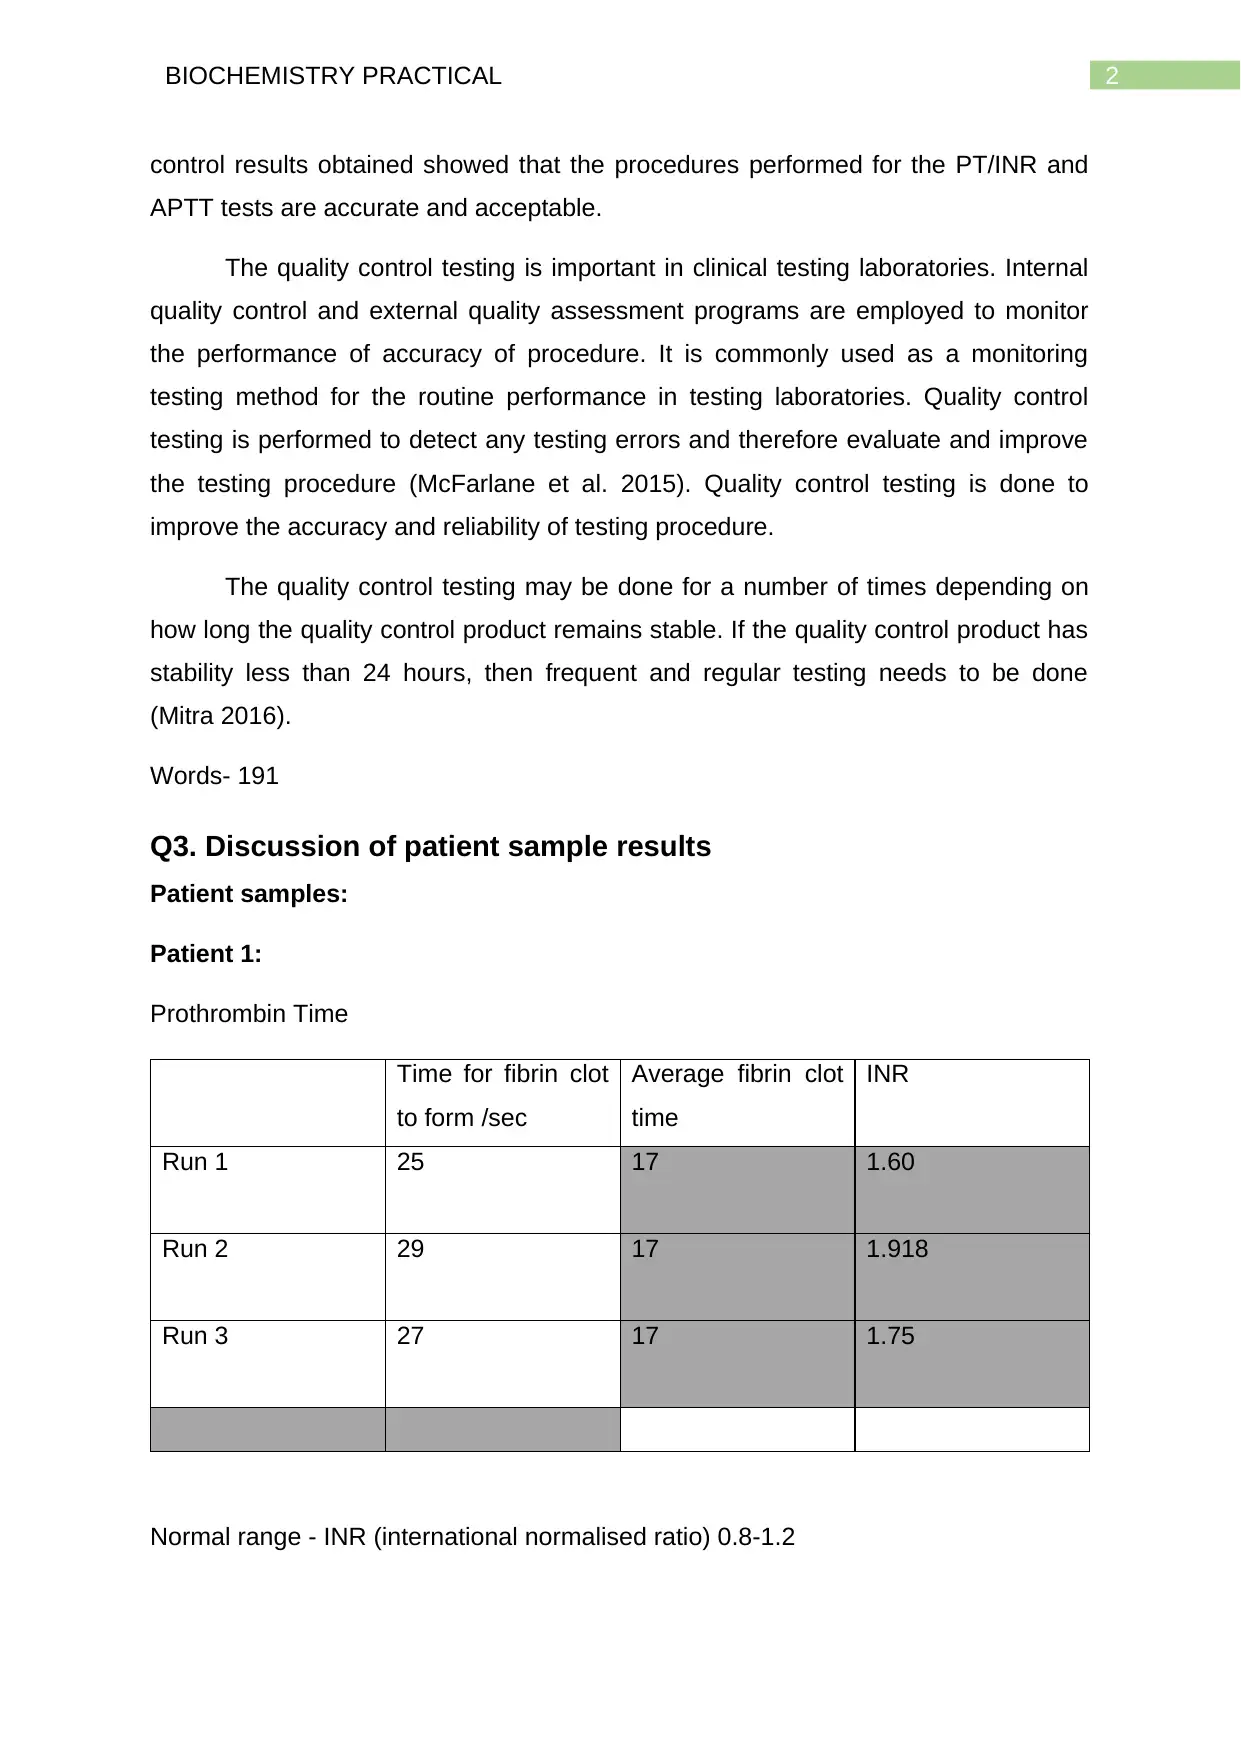
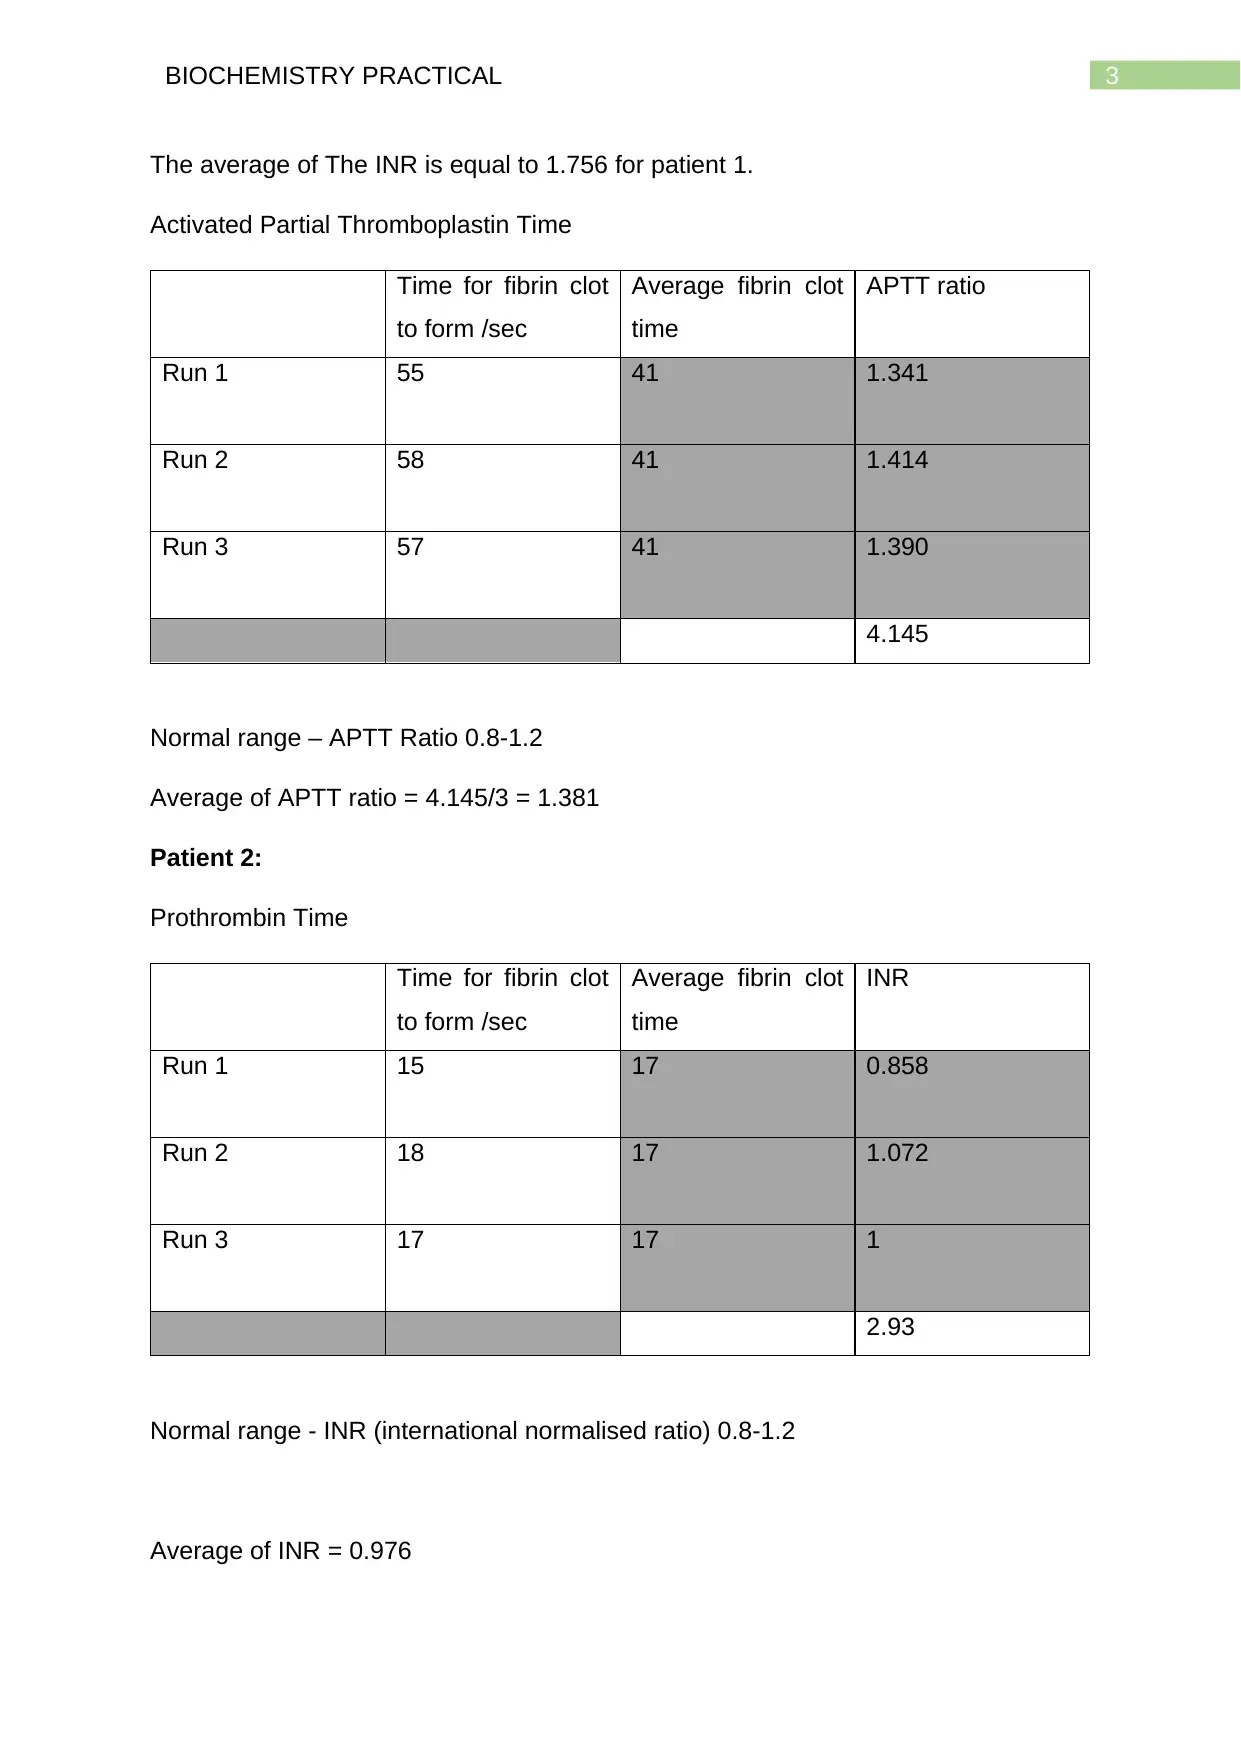
This biochemistry practical assignment delves into the principles of clotting screen tests, specifically Prothrombin Time (PT) and Activated Partial Thromboplastin Time (APTT), used for assessing bleeding risks. It discusses the role of PT in measuring the extrinsic pathway of blood coagulation and APTT in measuring the intrinsic pathway. The assignment also covers quality control testing using manufactured plasma membranes, emphasizing the importance of maintaining results within a normalized range. Furthermore, it includes a detailed analysis of patient sample results, interpreting PT/INR and APTT values to diagnose potential clotting disorders or the effects of medications like warfarin, differentiating between normal haemostasis and conditions indicating vitamin K deficiency or liver disease. Desklib offers a wealth of similar solved assignments and past papers for students.
1 out of 8

Your All-in-One AI-Powered Toolkit for Academic Success.
+13062052269
info@desklib.com
Available 24*7 on WhatsApp / Email
![[object Object]](/_next/static/media/star-bottom.7253800d.svg)
Copyright © 2020–2026 A2Z Services. All Rights Reserved. Developed and managed by ZUCOL.