Lipid Peroxidation Experiment to Demonstrate Antioxidant Potential of Quercetin
VerifiedAdded on 2023/04/21
|12
|2678
|311
AI Summary
This article discusses a lipid peroxidation experiment that demonstrates the antioxidant potential of quercetin. The method involves the estimation of malondialdehyde (MDA) as a biomarker of lipid peroxidation in liver tissues. The results show that quercetin inhibits MDA concentration in oxidized liver tissue, indicating its antioxidant effect. The discussion explores the role of Fenton reaction, antioxidants, and lipid peroxidation in oxidative damage. The findings are consistent with existing literature.
Contribute Materials
Your contribution can guide someone’s learning journey. Share your
documents today.
Biology of Disease
1
1
Secure Best Marks with AI Grader
Need help grading? Try our AI Grader for instant feedback on your assignments.
Title: Lipid peroxidation experiment to demonstrate antioxidant potential of quercetin.
Abstract:
A simple and sensitive spectrophotometric method was developed and used for the estimation
of the MDA as the biomarker of lipid peroxidation in the liver tissues. This method uses
reaction of ferrous ion with H2O2 to produce hydroxyl radical and interaction of hydroxyl
radical with the lipids for the production of MDA. Standard curve was plotted using standard
MDA and standard curve was used for the estimation of MDA in the unknown samples.
Results obtained in this experiment exhibited similar pattern of results available in the
existing literature. Hence, this method can be successfully implemented in different tissues
for studying oxidative disease mechanisms.
2
Contents:
Introduction…………………………………………………………1
Methods……………………………………………………………..1
Results………………………………………………………………2
Discussion ………………………………………………………….6
Conclusion ………………………………………………………….8
References…………………………………………………………..9
3
Introduction…………………………………………………………1
Methods……………………………………………………………..1
Results………………………………………………………………2
Discussion ………………………………………………………….6
Conclusion ………………………………………………………….8
References…………………………………………………………..9
3
Introduction:
Lipid peroxidation by reactive oxygen species (ROS) is mainly responsible for damaging
organs in multiple acute and chronic disorders. Lipid peroxidation involves reaction of
oxygen with unsaturated lipids. Lipid hydroperoxides (LOOH) are the primary products
formed during the lipid peroxidation. Moreover, secondary products like malondialdehyde
(MDA), propanal, hexanal, and 4-hydroxynonenal (4-HNE) also form during lipid
peroxidation (Garcia et al., 2005). Since, MDA is highly reactive and toxic in nature; it
is highly relevant molecule for clinical and biomedical research. During lipid
peroxidation process, free radicals accumulate electrons from the lipids usually present in the
cell membrane which results in the cell damage. Most widely used and validated assay for the
analysis of lipid peroxidation products is thiobarbituric acid assay (TBA test). TBA assay
also referred as TBARS assay (thiobarbituric acid reactive substance assay). This assay is
useful in the measurement of lipid peroxidation in the cell and tissue extracts and biological
fluids. In this experiment, lipid peroxidation was evaluated in the liver tissues. End product of
TBA test is formation of MDA-TBA adduct (red adduct) through interaction of final product
of lipid peroxidation like malondialdehyde (MDA) with TBA. MDA-TBA adduct can be
accurately quantified using colorimetre (OD = 532 nm). Standard curve was prepared in the
range of 1.25 to 50 nM range of standard MDA. In this experiment, lipid peroxidation was
quantitatively assessed by measuring MDA at 532 nm (Kirkpatrick et al., 1986). In this
experiment, colorimeter estimation of MDA was performed.
Methods:
Methods used as per practical guide.
1
Secure Best Marks with AI Grader
Need help grading? Try our AI Grader for instant feedback on your assignments.
Results:
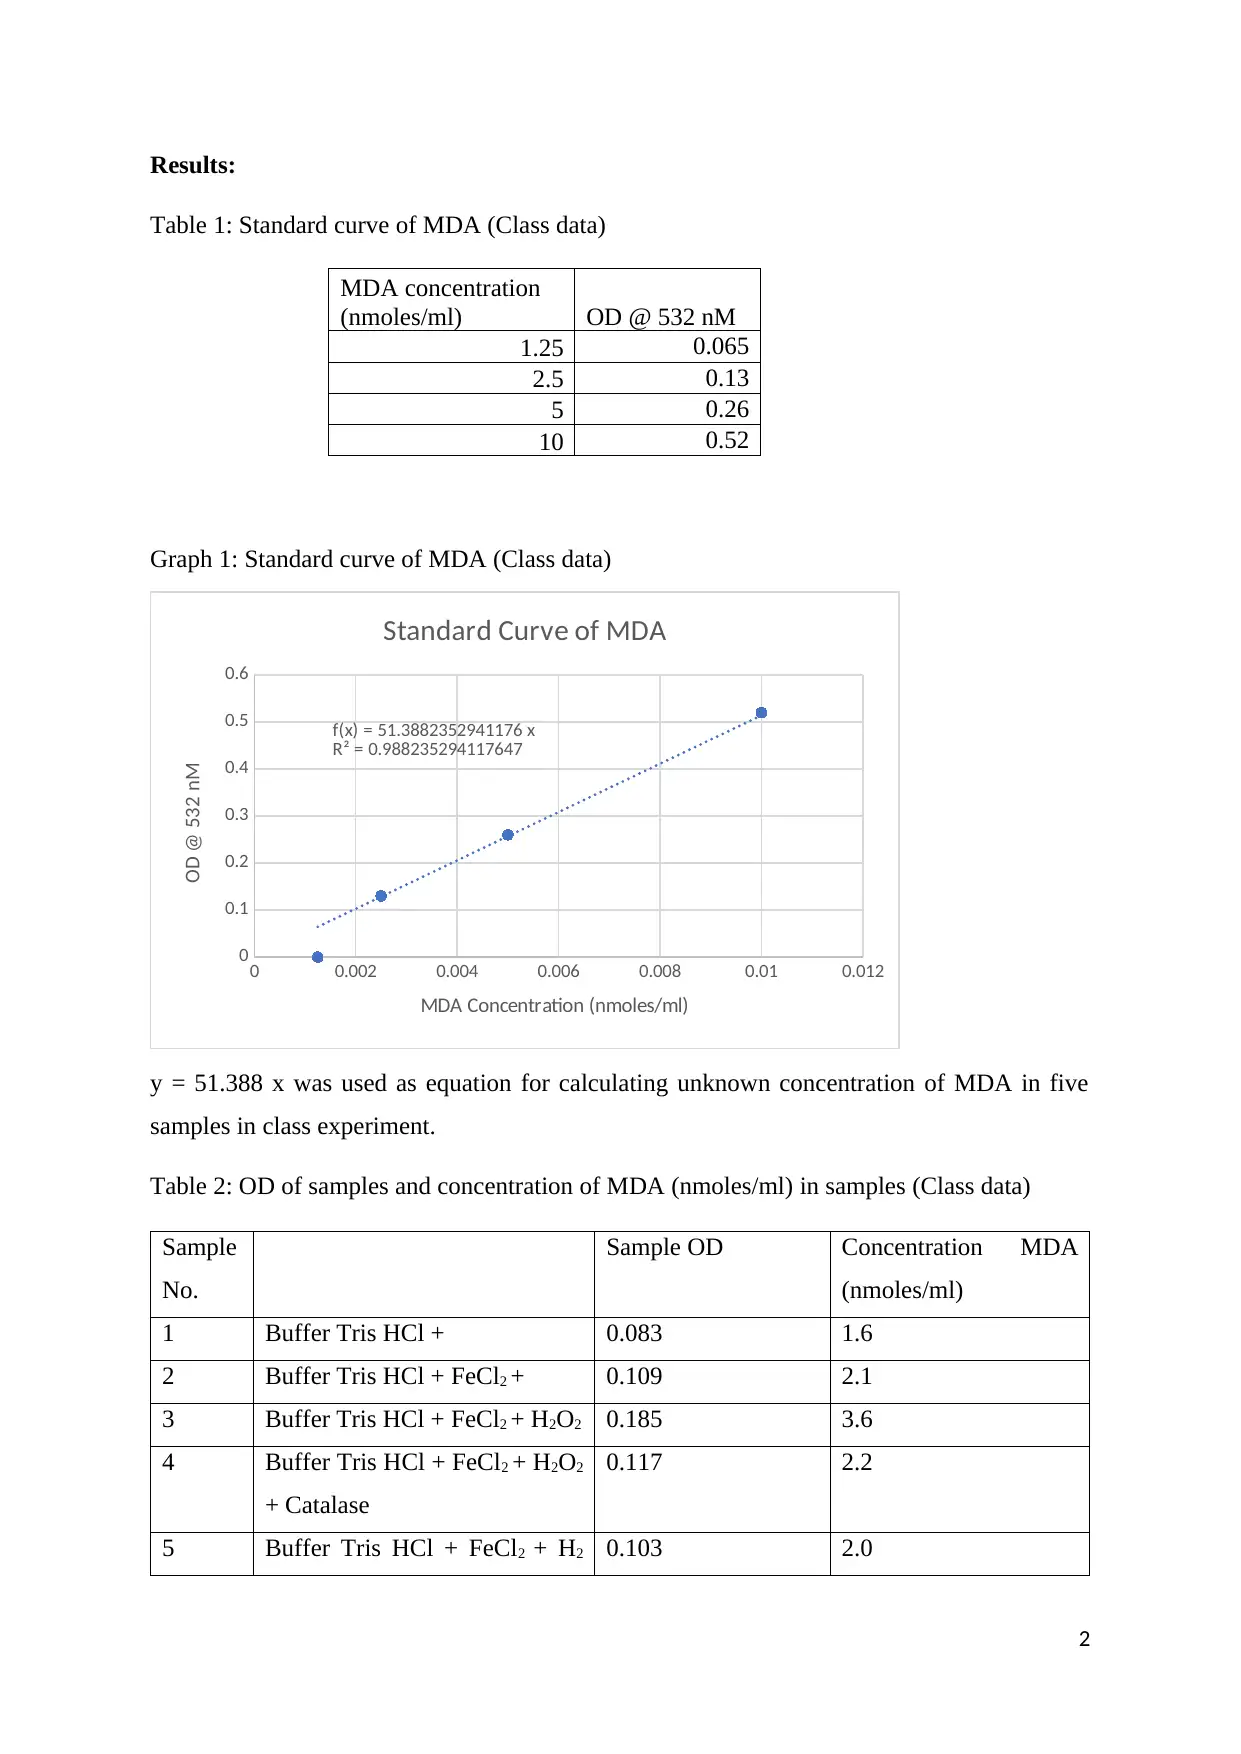
Table 1: Standard curve of MDA (Class data)
Graph 1: Standard curve of MDA (Class data)
0 0.002 0.004 0.006 0.008 0.01 0.012
0
0.1
0.2
0.3
0.4
0.5
0.6
f(x) = 51.3882352941176 x
R² = 0.988235294117647
Standard Curve of MDA
MDA Concentration (nmoles/ml)
OD @ 532 nM
y = 51.388 x was used as equation for calculating unknown concentration of MDA in five
samples in class experiment.
Table 2: OD of samples and concentration of MDA (nmoles/ml) in samples (Class data)
Sample
No.
Sample OD Concentration MDA
(nmoles/ml)
1 Buffer Tris HCl + 0.083 1.6
2 Buffer Tris HCl + FeCl2 + 0.109 2.1
3 Buffer Tris HCl + FeCl2 + H2O2 0.185 3.6
4 Buffer Tris HCl + FeCl2 + H2O2
+ Catalase
0.117 2.2
5 Buffer Tris HCl + FeCl2 + H2 0.103 2.0
2
MDA concentration
(nmoles/ml) OD @ 532 nM
1.25 0.065
2.5 0.13
5 0.26
10 0.52
O2 + Quercetin
Graph 2: Concertation of MDA (nmole/ml) in samples (Class data)
1 2 3 4 5
0
0.5
1
1.5
2
2.5
3
3.5
4
Concentraton of MDA (nmole/ml)
Sample Number
MDA (nmole/ml)
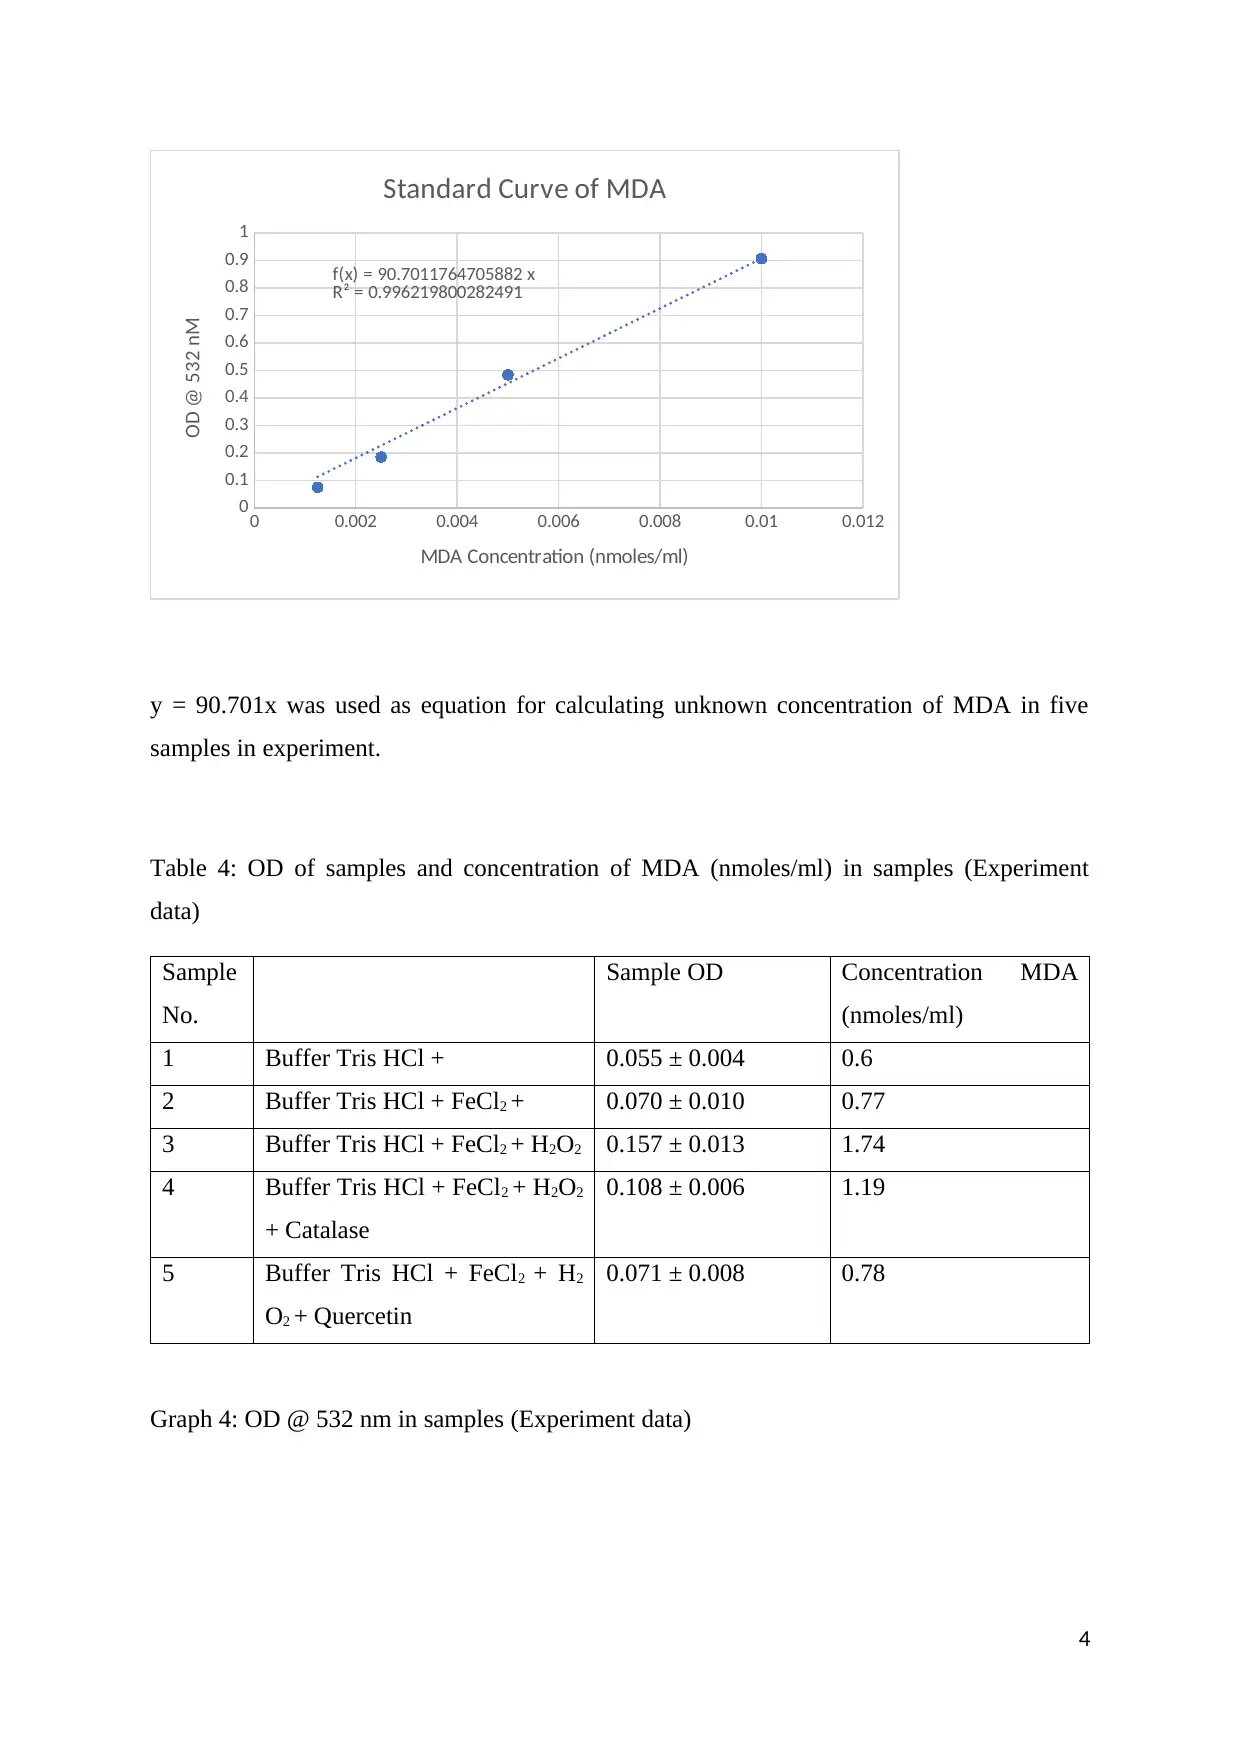
Standard curve was prepared at concentrations 1.25, 2.5, 5, and 10 nmoles/ml of MDA.
Obtained R2 values for this standard curve was 0.99.
Table 3: Standard curve of MDA (Experiment data)
Graph 3: Standard curve of MDA (Experiment data)
3
MDA concentration
(nmoles/ml) OD @ 532 nM
1.25 0.075
2.5 0.185
5 0.484
10 0.907
Graph 2: Concertation of MDA (nmole/ml) in samples (Class data)
1 2 3 4 5
0
0.5
1
1.5
2
2.5
3
3.5
4
Concentraton of MDA (nmole/ml)
Sample Number
MDA (nmole/ml)
Standard curve was prepared at concentrations 1.25, 2.5, 5, and 10 nmoles/ml of MDA.
Obtained R2 values for this standard curve was 0.99.
Table 3: Standard curve of MDA (Experiment data)
Graph 3: Standard curve of MDA (Experiment data)
3
MDA concentration
(nmoles/ml) OD @ 532 nM
1.25 0.075
2.5 0.185
5 0.484
10 0.907
0 0.002 0.004 0.006 0.008 0.01 0.012
0
0.1
0.2
0.3
0.4
0.5
0.6
0.7
0.8
0.9
1
f(x) = 90.7011764705882 x
R² = 0.996219800282491
Standard Curve of MDA
MDA Concentration (nmoles/ml)
OD @ 532 nM
y = 90.701x was used as equation for calculating unknown concentration of MDA in five
samples in experiment.
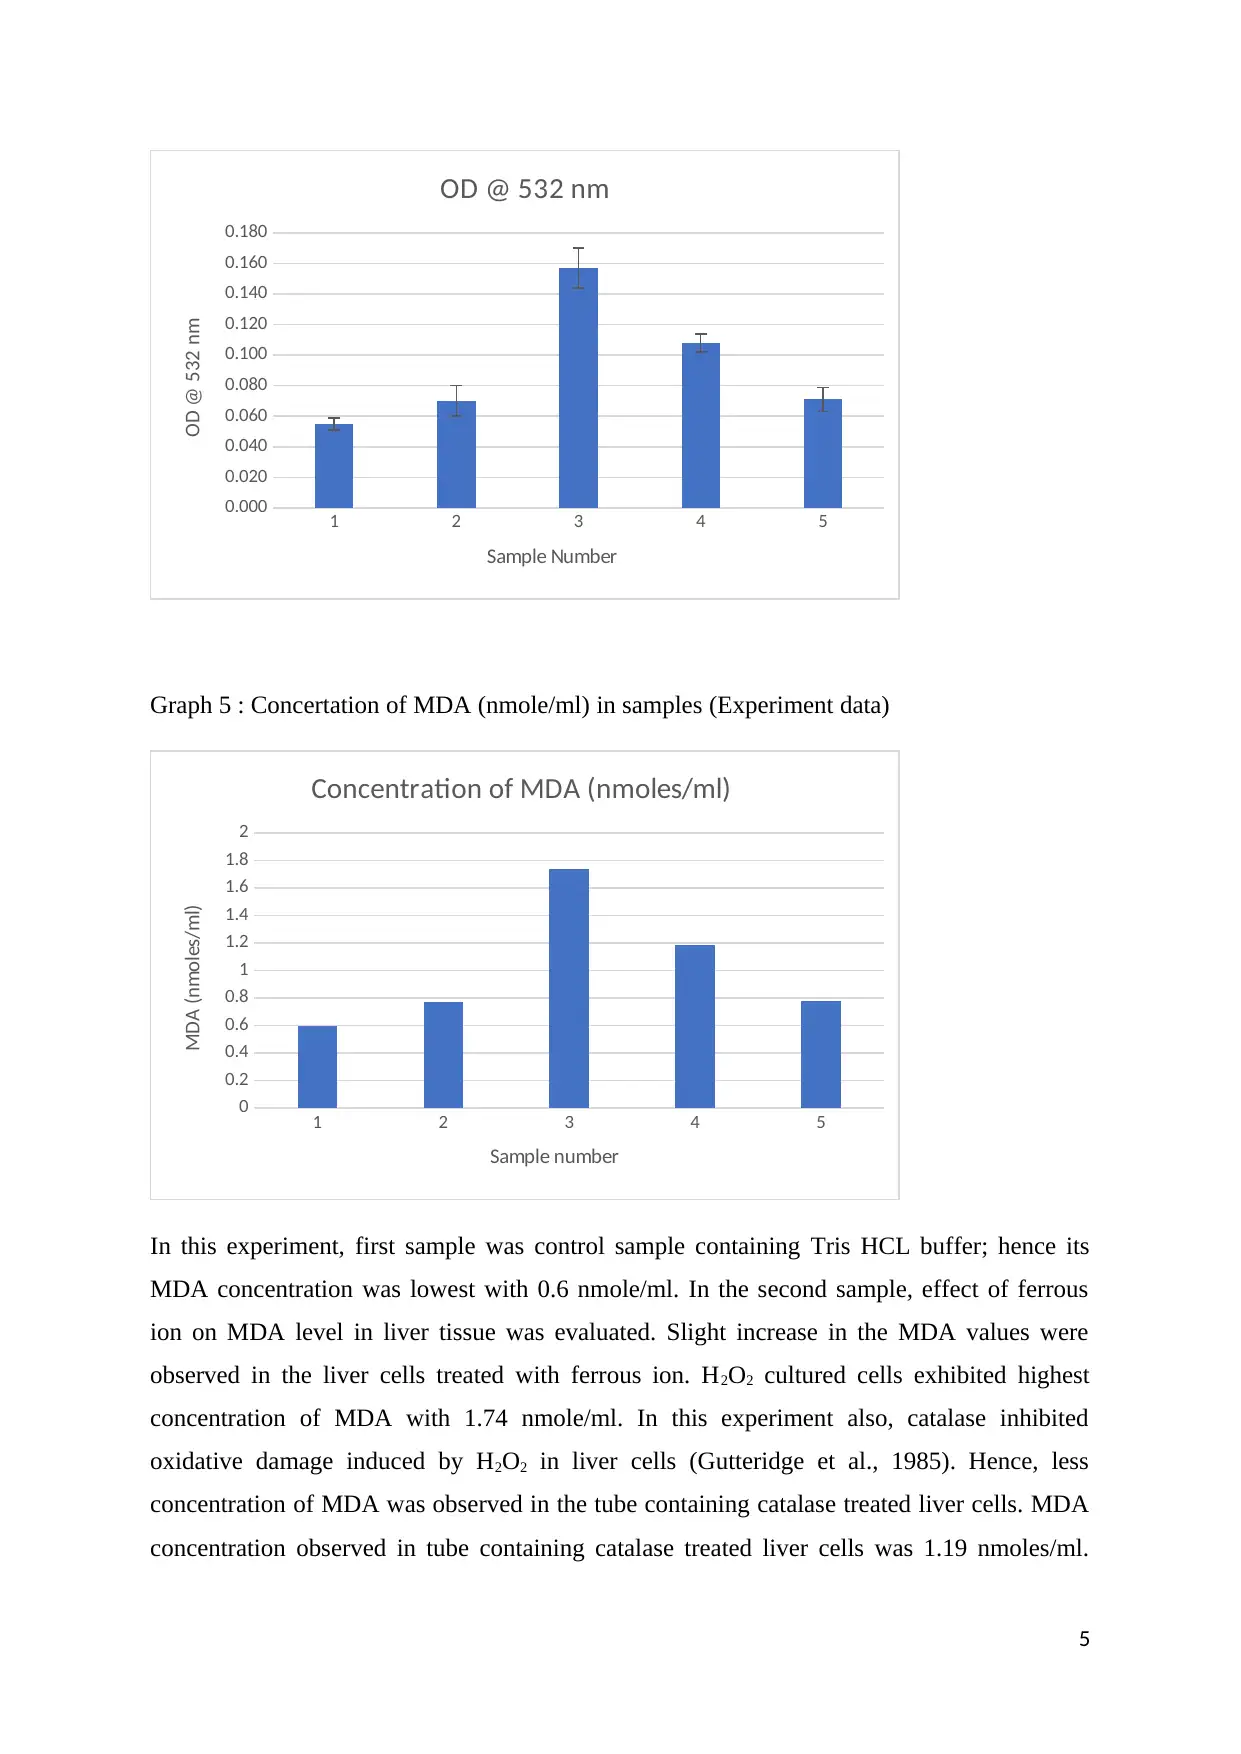
Table 4: OD of samples and concentration of MDA (nmoles/ml) in samples (Experiment
data)
Sample
No.
Sample OD Concentration MDA
(nmoles/ml)
1 Buffer Tris HCl + 0.055 ± 0.004 0.6
2 Buffer Tris HCl + FeCl2 + 0.070 ± 0.010 0.77
3 Buffer Tris HCl + FeCl2 + H2O2 0.157 ± 0.013 1.74
4 Buffer Tris HCl + FeCl2 + H2O2
+ Catalase
0.108 ± 0.006 1.19
5 Buffer Tris HCl + FeCl2 + H2
O2 + Quercetin
0.071 ± 0.008 0.78
Graph 4: OD @ 532 nm in samples (Experiment data)
4
0
0.1
0.2
0.3
0.4
0.5
0.6
0.7
0.8
0.9
1
f(x) = 90.7011764705882 x
R² = 0.996219800282491
Standard Curve of MDA
MDA Concentration (nmoles/ml)
OD @ 532 nM
y = 90.701x was used as equation for calculating unknown concentration of MDA in five
samples in experiment.
Table 4: OD of samples and concentration of MDA (nmoles/ml) in samples (Experiment
data)
Sample
No.
Sample OD Concentration MDA
(nmoles/ml)
1 Buffer Tris HCl + 0.055 ± 0.004 0.6
2 Buffer Tris HCl + FeCl2 + 0.070 ± 0.010 0.77
3 Buffer Tris HCl + FeCl2 + H2O2 0.157 ± 0.013 1.74
4 Buffer Tris HCl + FeCl2 + H2O2
+ Catalase
0.108 ± 0.006 1.19
5 Buffer Tris HCl + FeCl2 + H2
O2 + Quercetin
0.071 ± 0.008 0.78
Graph 4: OD @ 532 nm in samples (Experiment data)
4
Paraphrase This Document
Need a fresh take? Get an instant paraphrase of this document with our AI Paraphraser
1 2 3 4 5
0.000
0.020
0.040
0.060
0.080
0.100
0.120
0.140
0.160
0.180
OD @ 532 nm
Sample Number
OD @ 532 nm
Graph 5 : Concertation of MDA (nmole/ml) in samples (Experiment data)
1 2 3 4 5
0
0.2
0.4
0.6
0.8
1
1.2
1.4
1.6
1.8
2
Concentration of MDA (nmoles/ml)
Sample number
MDA (nmoles/ml)
In this experiment, first sample was control sample containing Tris HCL buffer; hence its
MDA concentration was lowest with 0.6 nmole/ml. In the second sample, effect of ferrous
ion on MDA level in liver tissue was evaluated. Slight increase in the MDA values were
observed in the liver cells treated with ferrous ion. H2O2 cultured cells exhibited highest
concentration of MDA with 1.74 nmole/ml. In this experiment also, catalase inhibited
oxidative damage induced by H2O2 in liver cells (Gutteridge et al., 1985). Hence, less
concentration of MDA was observed in the tube containing catalase treated liver cells. MDA
concentration observed in tube containing catalase treated liver cells was 1.19 nmoles/ml.
5
Antioxidant like quercetin inhibited MDA concentration in the oxidised liver tissue. In the
test tube containing antioxidant like quercetin, MDA concentration was reduced to 0.78
nmoles/ml. Obtained MDA values in control, ferrous, H2O2, catalase and quercetin groups
were 1.6, 2.1, 3.6, 2.2 and 2.0 nmoles/ml respectively from the class data.
Discussion:
Fenton reaction involves Fenton’s reagent consisting of hydrogen peroxide with ferrous iron
as catalyst. Hydrogen peroxide oxidises iron (II) to iron (III) which lead to formation of
hydroxyl radical (HO.) and hydroxide ion. In turn, hydrogen peroxide produces hydroperoxyl
radical (HOO.) and proton. Hence, hydrogen peroxide produces two different oxygen radicals
like hydroxyl radical (HO.) and hydroperoxyl radical (HOO.). Generated free radicals
produce secondary reactions (Götz et al., 1993). Hydroxyl is a powerful and non-selective
oxidant. Fenton reaction has special significance in biology and medical science because it
generates free radicals available in the body. In biological system, superoxide ion and
transition ion act in synergistic manner to produce free radical induced damage. Ferric ion is
responsible to initiate lipid peroxidation in the presence of reducing agent. Superoxide ion
generated through xanthine or hypoxanthine reaction with xanthine oxidase act as reducing
agent (Barroso et al., 2018). In most of Fenton reactions, O2 or H2O2 act as oxidants. Both
ferrous ion and H2O2 are responsible for the lipid peroxidation in the Fenton reaction. Iron-
oxygen complex (Fe4+0 or FeOH3+) derived from OH. and Fe3+ can act as oxidising agent. In
this experiment, Fenton reaction was performed to produce lipid peroxidation (Sewerynek et
al., 1995). Chain of reactions in Fenton reactions increase MDA levels. Hence, in this
experiment lipid peroxidation which involves Fenton reaction increases amount of MDA in
the H2O2 treated liver cells tube.
Antioxidants prevent lipid peroxidation by preventing, delaying or inhibiting oxidation of
oxidising substrates. Antioxidants exhibit these effects through different mechanisms like
scavenging free radicals, chelating peroxidative metals and quenching singlet oxygen.
Antioxidants exhibit free radicals scavenging activity by donating hydrogen which lead to
production of stable antioxidant radicals (Guesmi et al., 2019). Metals catalyse free radical
formation through abstracting hydrogen. Metals also produce hydroxy radicals through
catalysing decomposition of hydrogen peroxide available in the Fenton reagent. Metal
chelators exhibit antioxidant activity by averting metal redox cycling, generating insoluble
metal complexes, or providing steric hindrance between metals and food components or their
6
oxidation intermediates. Singlet oxygen reacts with lipids at higher rate in comparison to the
triplet oxygen. Singlet oxygen quenching exhibit antioxidant potential through both physical
and chemical quenching. In physical quenching, there is neither oxygen consumption not
product formation. In chemical quenching, there is oxidation of quencher (Maffei et al.,
1995).
Lipid peroxidation involves oxidative degradation of lipids. Lipoxygenase plays role as
catalyst in the oxidation of lipids. Antioxidant exhibit inhibitory activity on the lipoxygenase
enzyme to prevent oxidative degradation of the lipids. Two or more antioxidants with
different mechanism of action exhibit synergistic antioxidant action. Regeneration of more
powerful free radical scavenger occurs with the help of less powerful free radical scavenger
when one of the free radical scavengers have more reduction potential. It is evident that
regeneration of powerful free radical scavenger produces net effect more in comparison to the
simple addition effect. Metal chelators in combination with free radical scavenger exhibit
synergistic effect for the antioxidant potential. Polyunsaturated fatty acids undergo rapid lipid
peroxidation. Antioxidants restore cell proliferation by inhibiting lipid peroxidation
(Karbownik and Lewiński, 2003; Gutteridge, 1986). In this experiment, antioxidants like
quercetin and α- tocopherol were evaluated for producing antioxidants effects. Antioxidant
effect of quercetin was demonstrated through reduced levels of MDA in antioxidant treated
tubes in comparison to the H2O2 treated samples. However, this experiment is not useful in
elucidating mechanism of action of these antioxidants.
Results obtained in the current experiment were in agreement with the experiments available
in the literature. According to the literature experiments, it was evident that MDA values
increase in the H2O2 treated samples and MDA values decrease in the antioxidant treated
samples (Karbownik and Lewiński, 2003; Barroso et al., 2018). Hence, it can be concluded
that current experiment was performed accurately and it can be considered as the valid
experiment. Trend of results with respect to control and treatment groups is similar in both
class data and experimental data. However, measured concentration of MDA in class data
was more in class data in comparison to the experimental data.
Standard curve of class data can be considered as the better standard curve in comparison to
the standard curve obtained in the experiment because R2 value obtained in the standard curve
provided by class was 0.9718 and R2 value obtained in the experimental standard curve was
0.99. In this experiment, standard curve was prepared at five concentrations. Standard curve
7
Secure Best Marks with AI Grader
Need help grading? Try our AI Grader for instant feedback on your assignments.
prepared at minimum six concentrations would have improved validity of these results.
Standard curve would have been prepared in triplicates and average of three readings would
have been taken. In the similar manner, analysis of samples would have been performed in
triplicate.
Conclusion:
In this experiment, a simple and sensitive spectrophotometric method was developed for the
estimation of MDA in the liver tissues. Developed method was based on the Fenton reaction.
Fenton reaction is based on the lipid peroxidation and it is known as TBA test. This method
can be successfully implemented for the determination of the MDA in other tissue samples
with slight modifications in the preparation of the tissue samples. Moreover, this method can
also be used for evaluation of effect of antioxidants for reversing oxidative tissue damage. In
this report, data from the class and experiment were compared. However, slight variation was
observed in the MDA values. Hence, this assay need to be repeated at least seven times and
take average to estimate accurate amount of MDA values. In summary, this experiment is
applicable in understanding biology of the disease.
8
References:
Barroso, M.F., Luna, M.A., Moyano, F., Delerue-Matos, C., Correa, N.M., and Molina, P.G.
(2018) Study of lipid peroxidation and ascorbic acid protective role in large unilamellar
vesicles from a new electrochemical performance. Bioelectrochemistry. 120, pp. 120-126.
Garcia, Y.J., Rodríguez-Malaver, A.J., and Peñaloza, N. (2005) Lipid peroxidation
measurement by thiobarbituric acid assay in rat cerebellar slices. Journal of Neuroscience
Methods. 144(1), pp. 127-35.
Götz, M.E., Dirr, A., Freyberger, A., Burger, R., and Riederer, P. (1993) The thiobarbituric
acid assay reflects susceptibility to oxygen induced lipid peroxidation in vitro rather than
levels of lipid hydroperoxides in vivo: a methodological approach. Neurochemistry
International. 22(3), pp. 255-62.
Karbownik, M., and Lewiński, A. (2003) Melatonin reduces Fenton reaction-induced lipid
peroxidation in porcine thyroid tissue. Journal of Cellular Biochemistry. 90(4), pp. 806-11.
Kirkpatrick, D.T., Guth, D.J., and Mavis, R.D. (1986) Detection of in vivo lipid peroxidation
using the thiobarbituric acid assay for lipid hydroperoxides. Journal of Biochemical
Toxicology.1(1), pp. 93-104.
Maffei Facino, R., Carini, M., Aldini, G., Saibene, L., and Morelli, R. (1995) Differential
inhibition of superoxide, hydroxyl and peroxyl radicals by nimesulide and its main metabolite
4-hydroxynimesulide. Arzneimittelforschung. 45(10), pp. 1102-9.
Guesmi, F., Khantouche, L., Mehrez, A., Bellamine, H., and Landoulsi, A. (2019)
Histopathological and Biochemical Effects of Thyme Essential Oil on H2O2 Stress in Heart
Tissues. Heart, Lung and Circulation. 22. pii: S1443-9506(19)30030-7.
Gutteridge, J.M. (1986) Iron promoters of the Fenton reaction and lipid peroxidation can be
released from haemoglobin by peroxides. FEBS Letters. 201(2), pp. 291-5.
Gutteridge, J.M., Beard, A.P., and Quinlan, G.J. (1985) Catalase enhances damage to DNA
by bleomycin-iron(II): the role of hydroxyl radicals. Biochemistry international. 10(3), pp.
441-9.
Sewerynek, E., Poeggeler, B., Melchiorri, D., and Reiter, R.J. (1995) H2O2-induced lipid
peroxidation in rat brain homogenates is greatly reduced by melatonin. Neuroscience Letters.
195(3), pp. 203-5.
9
1 out of 12
Related Documents

Your All-in-One AI-Powered Toolkit for Academic Success.
+13062052269
info@desklib.com
Available 24*7 on WhatsApp / Email
![[object Object]](/_next/static/media/star-bottom.7253800d.svg)
Unlock your academic potential
© 2024 | Zucol Services PVT LTD | All rights reserved.