PHC 121 - Biostatistical Analysis Assignment: CHD and Smoking
VerifiedAdded on 2022/09/18
|6
|1176
|40
Homework Assignment
AI Summary
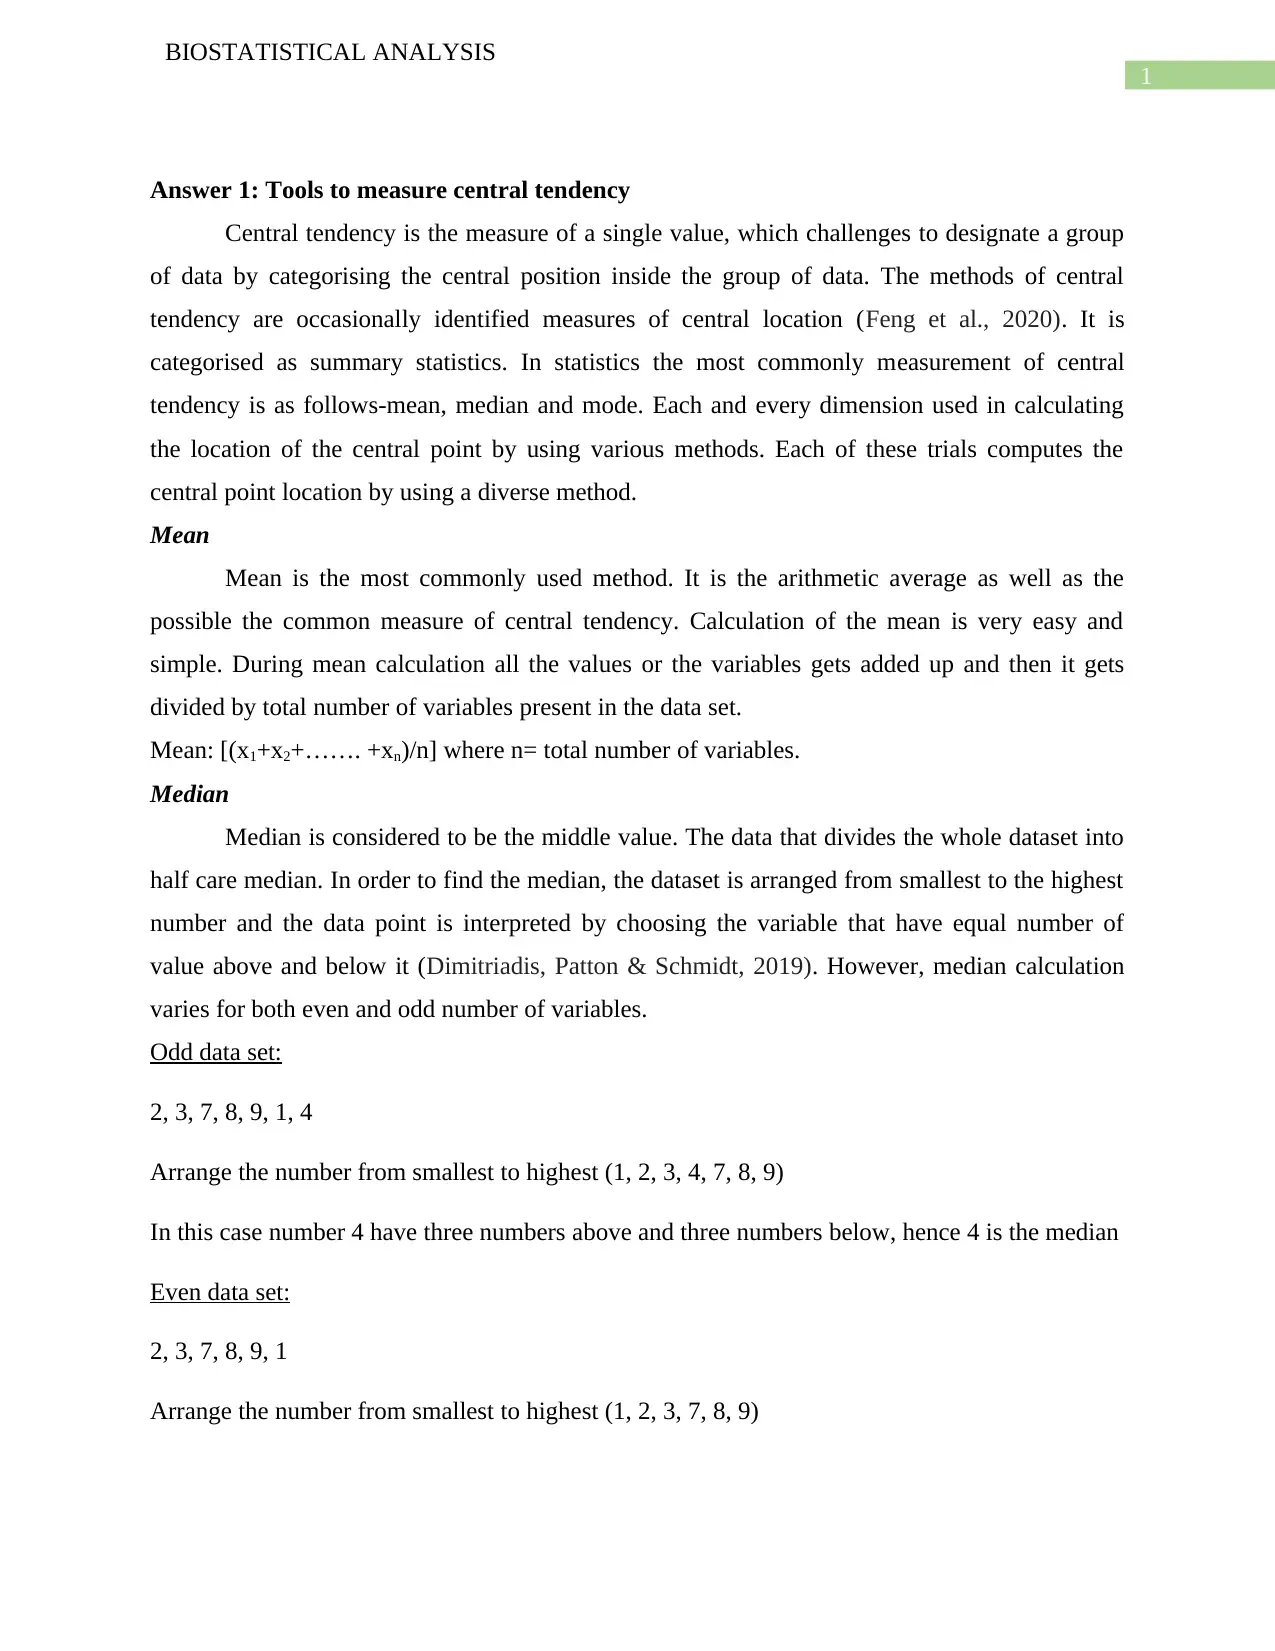
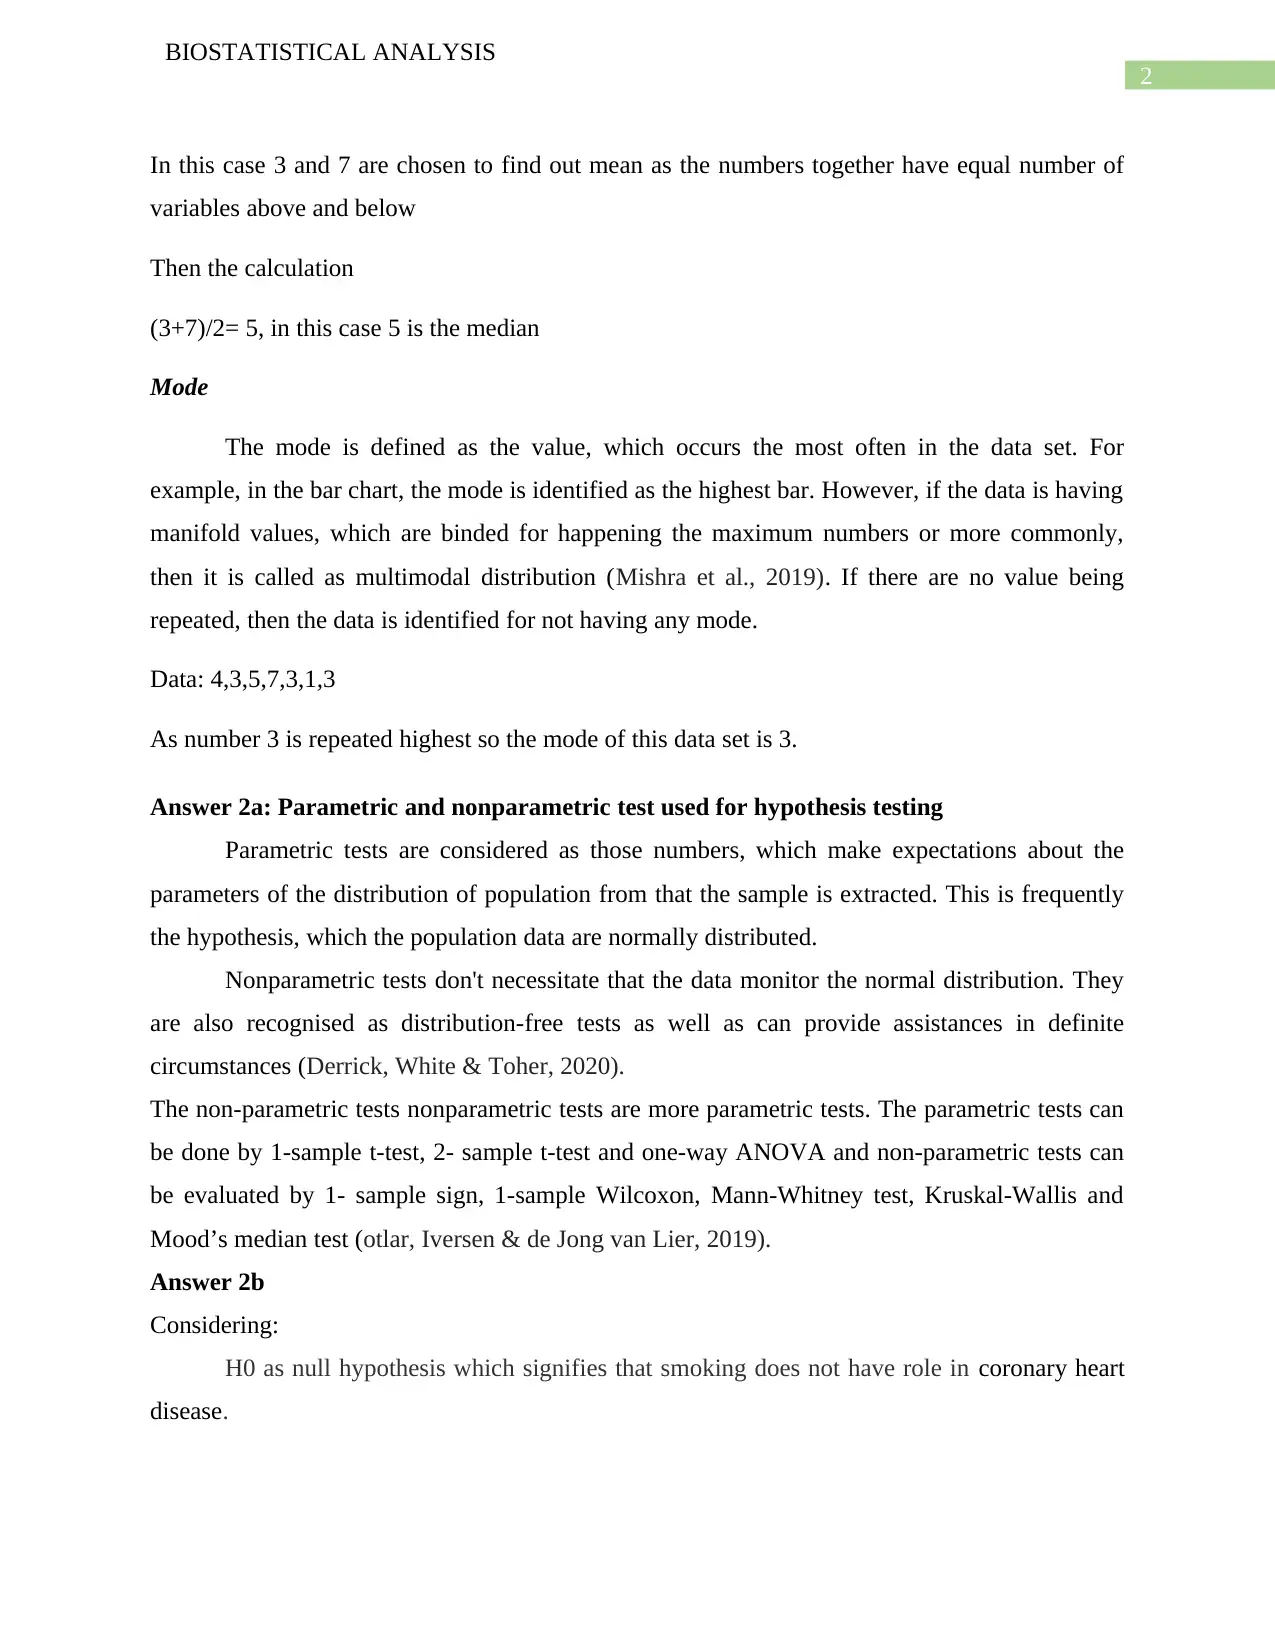
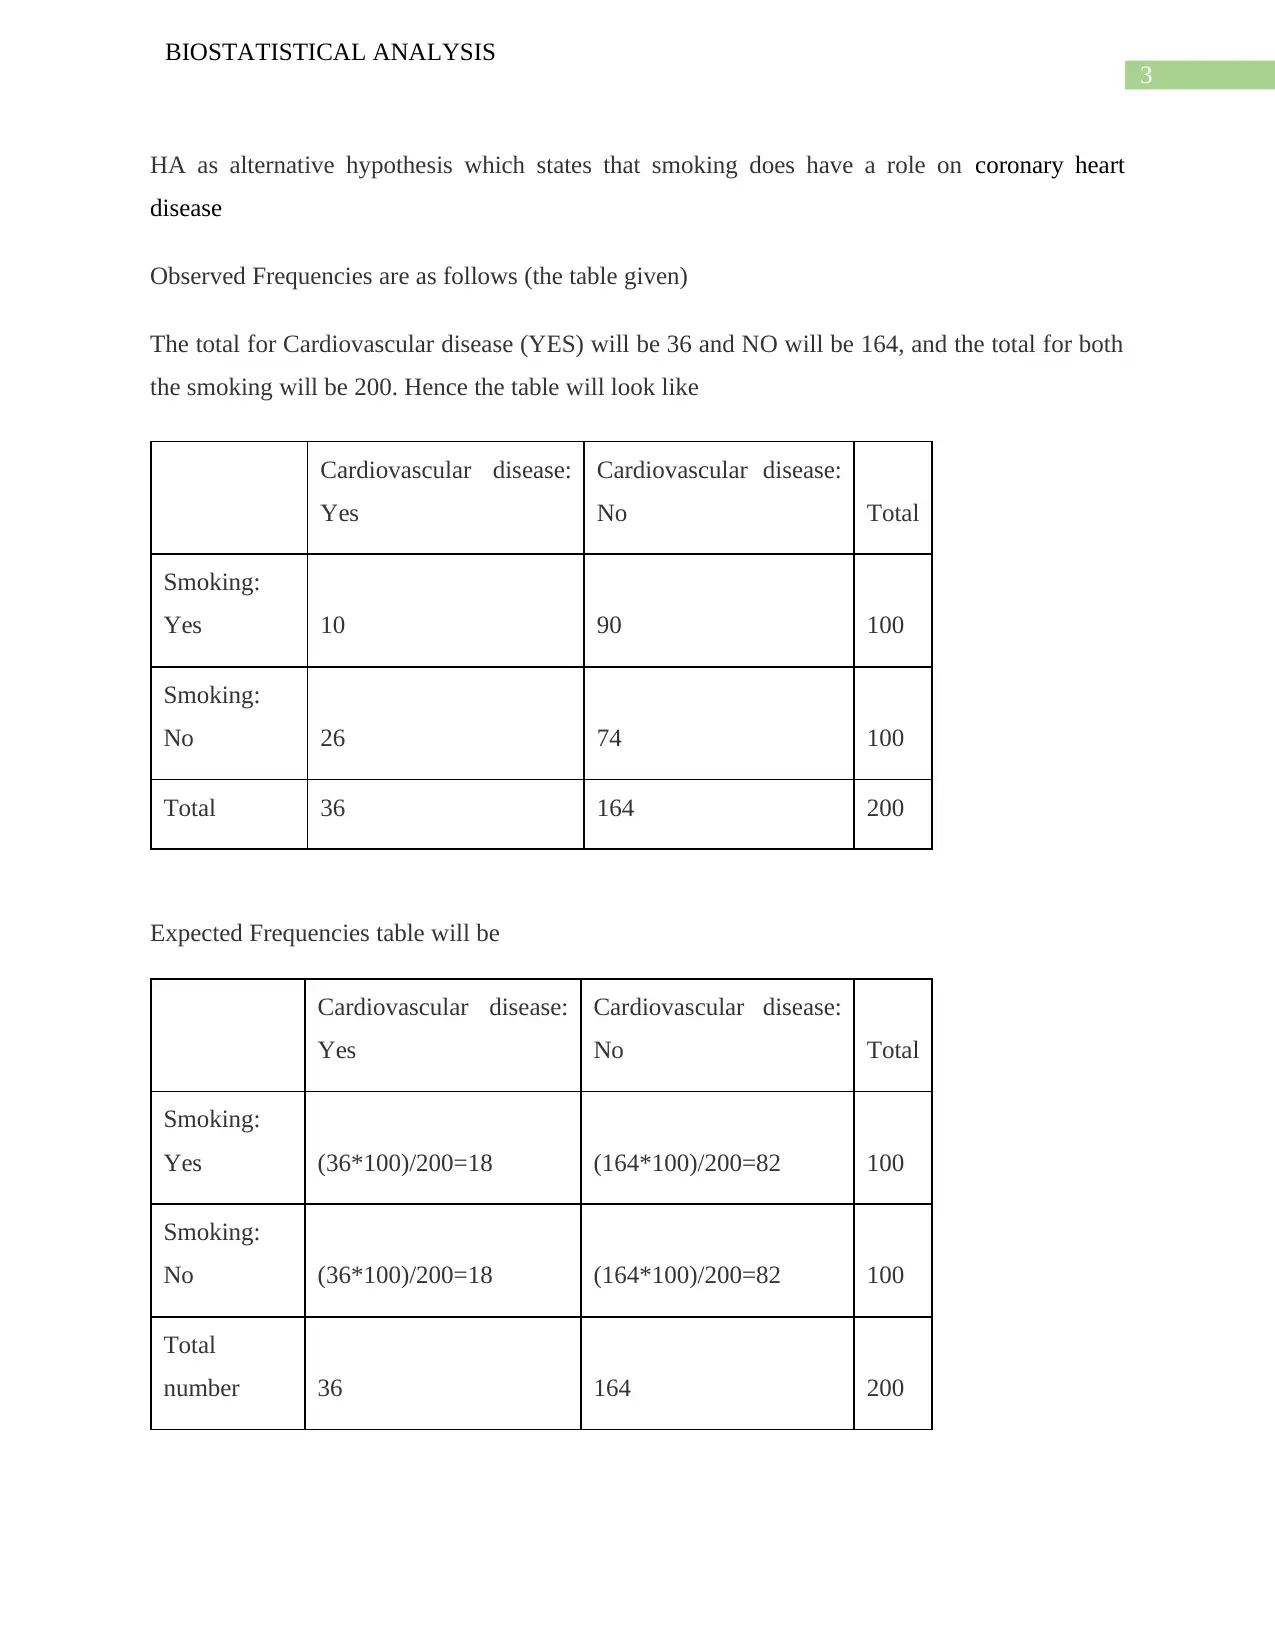
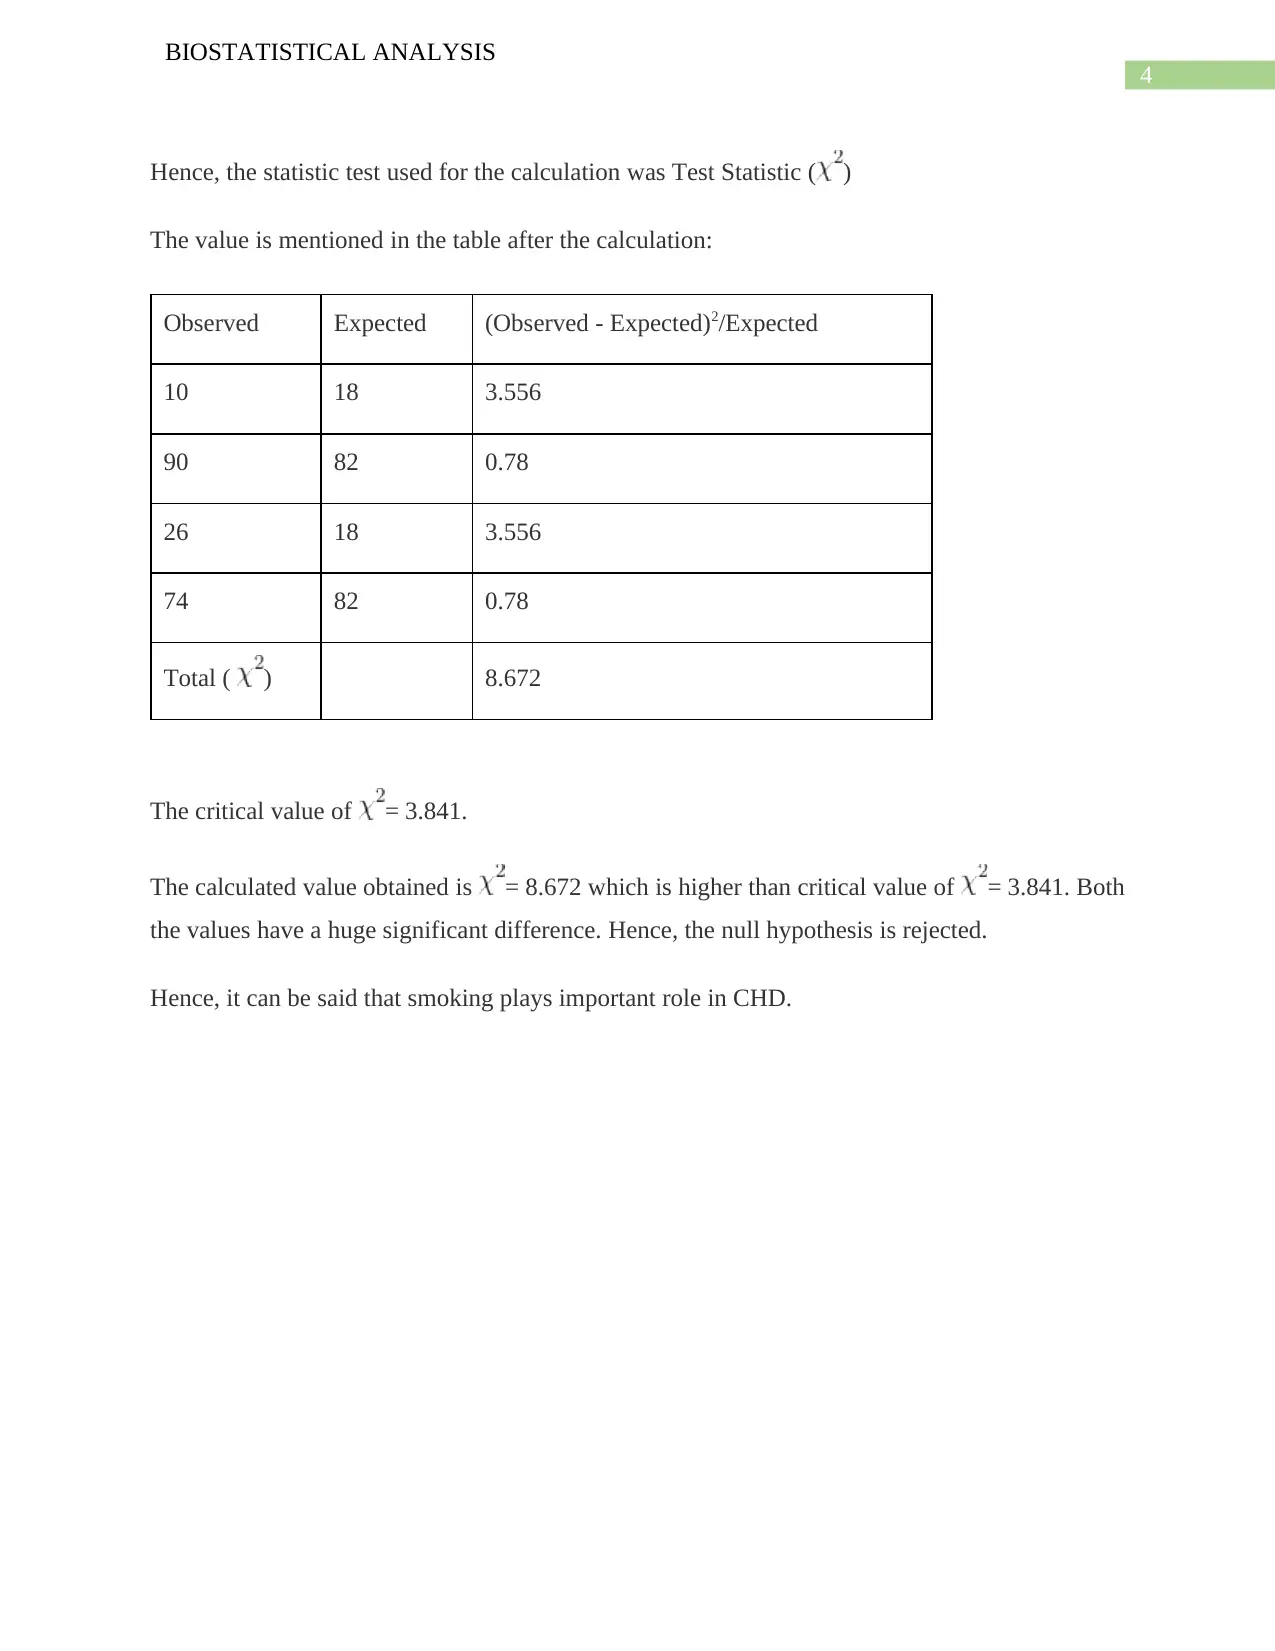
This assignment provides a comprehensive analysis of biostatistical concepts. It begins by discussing tools for measuring central tendency, including mean, median, and mode. The assignment then delves into hypothesis testing, differentiating between parametric and nonparametric tests and providing examples of each. Finally, the assignment applies these concepts to a cross-sectional study on coronary heart disease (CHD), analyzing the relationship between smoking and CHD using an appropriate statistical test, including observed and expected frequencies, and calculating the test statistic to reject or fail to reject the null hypothesis. The assignment concludes that smoking plays an important role in CHD based on the chi-square test results.

Running head: BIOSTATISTICAL ANALYSIS
BIOSTATISTICAL ANALYSIS
Name of the Student
Name of the University
Author note
BIOSTATISTICAL ANALYSIS
Name of the Student
Name of the University
Author note
Paraphrase This Document
Need a fresh take? Get an instant paraphrase of this document with our AI Paraphraser

1
BIOSTATISTICAL ANALYSIS
Answer 1: Tools to measure central tendency
Central tendency is the measure of a single value, which challenges to designate a group
of data by categorising the central position inside the group of data. The methods of central
tendency are occasionally identified measures of central location (Feng et al., 2020). It is
categorised as summary statistics. In statistics the most commonly measurement of central
tendency is as follows-mean, median and mode. Each and every dimension used in calculating
the location of the central point by using various methods. Each of these trials computes the
central point location by using a diverse method.
Mean
Mean is the most commonly used method. It is the arithmetic average as well as the
possible the common measure of central tendency. Calculation of the mean is very easy and
simple. During mean calculation all the values or the variables gets added up and then it gets
divided by total number of variables present in the data set.
Mean: [(x1+x2+……. +xn)/n] where n= total number of variables.
Median
Median is considered to be the middle value. The data that divides the whole dataset into
half care median. In order to find the median, the dataset is arranged from smallest to the highest
number and the data point is interpreted by choosing the variable that have equal number of
value above and below it (Dimitriadis, Patton & Schmidt, 2019). However, median calculation
varies for both even and odd number of variables.
Odd data set:
2, 3, 7, 8, 9, 1, 4
Arrange the number from smallest to highest (1, 2, 3, 4, 7, 8, 9)
In this case number 4 have three numbers above and three numbers below, hence 4 is the median
Even data set:
2, 3, 7, 8, 9, 1
Arrange the number from smallest to highest (1, 2, 3, 7, 8, 9)

2
BIOSTATISTICAL ANALYSIS
In this case 3 and 7 are chosen to find out mean as the numbers together have equal number of
variables above and below
Then the calculation
(3+7)/2= 5, in this case 5 is the median
Mode
The mode is defined as the value, which occurs the most often in the data set. For
example, in the bar chart, the mode is identified as the highest bar. However, if the data is having
manifold values, which are binded for happening the maximum numbers or more commonly,
then it is called as multimodal distribution (Mishra et al., 2019). If there are no value being
repeated, then the data is identified for not having any mode.
Data: 4,3,5,7,3,1,3
As number 3 is repeated highest so the mode of this data set is 3.
Answer 2a: Parametric and nonparametric test used for hypothesis testing
Parametric tests are considered as those numbers, which make expectations about the
parameters of the distribution of population from that the sample is extracted. This is frequently
the hypothesis, which the population data are normally distributed.
Nonparametric tests don't necessitate that the data monitor the normal distribution. They
are also recognised as distribution-free tests as well as can provide assistances in definite
circumstances (Derrick, White & Toher, 2020).
The non-parametric tests nonparametric tests are more parametric tests. The parametric tests can
be done by 1-sample t-test, 2- sample t-test and one-way ANOVA and non-parametric tests can
be evaluated by 1- sample sign, 1-sample Wilcoxon, Mann-Whitney test, Kruskal-Wallis and
Mood’s median test (otlar, Iversen & de Jong van Lier, 2019).
Answer 2b
Considering:
H0 as null hypothesis which signifies that smoking does not have role in coronary heart
disease.
⊘ This is a preview!⊘
Do you want full access?
Subscribe today to unlock all pages.

Trusted by 1+ million students worldwide

3
BIOSTATISTICAL ANALYSIS
HA as alternative hypothesis which states that smoking does have a role on coronary heart
disease
Observed Frequencies are as follows (the table given)
The total for Cardiovascular disease (YES) will be 36 and NO will be 164, and the total for both
the smoking will be 200. Hence the table will look like
Cardiovascular disease:
Yes
Cardiovascular disease:
No Total
Smoking:
Yes 10 90 100
Smoking:
No 26 74 100
Total 36 164 200
Expected Frequencies table will be
Cardiovascular disease:
Yes
Cardiovascular disease:
No Total
Smoking:
Yes (36*100)/200=18 (164*100)/200=82 100
Smoking:
No (36*100)/200=18 (164*100)/200=82 100
Total
number 36 164 200
Paraphrase This Document
Need a fresh take? Get an instant paraphrase of this document with our AI Paraphraser

4
BIOSTATISTICAL ANALYSIS
Hence, the statistic test used for the calculation was Test Statistic ( )
The value is mentioned in the table after the calculation:
Observed Expected (Observed - Expected)2/Expected
10 18 3.556
90 82 0.78
26 18 3.556
74 82 0.78
Total ( ) 8.672
The critical value of = 3.841.
The calculated value obtained is = 8.672 which is higher than critical value of = 3.841. Both
the values have a huge significant difference. Hence, the null hypothesis is rejected.
Hence, it can be said that smoking plays important role in CHD.

5
BIOSTATISTICAL ANALYSIS
References
Derrick, B., White, P., & Toher, D. (2020). Parametric and non-parametric tests for the
comparison of two samples which both include paired and unpaired observations.
Journal of Modern Applied Statistical Methods, 18(1), 9.
Dimitriadis, T., Patton, A. J., & Schmidt, P. (2019). Testing Forecast Rationality for Measures of
Central Tendency. arXiv preprint arXiv:1910.12545.
Feng, J., Zhang, J., Toth, Z., Peña, M., & Ravela, S. (2020). A New Measure of Ensemble
Central Tendency. Weather and Forecasting, (2020).
Kotlar, A. M., Iversen, B. V., & de Jong van Lier, Q. (2019). Evaluation of parametric and
nonparametric machine-learning techniques for prediction of saturated and near-saturated
hydraulic conductivity. Vadose Zone Journal, 18(1).
Mishra, P., Pandey, C. M., Singh, U., Gupta, A., Sahu, C., & Keshri, A. (2019). Descriptive
statistics and normality tests for statistical data. Annals of cardiac anaesthesia, 22(1), 67.
⊘ This is a preview!⊘
Do you want full access?
Subscribe today to unlock all pages.

Trusted by 1+ million students worldwide
1 out of 6
Related Documents
Your All-in-One AI-Powered Toolkit for Academic Success.
+13062052269
info@desklib.com
Available 24*7 on WhatsApp / Email
Unlock your academic potential
Copyright © 2020–2026 A2Z Services. All Rights Reserved. Developed and managed by ZUCOL.


