Biostatistics Assignment 2
VerifiedAdded on 2022/11/25
|12
|1713
|362
AI Summary
This document is a biostatistics assignment that includes a study on dyslipidaemia in diabetes. It covers variables used in the data analysis, comparative analysis of dyslipidaemia and non-dyslipidaemia populations, graphical representations of data trends, statistical analysis of drug intervention and systolic blood pressure, and ANOVA analysis of systolic blood pressure among different BMI levels.
Contribute Materials
Your contribution can guide someone’s learning journey. Share your
documents today.

Running head: BIOSTATISTICS ASSIGNMENT 2
Biostatistics Assignment 2
Name of the Student
Name of the University
Author note
Biostatistics Assignment 2
Name of the Student
Name of the University
Author note
Secure Best Marks with AI Grader
Need help grading? Try our AI Grader for instant feedback on your assignments.

1BIOSTATISTICS ASSIGNMENT 2
Part 1: Dyslipidaemia Study in Diabetes
Question 1
In the following table the variables used in this data analysis database have been presented
with the classification of the variable along with the variable label.
Variable Classification Variable Label
ID Discrete ID Number
Age Continuous ID Number
Age_gr Ordinal Age Group
Gender Nominal Gender
Occupation Ordinal Occupation type
Physical_activity Nominal Physical activity level
weight Continuous Weight in Kg
Height Continuous Height in meter
BMI Discrete BMI in Kg/m2
BMI_gr Ordinal BMI Group
BP_diastolic Discrete Diastolic BP
BP_systolic Discrete Systolic BP
HTN Nominal Hypertension
Duration_diabetes Discrete Duration of Diabetes
Duration_diabetes_gr Ordinal Duration of Diabetes Group
HbA1c Discrete HbA1c
HbA1c_gr Nominal HbA1c group
Insulin Nominal Takes insulin
Duration_insulin Discrete Duration of insulin (years)
T.Chol Discrete Total Cholesterol
T_Chol_gr Nominal Total Cholesterol group
TG Discrete Triglyceride
TG_gr Nominal Triglyceride group
HDL Discrete HDL Cholesterol
HDL_gr Nominal HDL Cholesterol group
2BIOSTATISTICS ASSIGNMENT 2
LDL Discrete LDL Cholesterol
LDL_gr Nominal LDL Cholesterol group
Creatinine Discrete Serum Creatinine
Createnine_gr Nominal Serum Creatinine
TC_HDL Discrete TC_HDL ratio
LDL_HDL Discrete LDL_HDL ratio
Dyslipidemia Nominal Dyslipidaemia
Question 2
Variable Dyslipidaemia (% or median & IQR or mean & SD)
Yes No
HbA1c Mean: 10.9; SD: 4.27 Mean:7.4; SD:1.84
BP diastolic Mean: 81.84; SD: 11.1 Mean: 77; SD: 10.6
Insulin status:
Yes 84.8% 15.2%
No 84.2% 15.8%
Age group:
< 40 yrs. 81% 19%
40 - 49 yrs. 87.4% 12.6%
50 - 59 82.2% 17.8%
≥ 60 yrs. 89.7% 10.3%
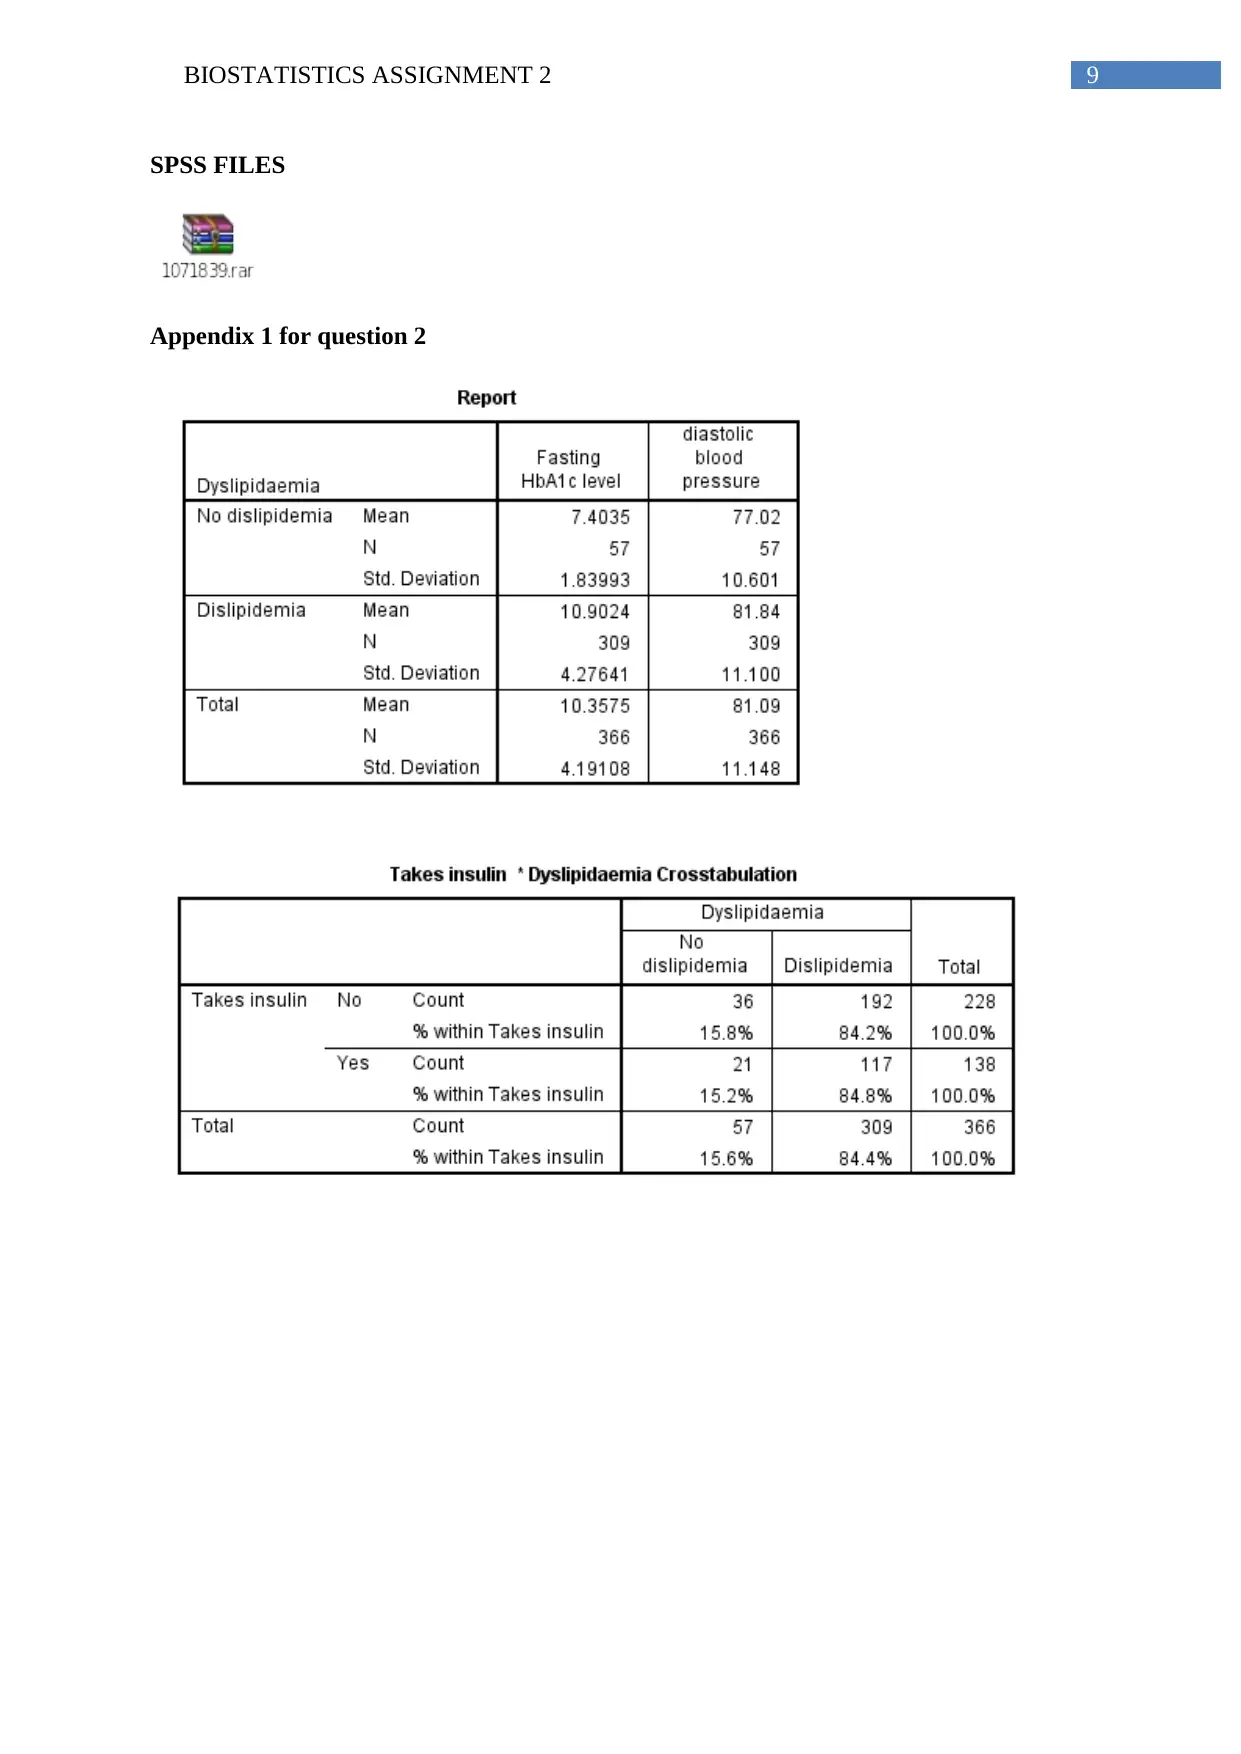
From the above data analysis and presentation in tabular form it can be interpreted that the
level of HbA1c is apparently higher in the population who are suffering from the
Dyslipidaemia. The diasolic Blood Pressure is also higher in the population who are suffering from
the Dyslipidaemia than the population who are not suffering from the Dyslipidaemia. It has been
found that percentage of people taken insulin and also suffering from Dyslipidaemia is comparatively
higher than the percentage of people have not taken insulin. From the above analysis it can be
interpreted that with the increasing age the prevalence of suffering from Dyslipidaemia also increases.
Question 3
In the following comparative analysis the bar graph has been chosen for graphical
comparison. Comparative bar graph can help to compare the two relative factors and their
ratios visually. Without involving any significance testing the bar graph can be used for
visual guidance of data comparison. These are the reason to choose bar graph based
comparative analysis for the following data analysis part.
LDL Discrete LDL Cholesterol
LDL_gr Nominal LDL Cholesterol group
Creatinine Discrete Serum Creatinine
Createnine_gr Nominal Serum Creatinine
TC_HDL Discrete TC_HDL ratio
LDL_HDL Discrete LDL_HDL ratio
Dyslipidemia Nominal Dyslipidaemia
Question 2
Variable Dyslipidaemia (% or median & IQR or mean & SD)
Yes No
HbA1c Mean: 10.9; SD: 4.27 Mean:7.4; SD:1.84
BP diastolic Mean: 81.84; SD: 11.1 Mean: 77; SD: 10.6
Insulin status:
Yes 84.8% 15.2%
No 84.2% 15.8%
Age group:
< 40 yrs. 81% 19%
40 - 49 yrs. 87.4% 12.6%
50 - 59 82.2% 17.8%
≥ 60 yrs. 89.7% 10.3%
From the above data analysis and presentation in tabular form it can be interpreted that the
level of HbA1c is apparently higher in the population who are suffering from the
Dyslipidaemia. The diasolic Blood Pressure is also higher in the population who are suffering from
the Dyslipidaemia than the population who are not suffering from the Dyslipidaemia. It has been
found that percentage of people taken insulin and also suffering from Dyslipidaemia is comparatively
higher than the percentage of people have not taken insulin. From the above analysis it can be
interpreted that with the increasing age the prevalence of suffering from Dyslipidaemia also increases.
Question 3
In the following comparative analysis the bar graph has been chosen for graphical
comparison. Comparative bar graph can help to compare the two relative factors and their
ratios visually. Without involving any significance testing the bar graph can be used for
visual guidance of data comparison. These are the reason to choose bar graph based
comparative analysis for the following data analysis part.
3BIOSTATISTICS ASSIGNMENT 2
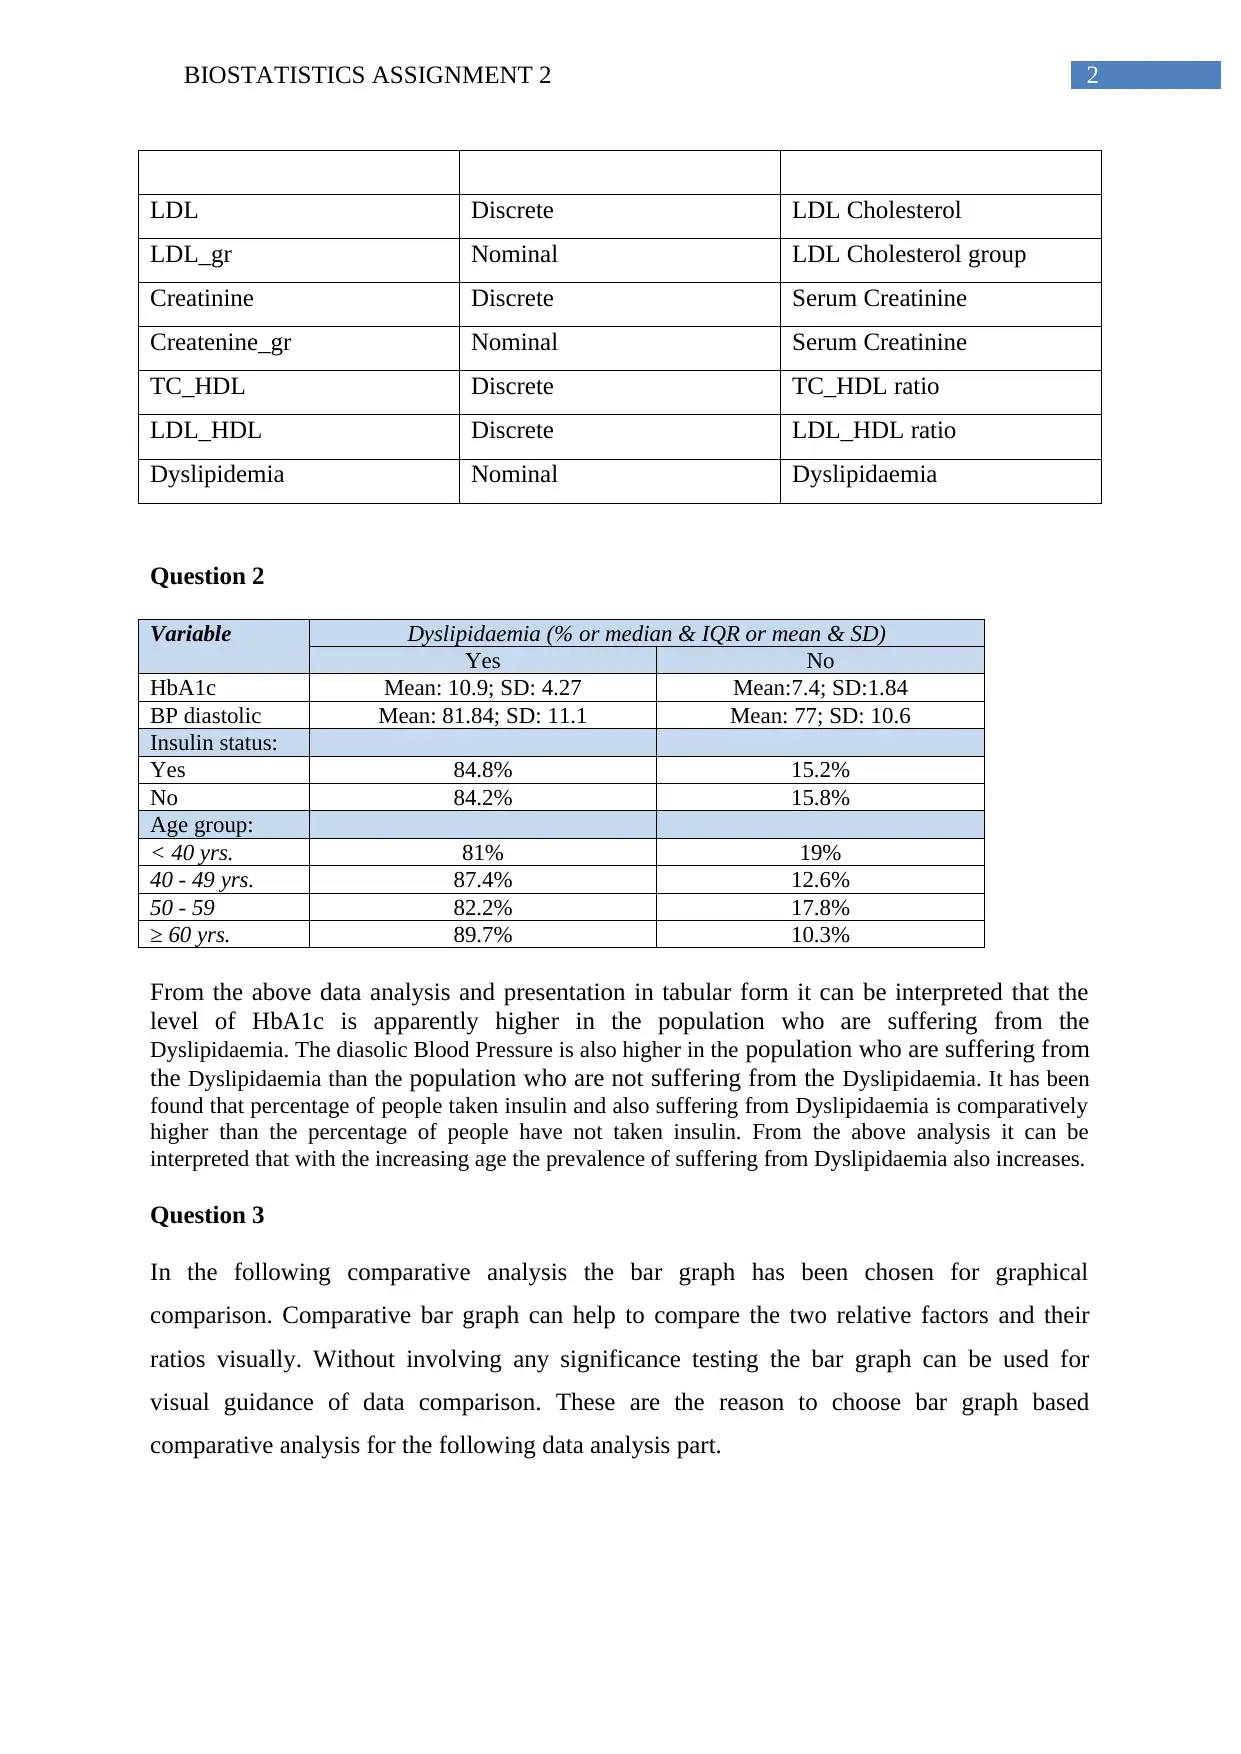
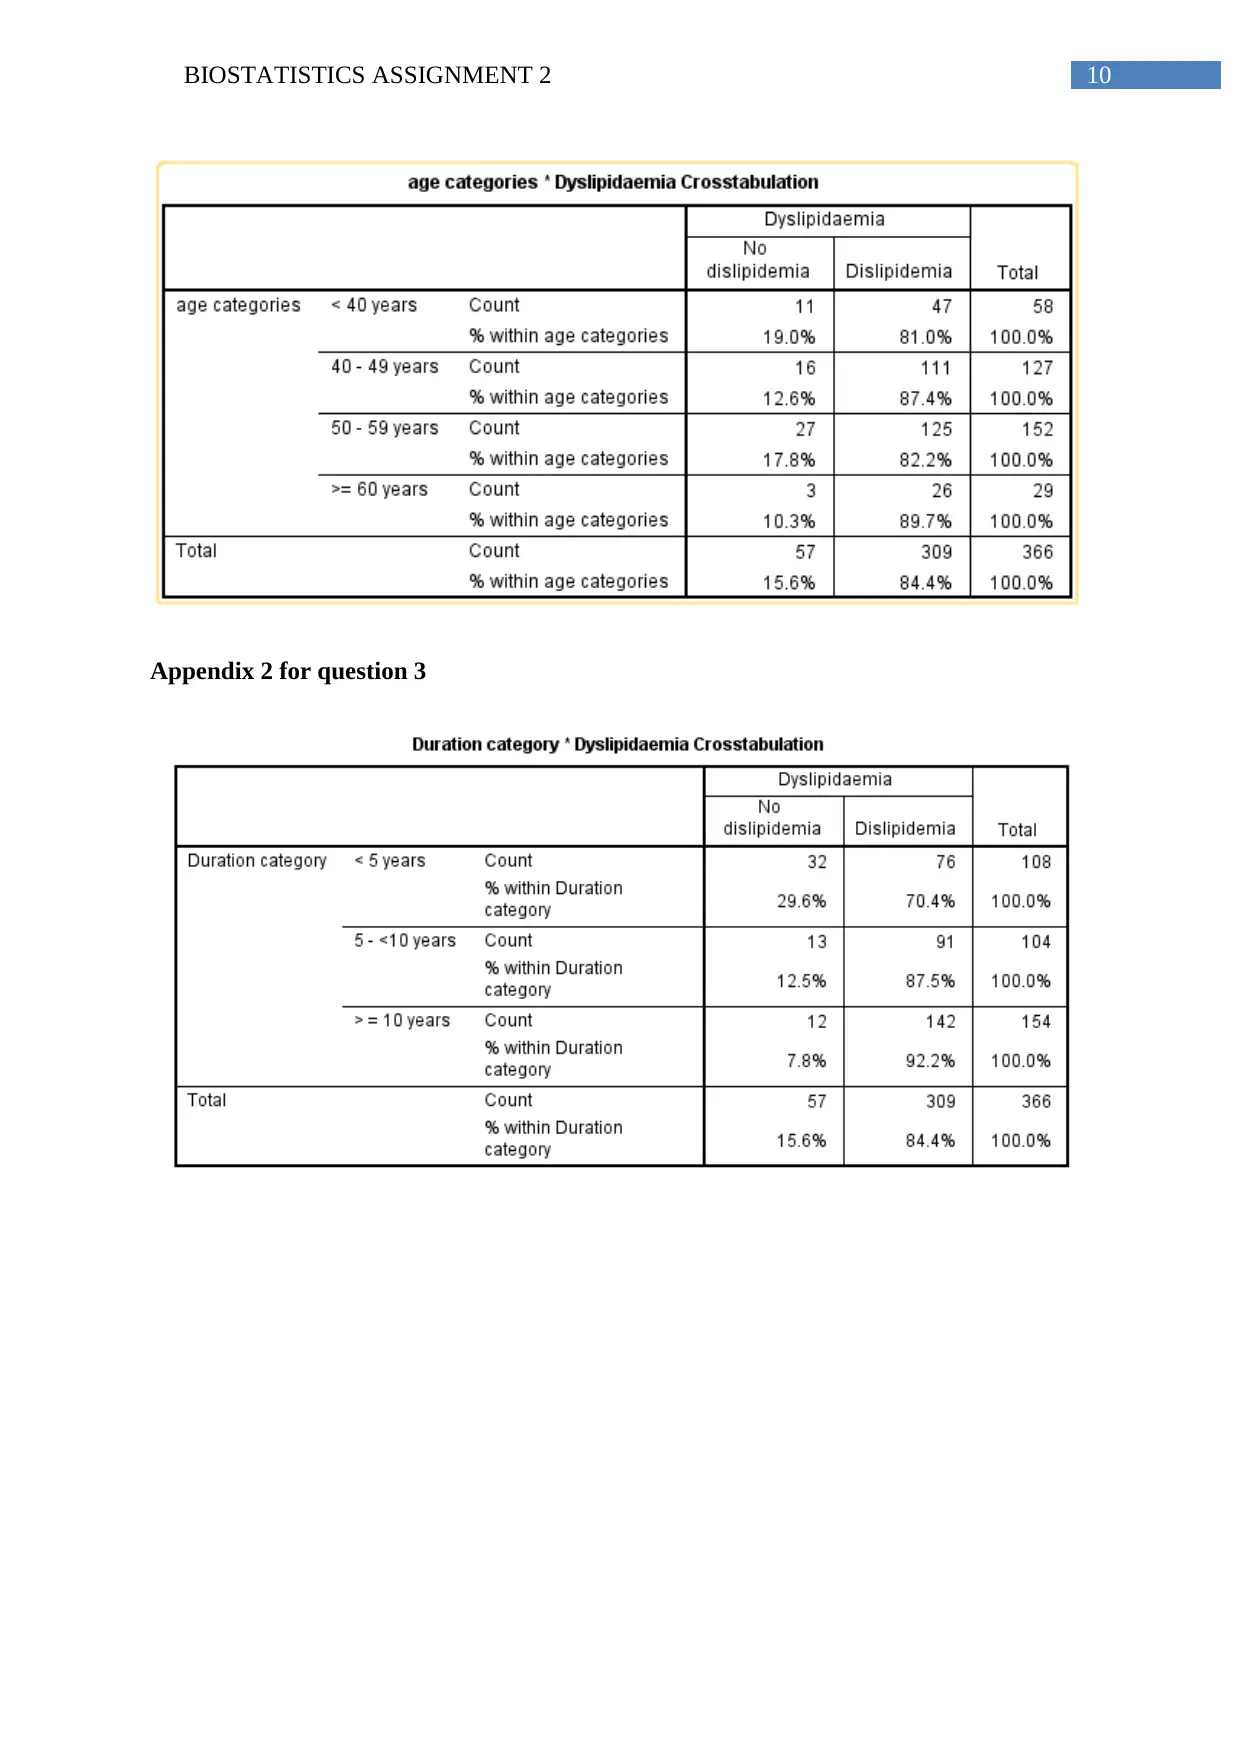
From the above graphical representation of the ratio of Dyslipidaemia and non Dyslipidaemia
population with the duration of diabetes group it can be found that with the increasing number of
duration category, the prevalence of occurring Dyslipidaemia also increases. Therefore, it can be
interpreted that the number of population with greater duration of suffering is also higher.
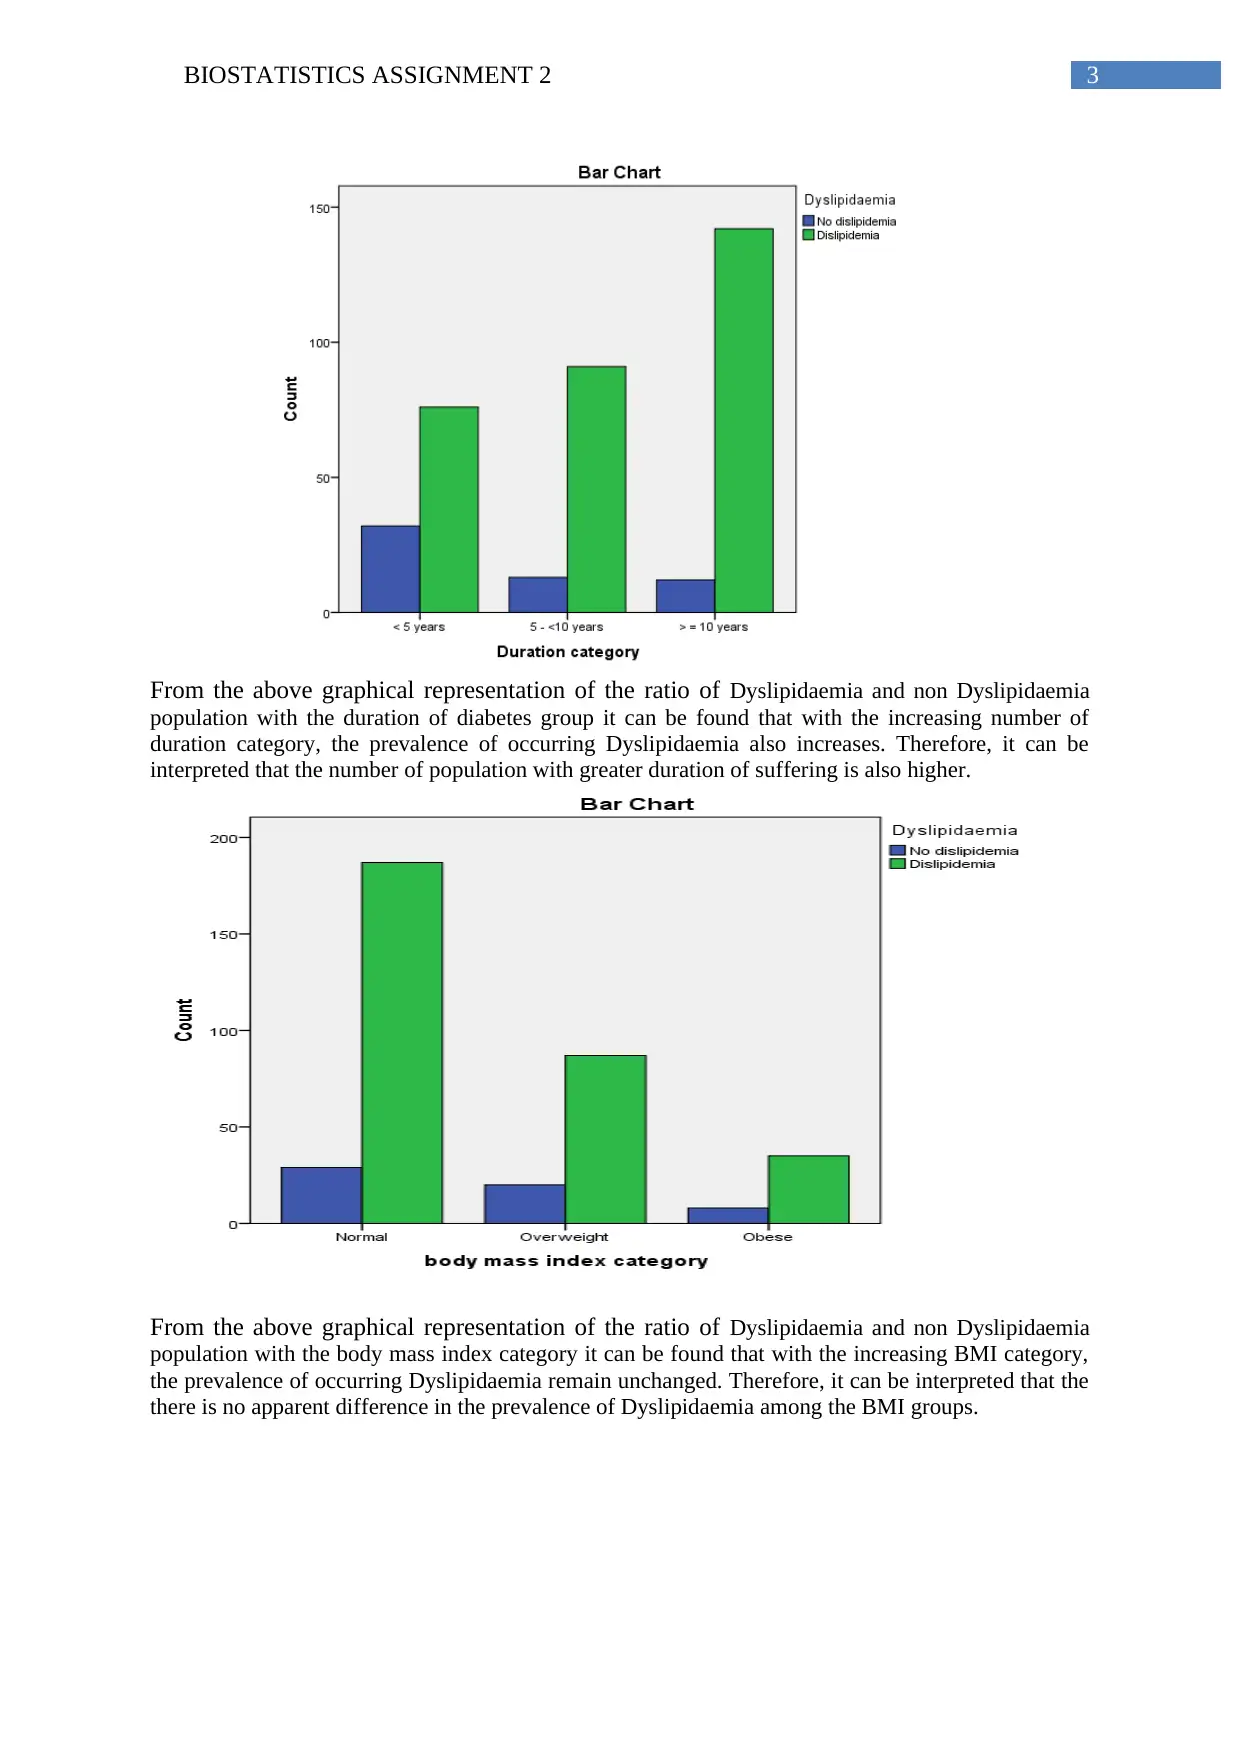
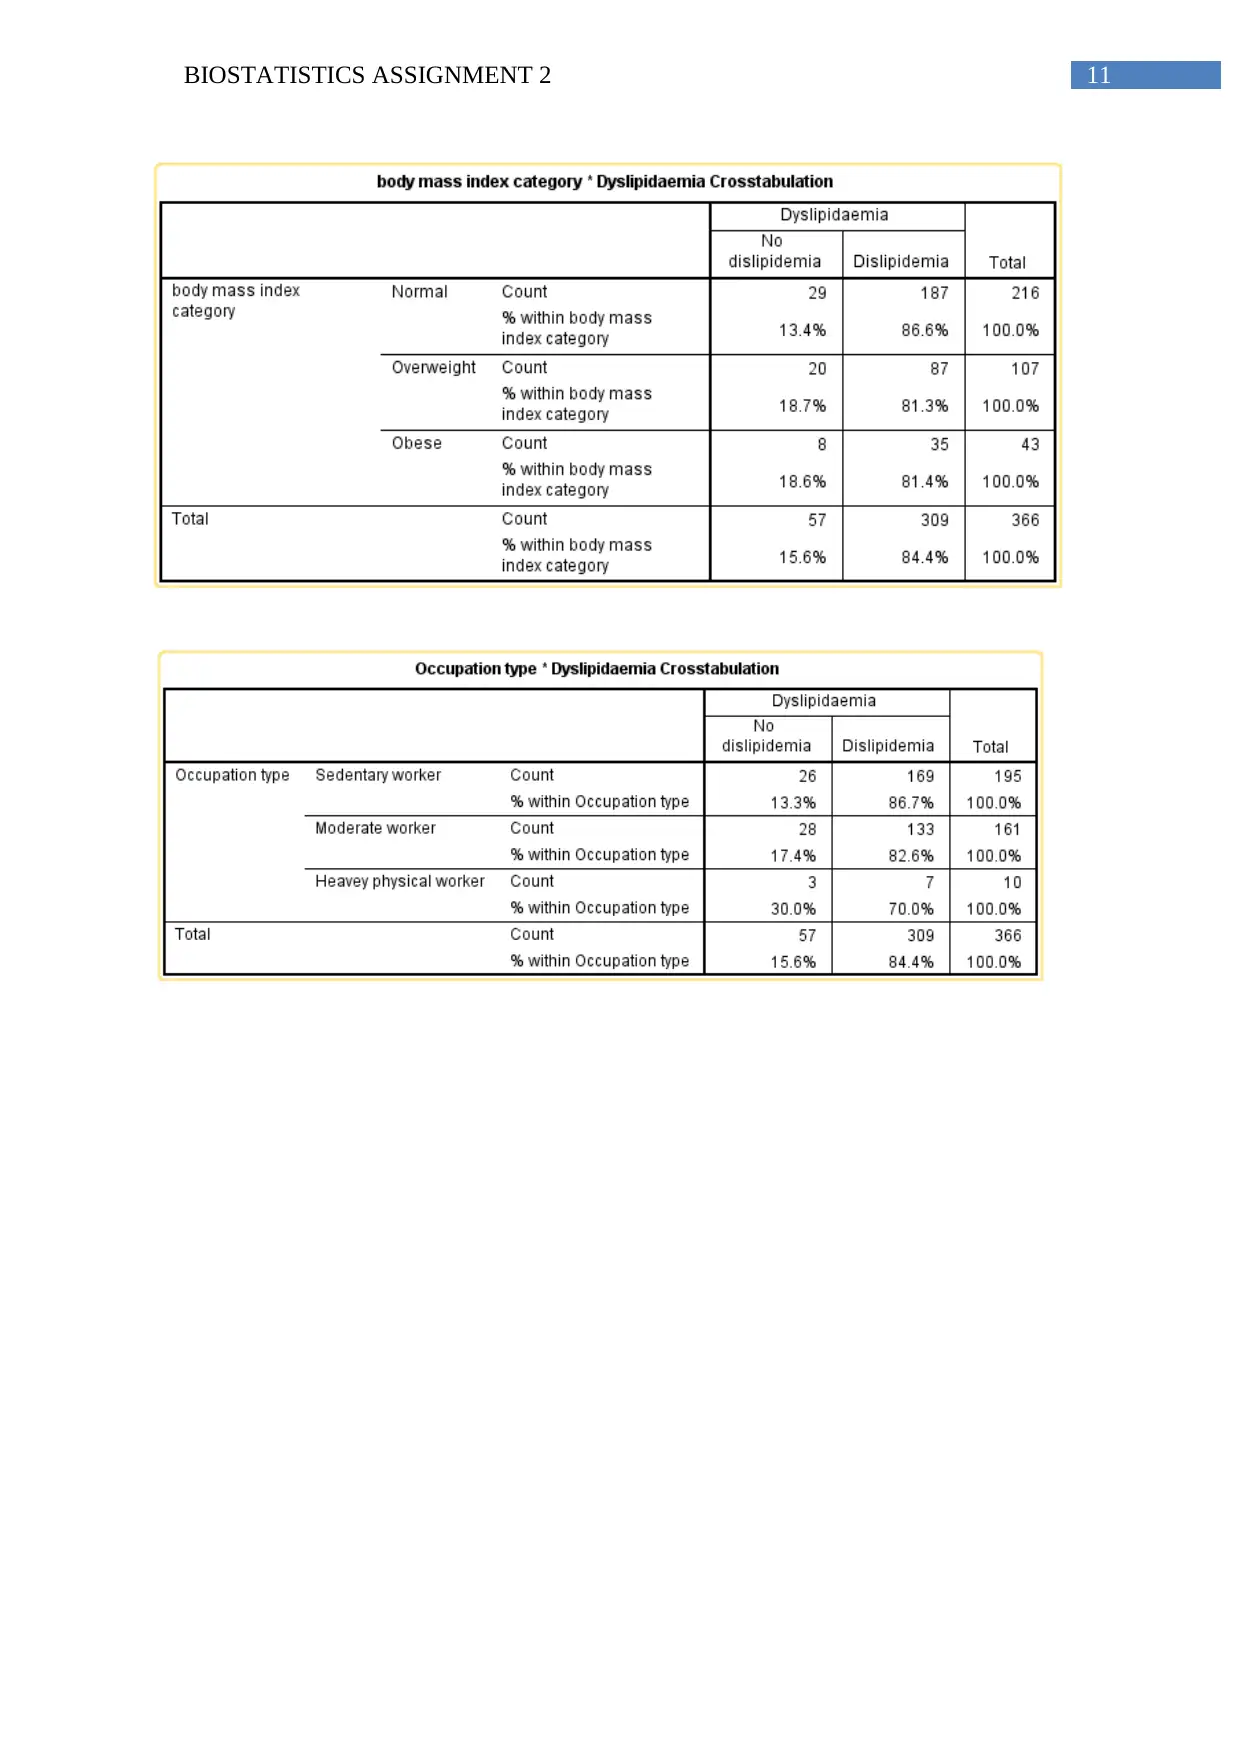
From the above graphical representation of the ratio of Dyslipidaemia and non Dyslipidaemia
population with the body mass index category it can be found that with the increasing BMI category,
the prevalence of occurring Dyslipidaemia remain unchanged. Therefore, it can be interpreted that the
there is no apparent difference in the prevalence of Dyslipidaemia among the BMI groups.
From the above graphical representation of the ratio of Dyslipidaemia and non Dyslipidaemia
population with the duration of diabetes group it can be found that with the increasing number of
duration category, the prevalence of occurring Dyslipidaemia also increases. Therefore, it can be
interpreted that the number of population with greater duration of suffering is also higher.
From the above graphical representation of the ratio of Dyslipidaemia and non Dyslipidaemia
population with the body mass index category it can be found that with the increasing BMI category,
the prevalence of occurring Dyslipidaemia remain unchanged. Therefore, it can be interpreted that the
there is no apparent difference in the prevalence of Dyslipidaemia among the BMI groups.
Secure Best Marks with AI Grader
Need help grading? Try our AI Grader for instant feedback on your assignments.
4BIOSTATISTICS ASSIGNMENT 2
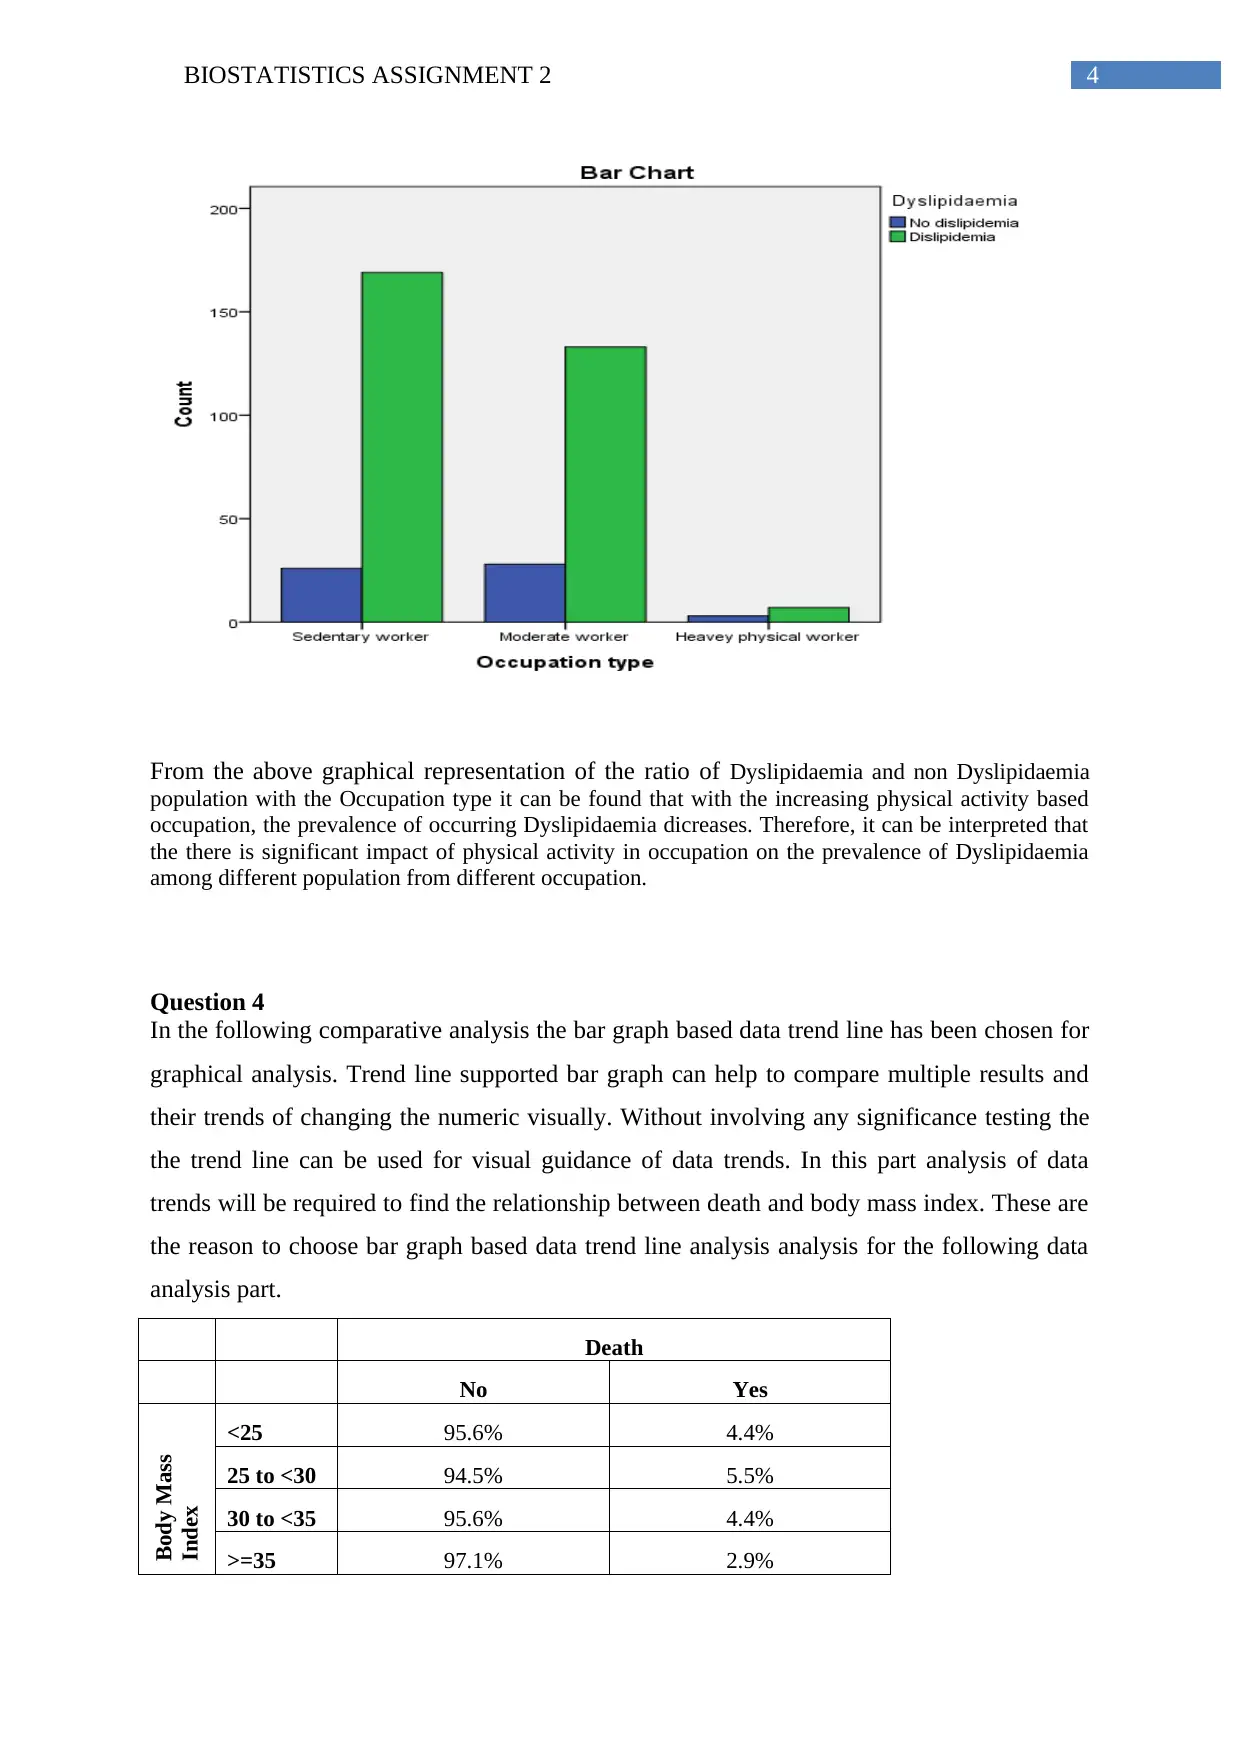
From the above graphical representation of the ratio of Dyslipidaemia and non Dyslipidaemia
population with the Occupation type it can be found that with the increasing physical activity based
occupation, the prevalence of occurring Dyslipidaemia dicreases. Therefore, it can be interpreted that
the there is significant impact of physical activity in occupation on the prevalence of Dyslipidaemia
among different population from different occupation.
Question 4
In the following comparative analysis the bar graph based data trend line has been chosen for
graphical analysis. Trend line supported bar graph can help to compare multiple results and
their trends of changing the numeric visually. Without involving any significance testing the
the trend line can be used for visual guidance of data trends. In this part analysis of data
trends will be required to find the relationship between death and body mass index. These are
the reason to choose bar graph based data trend line analysis analysis for the following data
analysis part.
Death
No Yes
Body Mass
Index
<25 95.6% 4.4%
25 to <30 94.5% 5.5%
30 to <35 95.6% 4.4%
>=35 97.1% 2.9%
5BIOSTATISTICS ASSIGNMENT 2
<25 25 to <30 30 to <35 >=35
0.00%
1.00%
2.00%
3.00%
4.00%
5.00%
6.00%
Deth Reported
Deth Reported
Linear (Deth Reported)
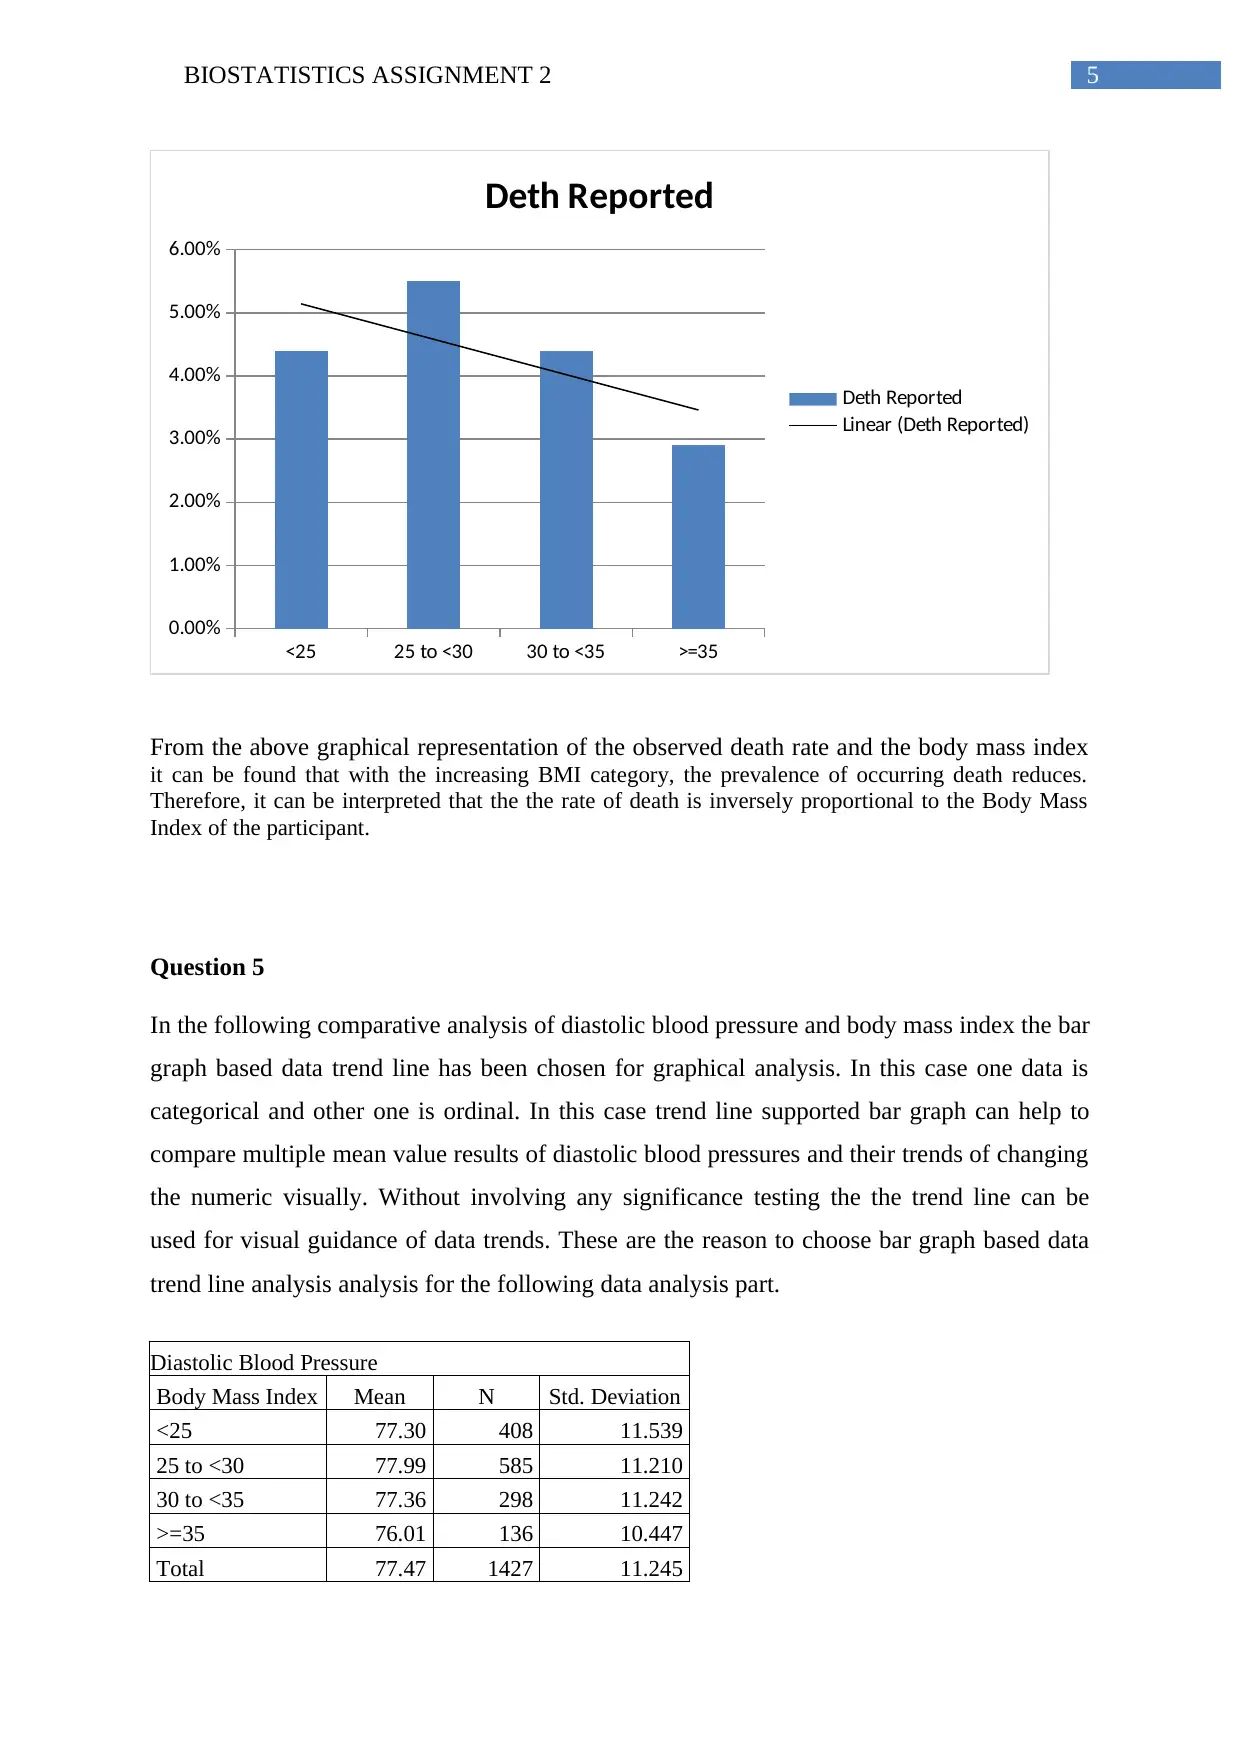
From the above graphical representation of the observed death rate and the body mass index
it can be found that with the increasing BMI category, the prevalence of occurring death reduces.
Therefore, it can be interpreted that the the rate of death is inversely proportional to the Body Mass
Index of the participant.
Question 5
In the following comparative analysis of diastolic blood pressure and body mass index the bar
graph based data trend line has been chosen for graphical analysis. In this case one data is
categorical and other one is ordinal. In this case trend line supported bar graph can help to
compare multiple mean value results of diastolic blood pressures and their trends of changing
the numeric visually. Without involving any significance testing the the trend line can be
used for visual guidance of data trends. These are the reason to choose bar graph based data
trend line analysis analysis for the following data analysis part.
Diastolic Blood Pressure
Body Mass Index Mean N Std. Deviation
<25 77.30 408 11.539
25 to <30 77.99 585 11.210
30 to <35 77.36 298 11.242
>=35 76.01 136 10.447
Total 77.47 1427 11.245
<25 25 to <30 30 to <35 >=35
0.00%
1.00%
2.00%
3.00%
4.00%
5.00%
6.00%
Deth Reported
Deth Reported
Linear (Deth Reported)
From the above graphical representation of the observed death rate and the body mass index
it can be found that with the increasing BMI category, the prevalence of occurring death reduces.
Therefore, it can be interpreted that the the rate of death is inversely proportional to the Body Mass
Index of the participant.
Question 5
In the following comparative analysis of diastolic blood pressure and body mass index the bar
graph based data trend line has been chosen for graphical analysis. In this case one data is
categorical and other one is ordinal. In this case trend line supported bar graph can help to
compare multiple mean value results of diastolic blood pressures and their trends of changing
the numeric visually. Without involving any significance testing the the trend line can be
used for visual guidance of data trends. These are the reason to choose bar graph based data
trend line analysis analysis for the following data analysis part.
Diastolic Blood Pressure
Body Mass Index Mean N Std. Deviation
<25 77.30 408 11.539
25 to <30 77.99 585 11.210
30 to <35 77.36 298 11.242
>=35 76.01 136 10.447
Total 77.47 1427 11.245
6BIOSTATISTICS ASSIGNMENT 2
<25 25 to <30 30 to <35 >=35
75
75.5
76
76.5
77
77.5
78
78.5
Mean DBP
Mean DBP
Linear (Mean DBP)
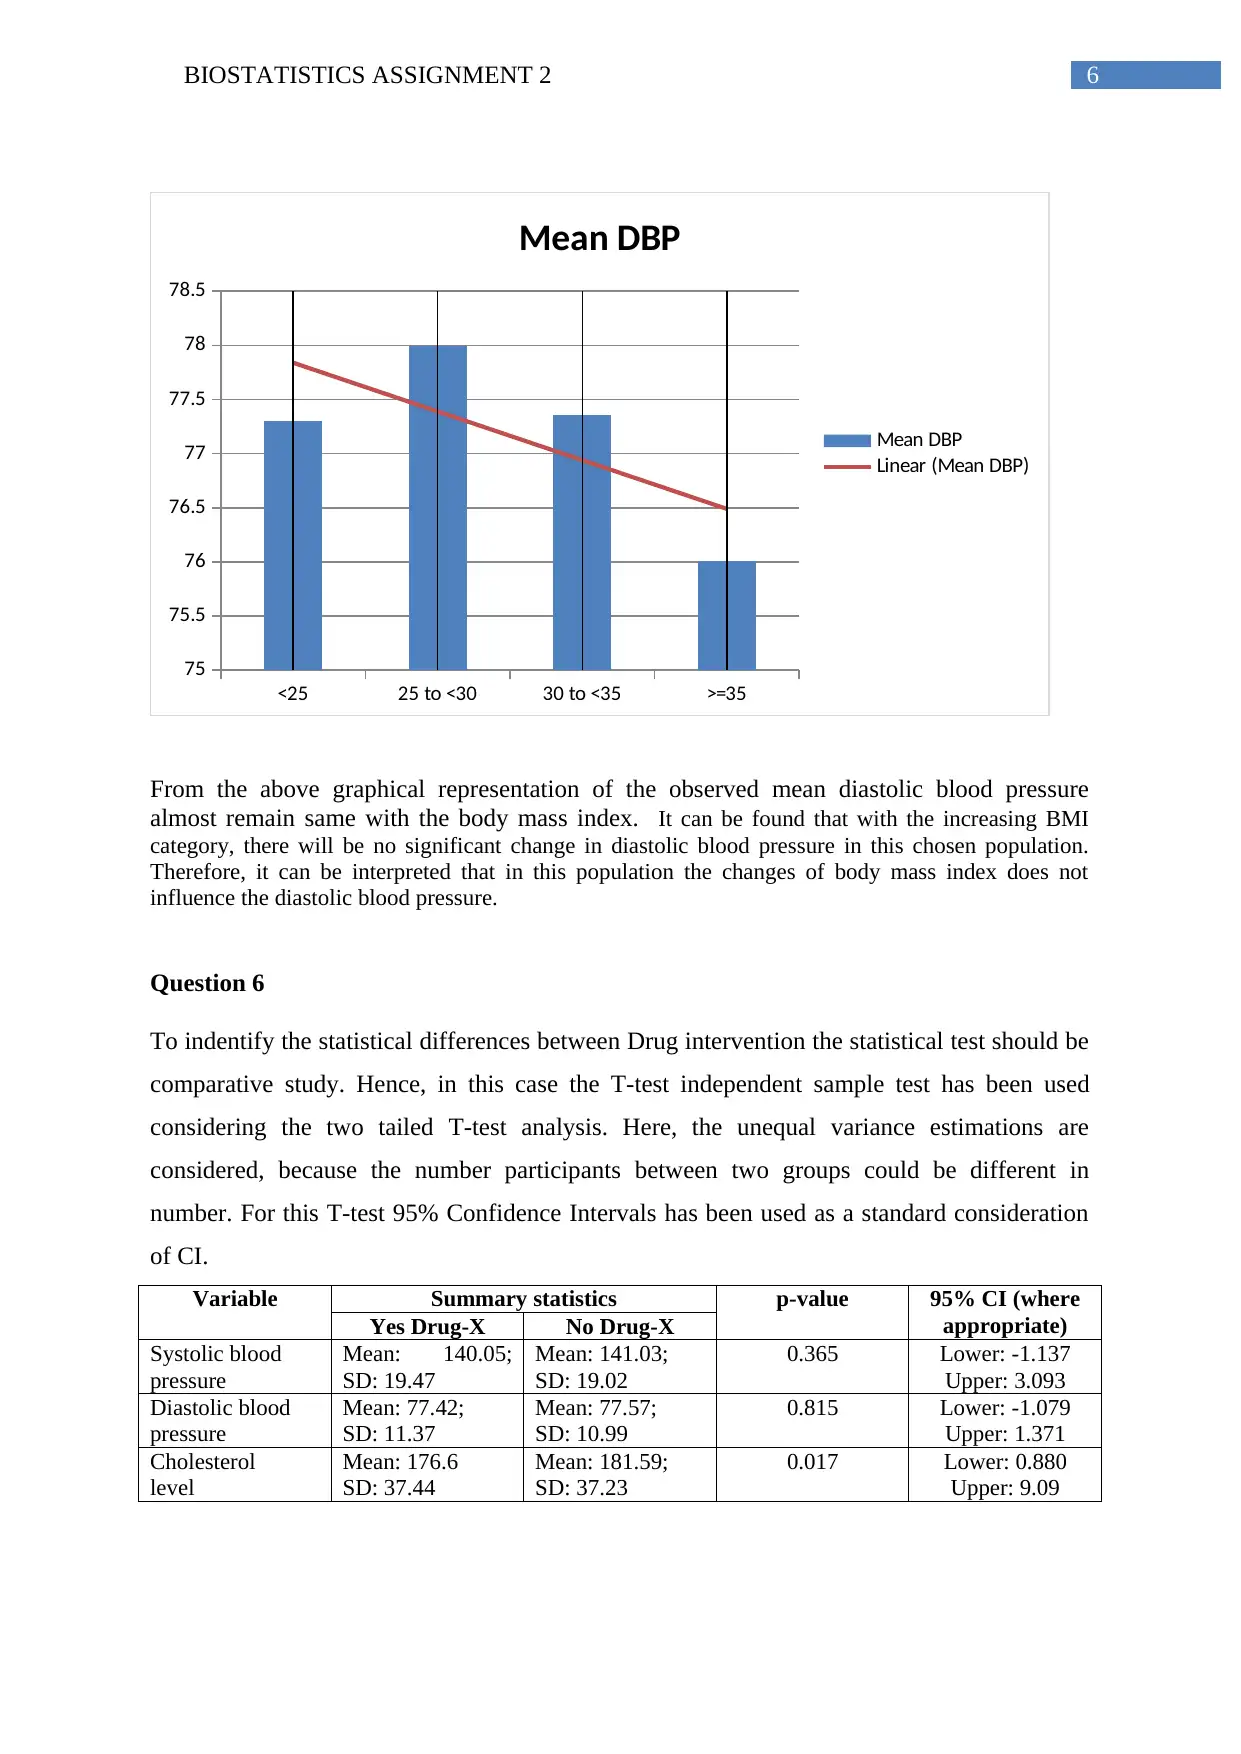
From the above graphical representation of the observed mean diastolic blood pressure
almost remain same with the body mass index. It can be found that with the increasing BMI
category, there will be no significant change in diastolic blood pressure in this chosen population.
Therefore, it can be interpreted that in this population the changes of body mass index does not
influence the diastolic blood pressure.
Question 6
To indentify the statistical differences between Drug intervention the statistical test should be
comparative study. Hence, in this case the T-test independent sample test has been used
considering the two tailed T-test analysis. Here, the unequal variance estimations are
considered, because the number participants between two groups could be different in
number. For this T-test 95% Confidence Intervals has been used as a standard consideration
of CI.
Variable Summary statistics p-value 95% CI (where
appropriate)Yes Drug-X No Drug-X
Systolic blood
pressure
Mean: 140.05;
SD: 19.47
Mean: 141.03;
SD: 19.02
0.365 Lower: -1.137
Upper: 3.093
Diastolic blood
pressure
Mean: 77.42;
SD: 11.37
Mean: 77.57;
SD: 10.99
0.815 Lower: -1.079
Upper: 1.371
Cholesterol
level
Mean: 176.6
SD: 37.44
Mean: 181.59;
SD: 37.23
0.017 Lower: 0.880
Upper: 9.09
<25 25 to <30 30 to <35 >=35
75
75.5
76
76.5
77
77.5
78
78.5
Mean DBP
Mean DBP
Linear (Mean DBP)
From the above graphical representation of the observed mean diastolic blood pressure
almost remain same with the body mass index. It can be found that with the increasing BMI
category, there will be no significant change in diastolic blood pressure in this chosen population.
Therefore, it can be interpreted that in this population the changes of body mass index does not
influence the diastolic blood pressure.
Question 6
To indentify the statistical differences between Drug intervention the statistical test should be
comparative study. Hence, in this case the T-test independent sample test has been used
considering the two tailed T-test analysis. Here, the unequal variance estimations are
considered, because the number participants between two groups could be different in
number. For this T-test 95% Confidence Intervals has been used as a standard consideration
of CI.
Variable Summary statistics p-value 95% CI (where
appropriate)Yes Drug-X No Drug-X
Systolic blood
pressure
Mean: 140.05;
SD: 19.47
Mean: 141.03;
SD: 19.02
0.365 Lower: -1.137
Upper: 3.093
Diastolic blood
pressure
Mean: 77.42;
SD: 11.37
Mean: 77.57;
SD: 10.99
0.815 Lower: -1.079
Upper: 1.371
Cholesterol
level
Mean: 176.6
SD: 37.44
Mean: 181.59;
SD: 37.23
0.017 Lower: 0.880
Upper: 9.09
Paraphrase This Document
Need a fresh take? Get an instant paraphrase of this document with our AI Paraphraser
7BIOSTATISTICS ASSIGNMENT 2
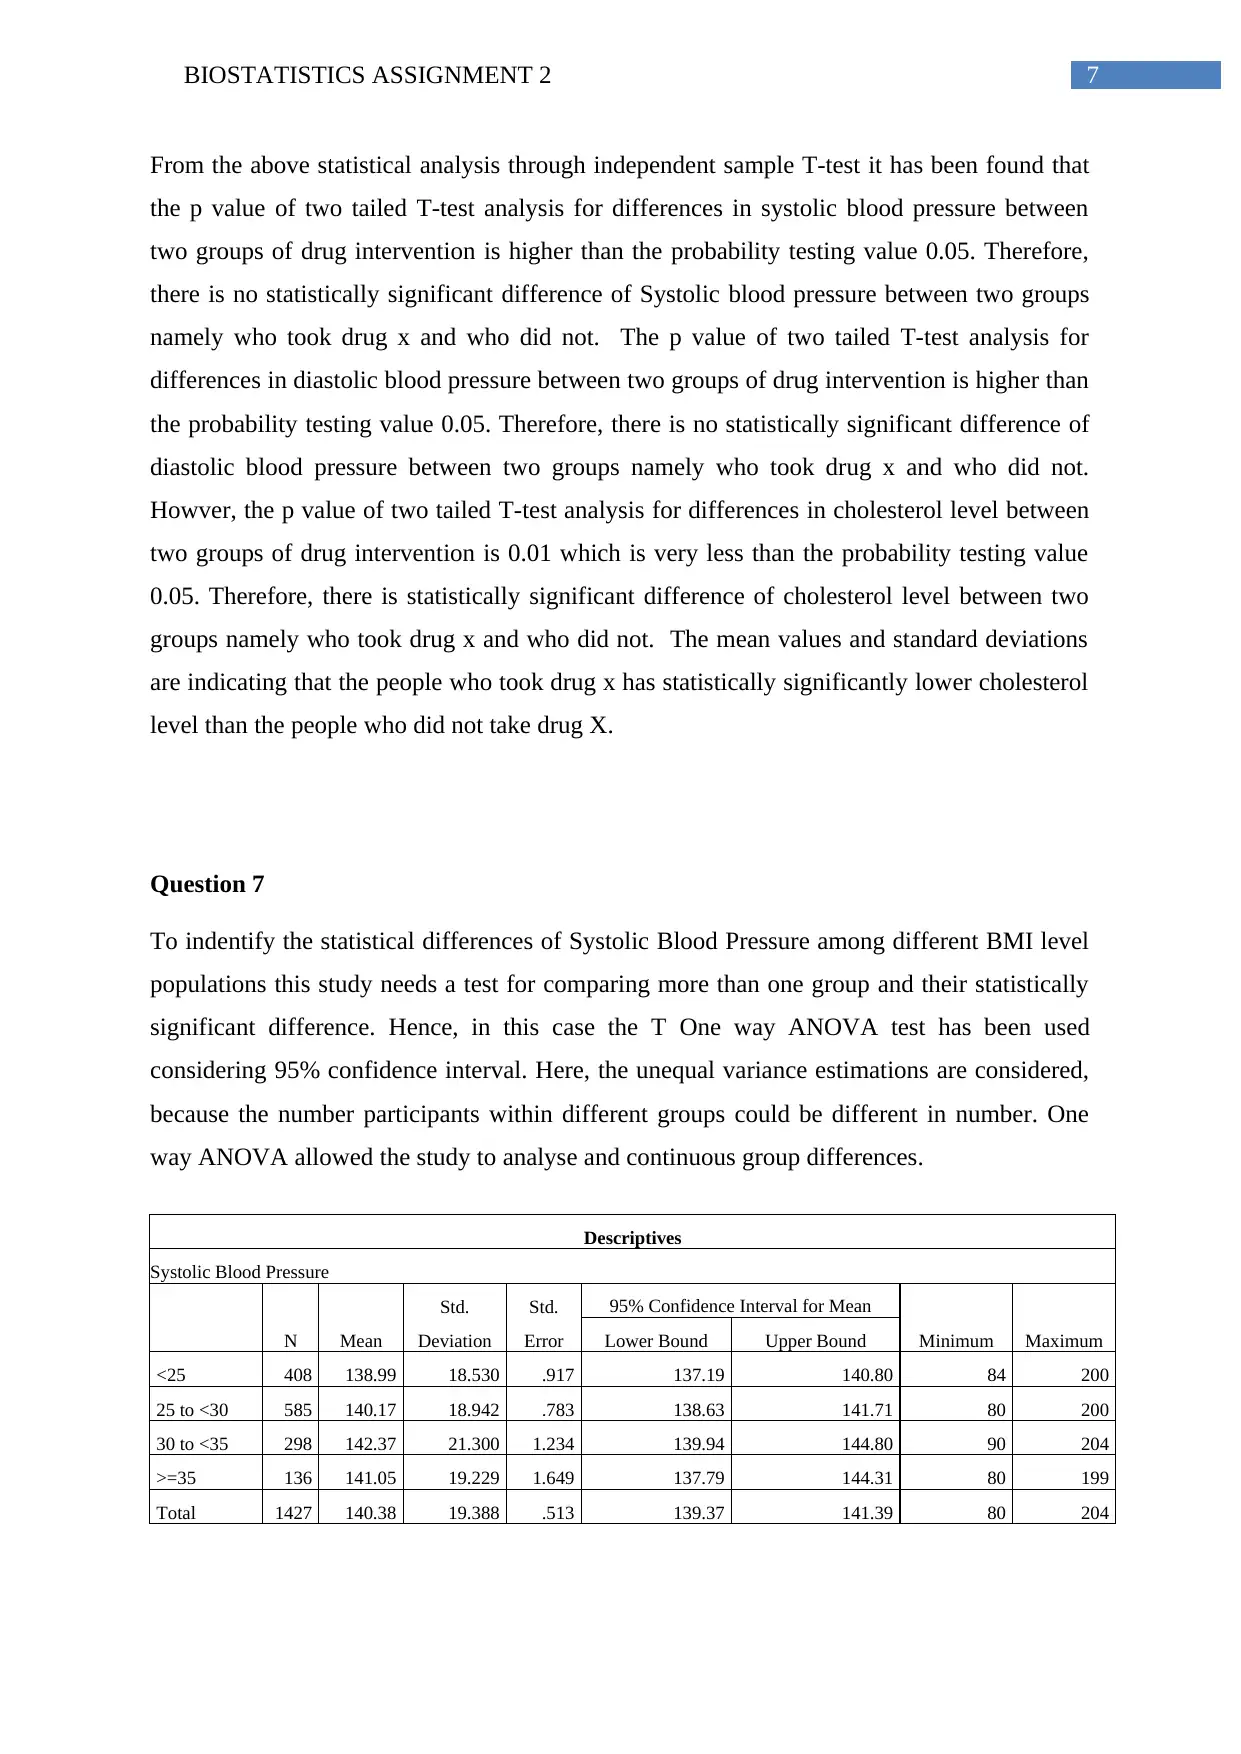
From the above statistical analysis through independent sample T-test it has been found that
the p value of two tailed T-test analysis for differences in systolic blood pressure between
two groups of drug intervention is higher than the probability testing value 0.05. Therefore,
there is no statistically significant difference of Systolic blood pressure between two groups
namely who took drug x and who did not. The p value of two tailed T-test analysis for
differences in diastolic blood pressure between two groups of drug intervention is higher than
the probability testing value 0.05. Therefore, there is no statistically significant difference of
diastolic blood pressure between two groups namely who took drug x and who did not.
Howver, the p value of two tailed T-test analysis for differences in cholesterol level between
two groups of drug intervention is 0.01 which is very less than the probability testing value
0.05. Therefore, there is statistically significant difference of cholesterol level between two
groups namely who took drug x and who did not. The mean values and standard deviations
are indicating that the people who took drug x has statistically significantly lower cholesterol
level than the people who did not take drug X.
Question 7
To indentify the statistical differences of Systolic Blood Pressure among different BMI level
populations this study needs a test for comparing more than one group and their statistically
significant difference. Hence, in this case the T One way ANOVA test has been used
considering 95% confidence interval. Here, the unequal variance estimations are considered,
because the number participants within different groups could be different in number. One
way ANOVA allowed the study to analyse and continuous group differences.
Descriptives
Systolic Blood Pressure
N Mean
Std.
Deviation
Std.
Error
95% Confidence Interval for Mean
Minimum MaximumLower Bound Upper Bound
<25 408 138.99 18.530 .917 137.19 140.80 84 200
25 to <30 585 140.17 18.942 .783 138.63 141.71 80 200
30 to <35 298 142.37 21.300 1.234 139.94 144.80 90 204
>=35 136 141.05 19.229 1.649 137.79 144.31 80 199
Total 1427 140.38 19.388 .513 139.37 141.39 80 204
8BIOSTATISTICS ASSIGNMENT 2
ANOVA
Systolic Blood Pressure
Sum of Squares df Mean Square F Sig.
Between Groups 2054.821 3 684.940 1.825 .141
Within Groups 533946.834 1423 375.226
Total 536001.655 1426
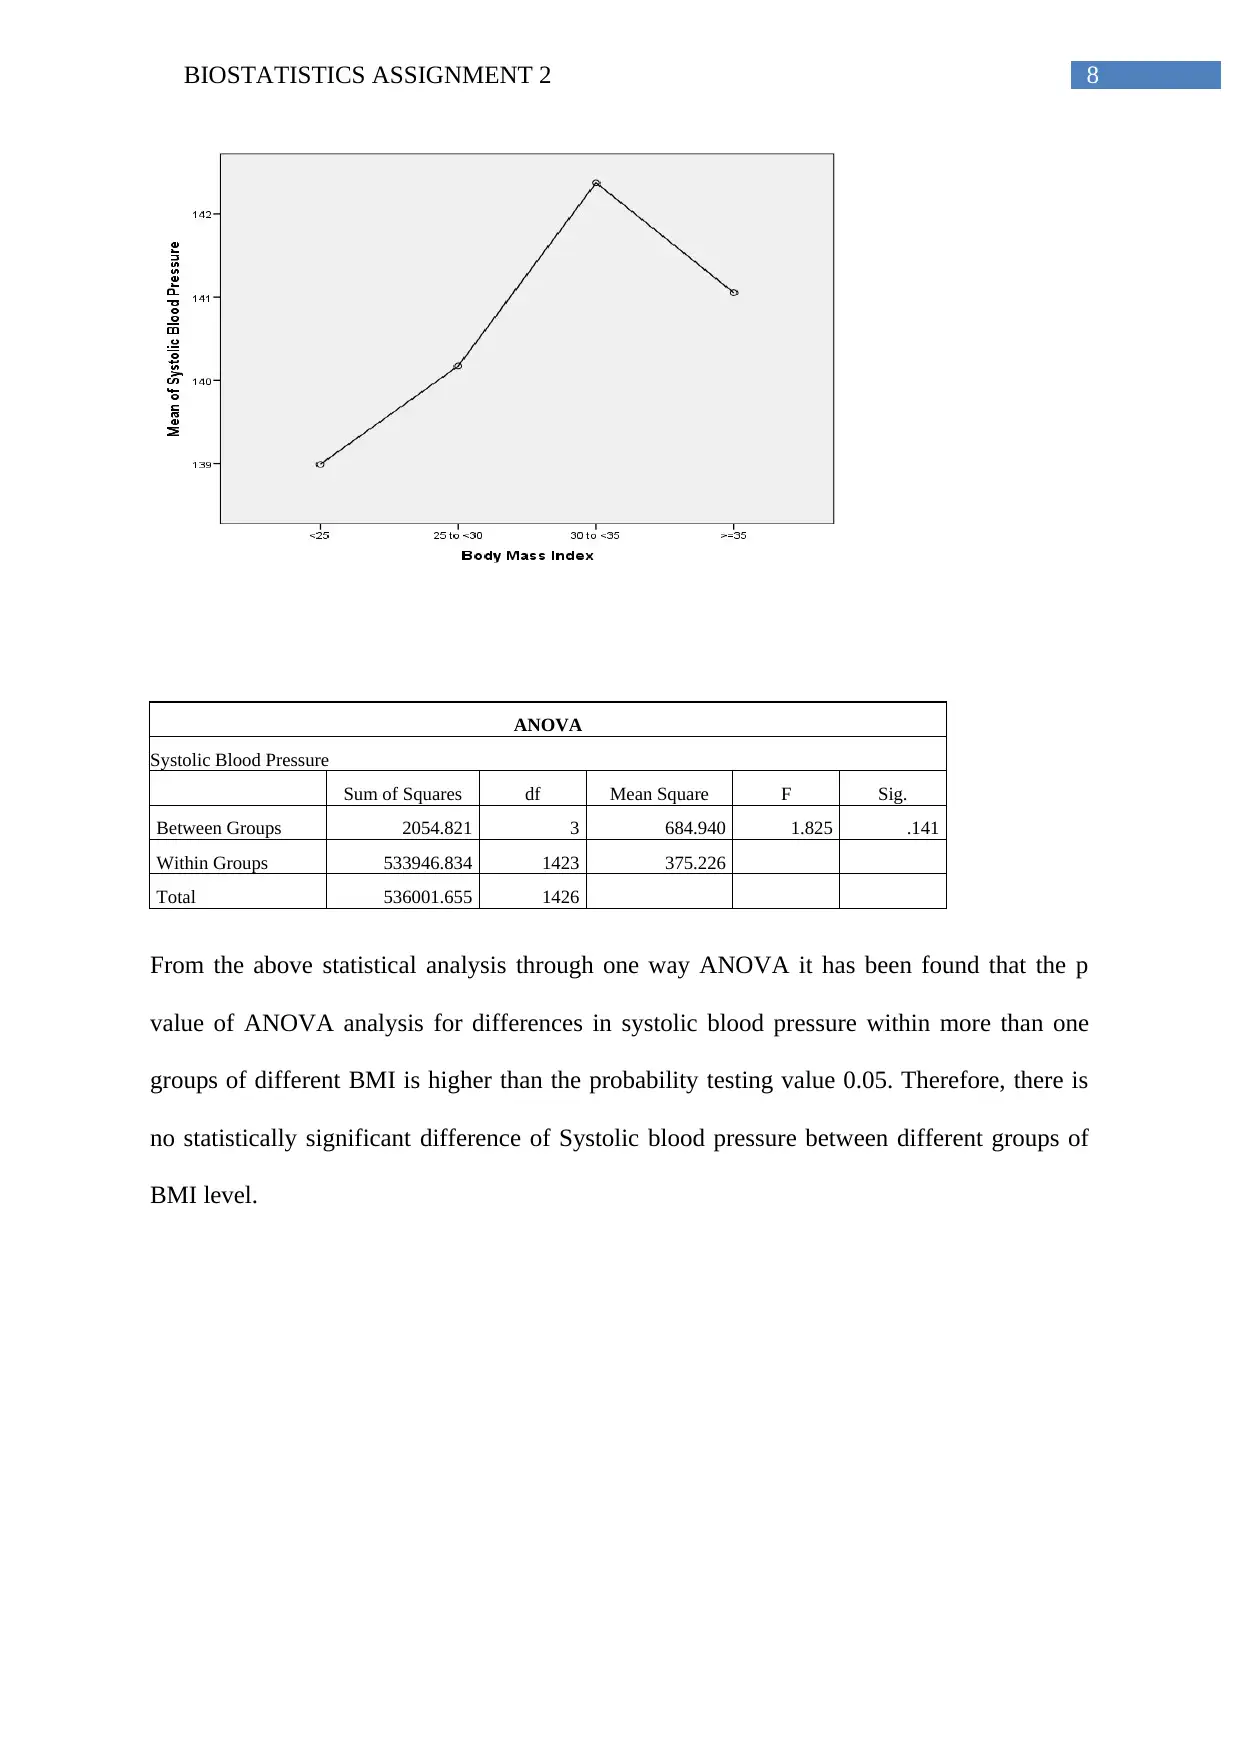
From the above statistical analysis through one way ANOVA it has been found that the p
value of ANOVA analysis for differences in systolic blood pressure within more than one
groups of different BMI is higher than the probability testing value 0.05. Therefore, there is
no statistically significant difference of Systolic blood pressure between different groups of
BMI level.
ANOVA
Systolic Blood Pressure
Sum of Squares df Mean Square F Sig.
Between Groups 2054.821 3 684.940 1.825 .141
Within Groups 533946.834 1423 375.226
Total 536001.655 1426
From the above statistical analysis through one way ANOVA it has been found that the p
value of ANOVA analysis for differences in systolic blood pressure within more than one
groups of different BMI is higher than the probability testing value 0.05. Therefore, there is
no statistically significant difference of Systolic blood pressure between different groups of
BMI level.
9BIOSTATISTICS ASSIGNMENT 2
SPSS FILES
Appendix 1 for question 2
SPSS FILES
Appendix 1 for question 2
Secure Best Marks with AI Grader
Need help grading? Try our AI Grader for instant feedback on your assignments.
10BIOSTATISTICS ASSIGNMENT 2
Appendix 2 for question 3
Appendix 2 for question 3
11BIOSTATISTICS ASSIGNMENT 2
1 out of 12


Your All-in-One AI-Powered Toolkit for Academic Success.
+13062052269
info@desklib.com
Available 24*7 on WhatsApp / Email
![[object Object]](/_next/static/media/star-bottom.7253800d.svg)
Unlock your academic potential
© 2024 | Zucol Services PVT LTD | All rights reserved.