401077 Biostatistics Assignment 2: Sign Test, WEMWBS, and Chi-Square
VerifiedAdded on 2023/06/12
|10
|1347
|475
Homework Assignment
AI Summary
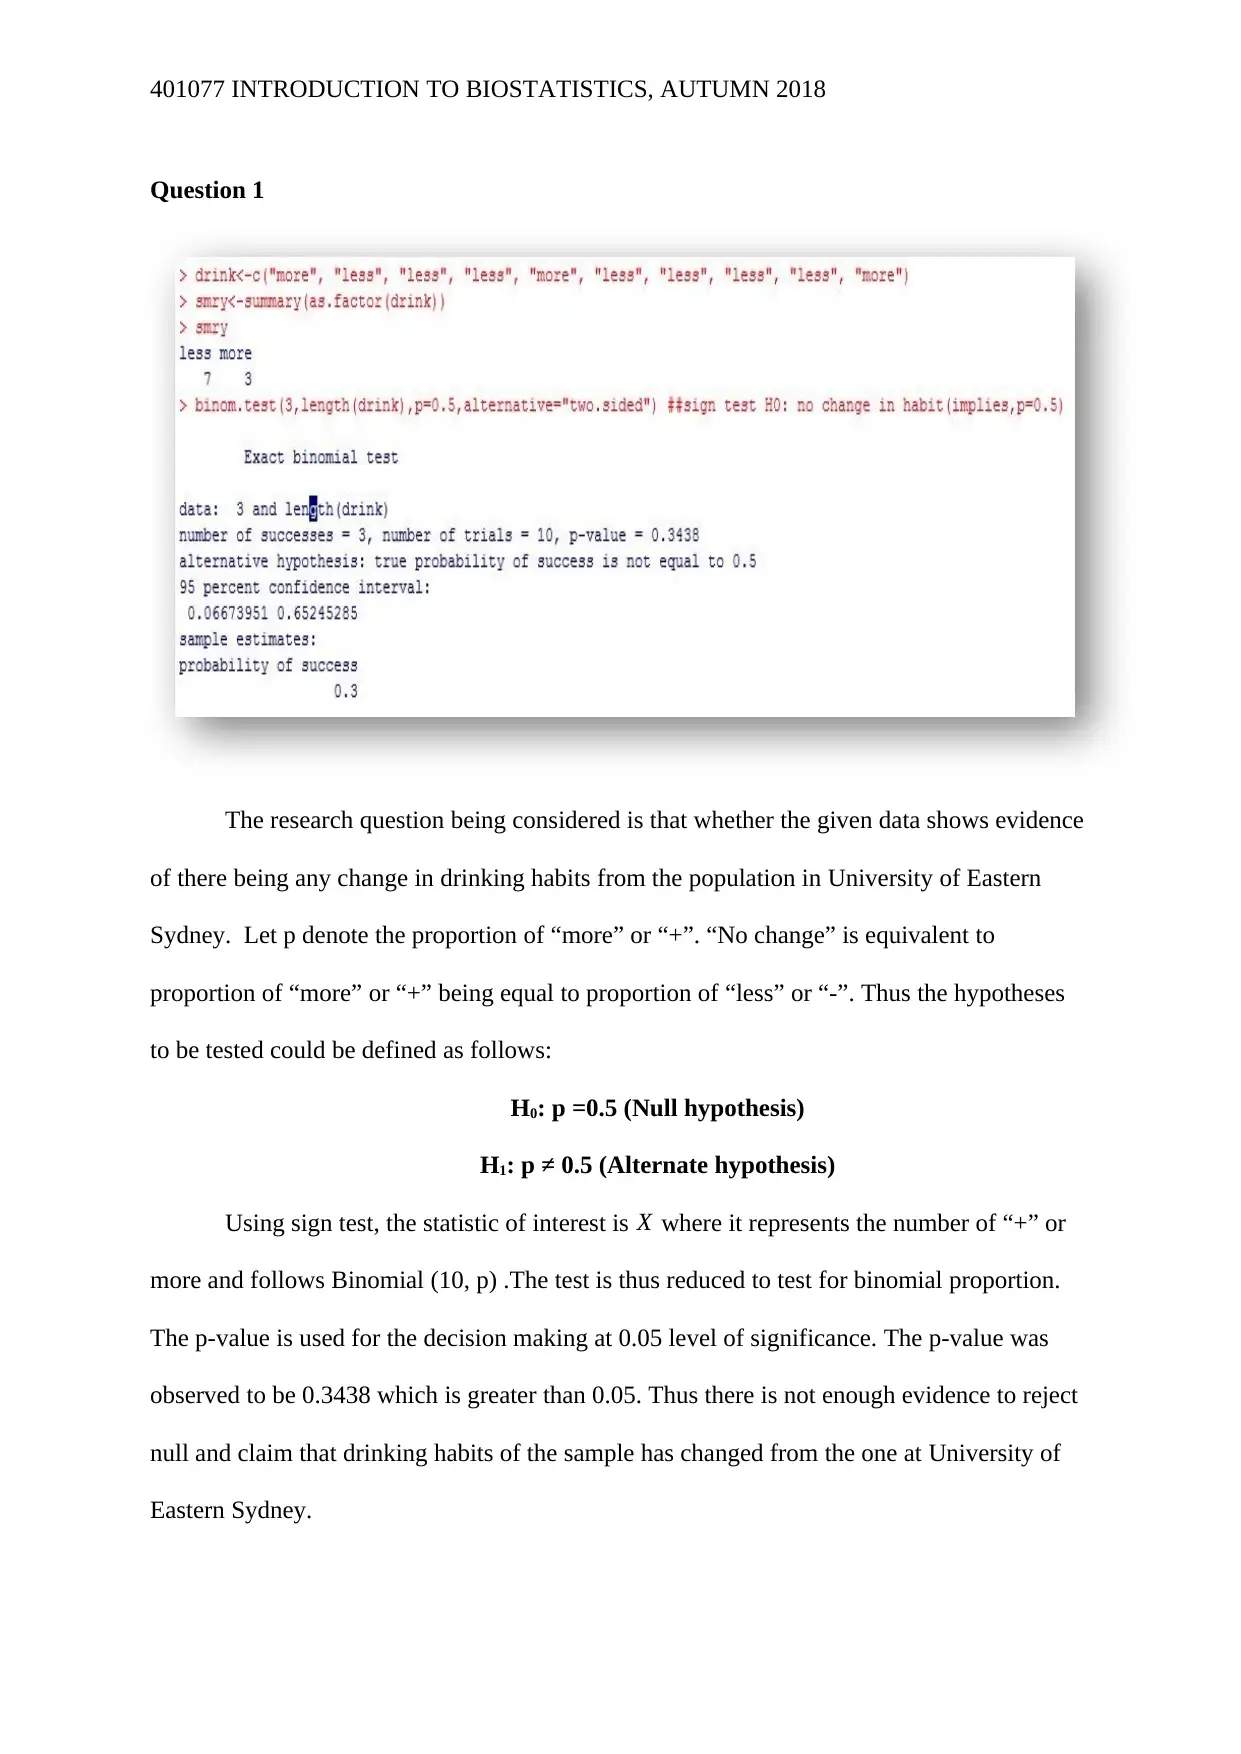
This assignment for the course 401077 Introduction to Biostatistics, Autumn 2018, involves several statistical analyses. It begins with a sign test to assess changes in drinking habits among University of Eastern Sydney graduates, followed by confidence interval estimation for WEMWBS scores. The assignment further explores hypothesis testing to determine if drug users have lower WEMWBS scores than non-users, using both parametric and non-parametric methods. Sample size calculations for statistical power are also performed. Finally, a chi-square test is conducted to investigate the association between sex and drug use, concluding with a calculation for the minimum sample size needed for a confidence interval of illicit drug users. The assignment uses a specific dataset provided to each student, requiring detailed statistical analysis and interpretation.


1 out of 10
Related Documents


Your All-in-One AI-Powered Toolkit for Academic Success.
+13062052269
info@desklib.com
Available 24*7 on WhatsApp / Email
![[object Object]](/_next/static/media/star-bottom.7253800d.svg)
Copyright © 2020–2026 A2Z Services. All Rights Reserved. Developed and managed by ZUCOL.