Biostatistics Report: Liver Transplant Study Analysis, 2019
VerifiedAdded on 2022/09/11
|9
|2928
|23
Report
AI Summary
This report provides a biostatistical analysis of a multicenter randomized controlled trial on liver transplantation. The study investigates the effects of sevoflurane anesthesia versus propofol on patient outcomes, including peak aspartate transaminase levels (primary outcome), early allograft dysfunction, in-hospital complications, ICU stays, and hospital stays (secondary outcomes). The analysis includes sample size calculations, considerations for intention-to-treat analysis, and the construction of frequency tables to assess the distribution of patients across different study sites. The report also examines the impact of platelet transfusions, pre-operative liver disease, and other factors on patient outcomes, using adjusted odds ratios and confidence intervals to evaluate the strength of associations. The report presents the findings in tables and provides interpretations of the statistical results, offering insights into the clinical implications of the study.
Biostatistics
1
<University>
Biostatistics
<Author>
31 August 2024
<Professor’s name>
<Program of Study>
1
<University>
Biostatistics
<Author>
31 August 2024
<Professor’s name>
<Program of Study>
Paraphrase This Document
Need a fresh take? Get an instant paraphrase of this document with our AI Paraphraser
Biostatistics
2
Part A
1. Is there significant difference for the conditioned Liver with Sevoflurane and
nonconditioned Liver transplant with Sevoflurane?
2. This was a multicentre randomized control study design where some patients were
randomly assigned to control and intervention groups.
3. The population involved adults aged 18 years and above and were admitted in the hospital
for liver transplantation. These study population had to provide informed consent and be
able to speak and understand the local language of the study area.
4. The intervention was the use of the Sevoflurane in liver transplant and liver
transplantation without the Sevoflurane.
5. After the diseased donour transplant took place, the treatment allocation was decided.
6. The primary outcome was based on the events of 7 days after AST initiation which
represents the frequencies of the injuries associated with ischemia reperfusion.
7. Secondary outcomes were ALT and EAD that followed the scores generated by the
assessments of Claven Dindo Complications.
8. The blinding level in this study was moderate given that the sampled populations were
assigned to each protocol.
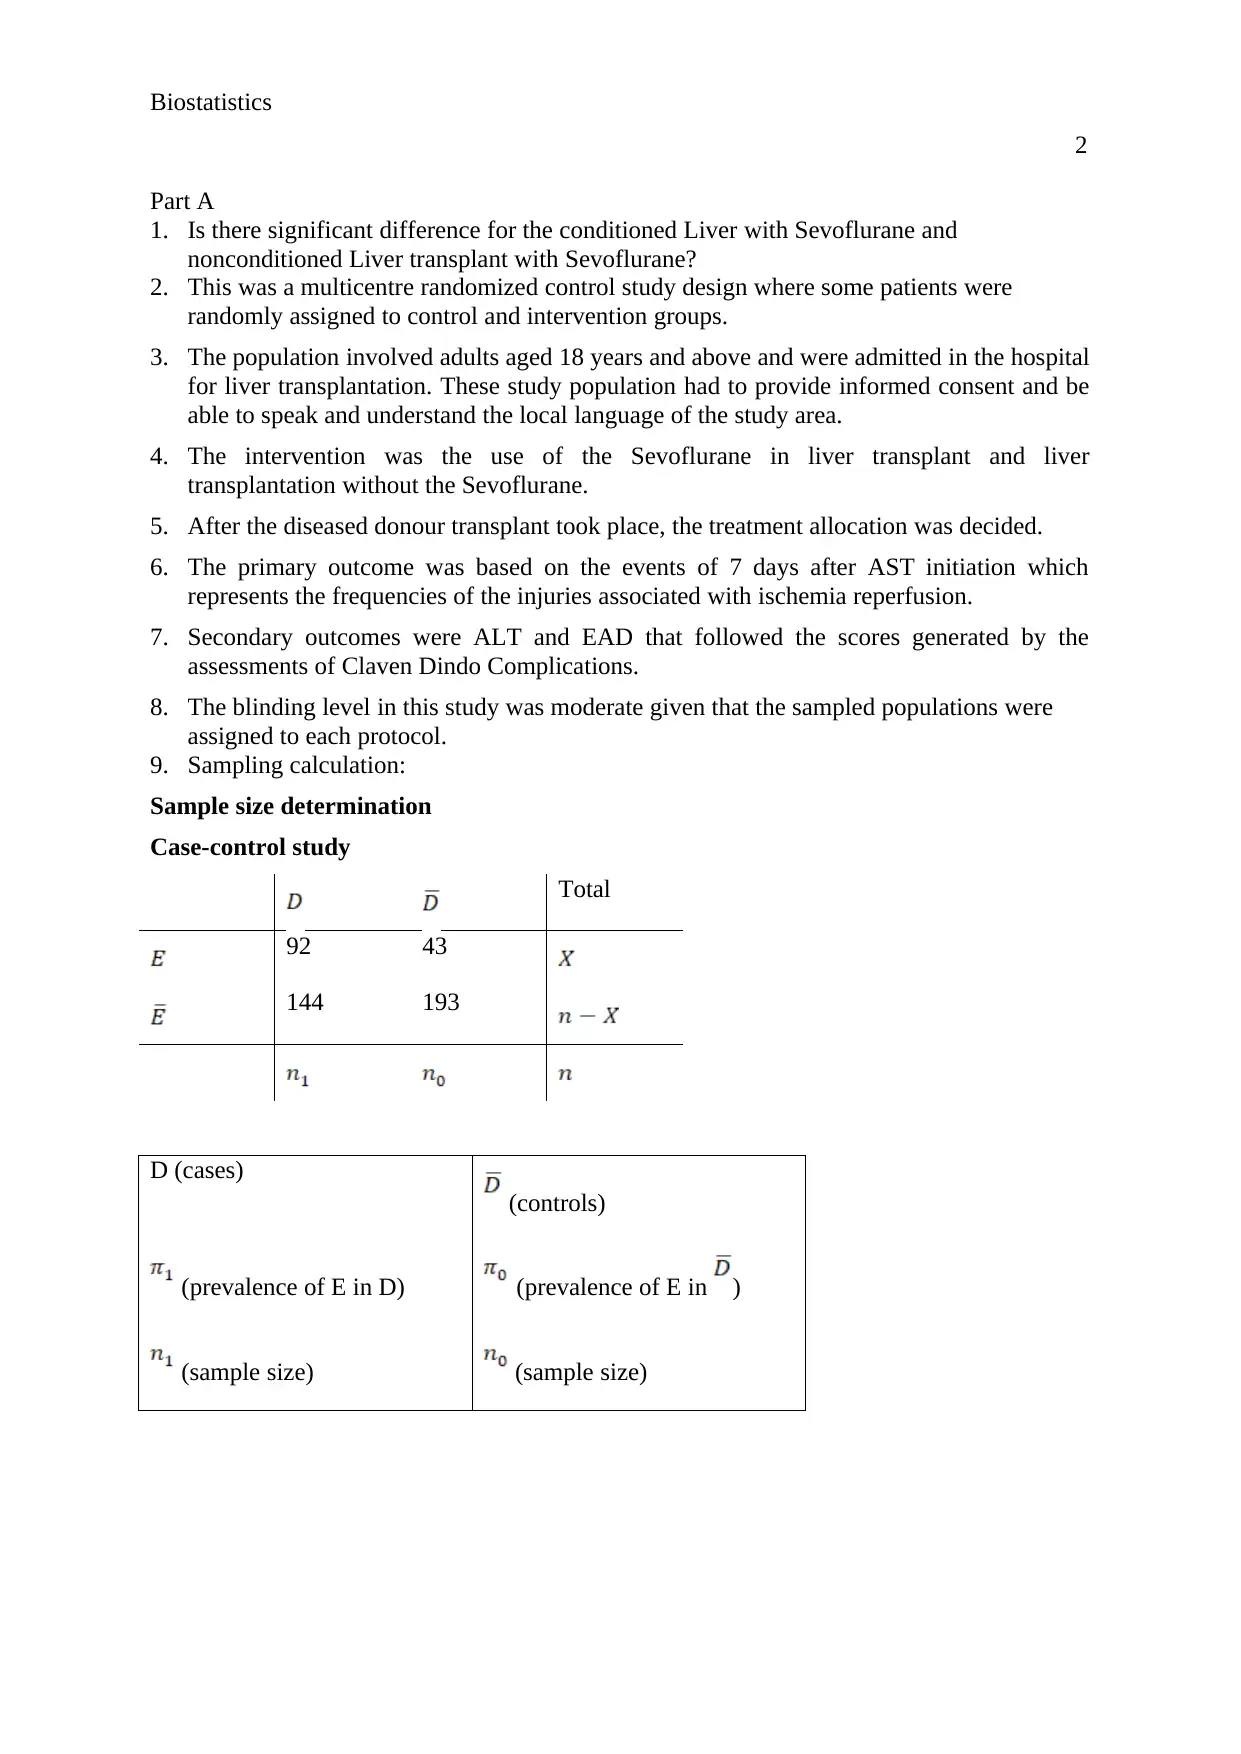
9. Sampling calculation:
Sample size determination
Case-control study
Total
92 43
144 193
D (cases)
(controls)
(prevalence of E in D) (prevalence of E in )
(sample size) (sample size)
2
Part A
1. Is there significant difference for the conditioned Liver with Sevoflurane and
nonconditioned Liver transplant with Sevoflurane?
2. This was a multicentre randomized control study design where some patients were
randomly assigned to control and intervention groups.
3. The population involved adults aged 18 years and above and were admitted in the hospital
for liver transplantation. These study population had to provide informed consent and be
able to speak and understand the local language of the study area.
4. The intervention was the use of the Sevoflurane in liver transplant and liver
transplantation without the Sevoflurane.
5. After the diseased donour transplant took place, the treatment allocation was decided.
6. The primary outcome was based on the events of 7 days after AST initiation which
represents the frequencies of the injuries associated with ischemia reperfusion.
7. Secondary outcomes were ALT and EAD that followed the scores generated by the
assessments of Claven Dindo Complications.
8. The blinding level in this study was moderate given that the sampled populations were
assigned to each protocol.
9. Sampling calculation:
Sample size determination
Case-control study
Total
92 43
144 193
D (cases)
(controls)
(prevalence of E in D) (prevalence of E in )
(sample size) (sample size)
Biostatistics
3
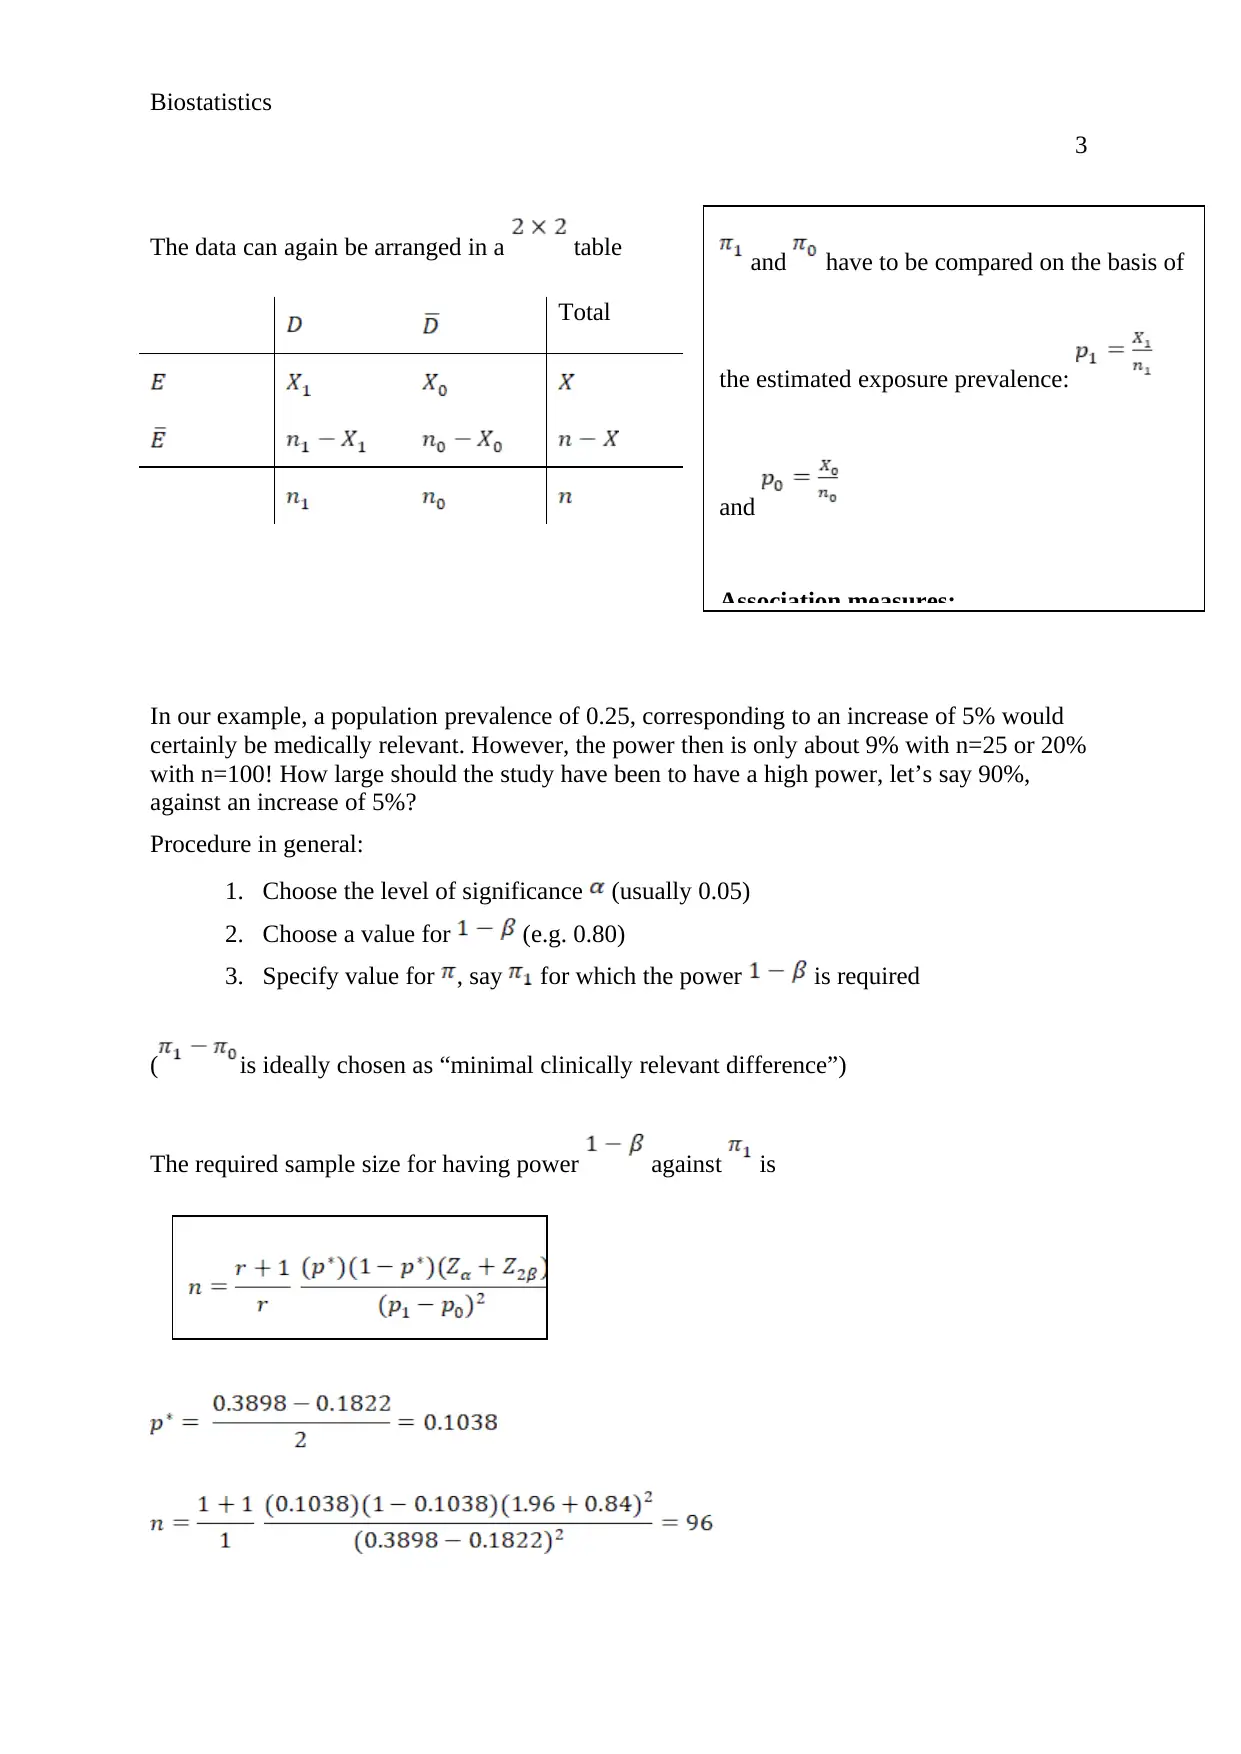
The data can again be arranged in a table
Total
In our example, a population prevalence of 0.25, corresponding to an increase of 5% would
certainly be medically relevant. However, the power then is only about 9% with n=25 or 20%
with n=100! How large should the study have been to have a high power, let’s say 90%,
against an increase of 5%?
Procedure in general:
1. Choose the level of significance (usually 0.05)
2. Choose a value for (e.g. 0.80)
3. Specify value for , say for which the power is required
( is ideally chosen as “minimal clinically relevant difference”)
The required sample size for having power against is
and have to be compared on the basis of
the estimated exposure prevalence:
and
Association measures:
3
The data can again be arranged in a table
Total
In our example, a population prevalence of 0.25, corresponding to an increase of 5% would
certainly be medically relevant. However, the power then is only about 9% with n=25 or 20%
with n=100! How large should the study have been to have a high power, let’s say 90%,
against an increase of 5%?
Procedure in general:
1. Choose the level of significance (usually 0.05)
2. Choose a value for (e.g. 0.80)
3. Specify value for , say for which the power is required
( is ideally chosen as “minimal clinically relevant difference”)
The required sample size for having power against is
and have to be compared on the basis of
the estimated exposure prevalence:
and
Association measures:
⊘ This is a preview!⊘
Do you want full access?
Subscribe today to unlock all pages.
Trusted by 1+ million students worldwide
Biostatistics
4
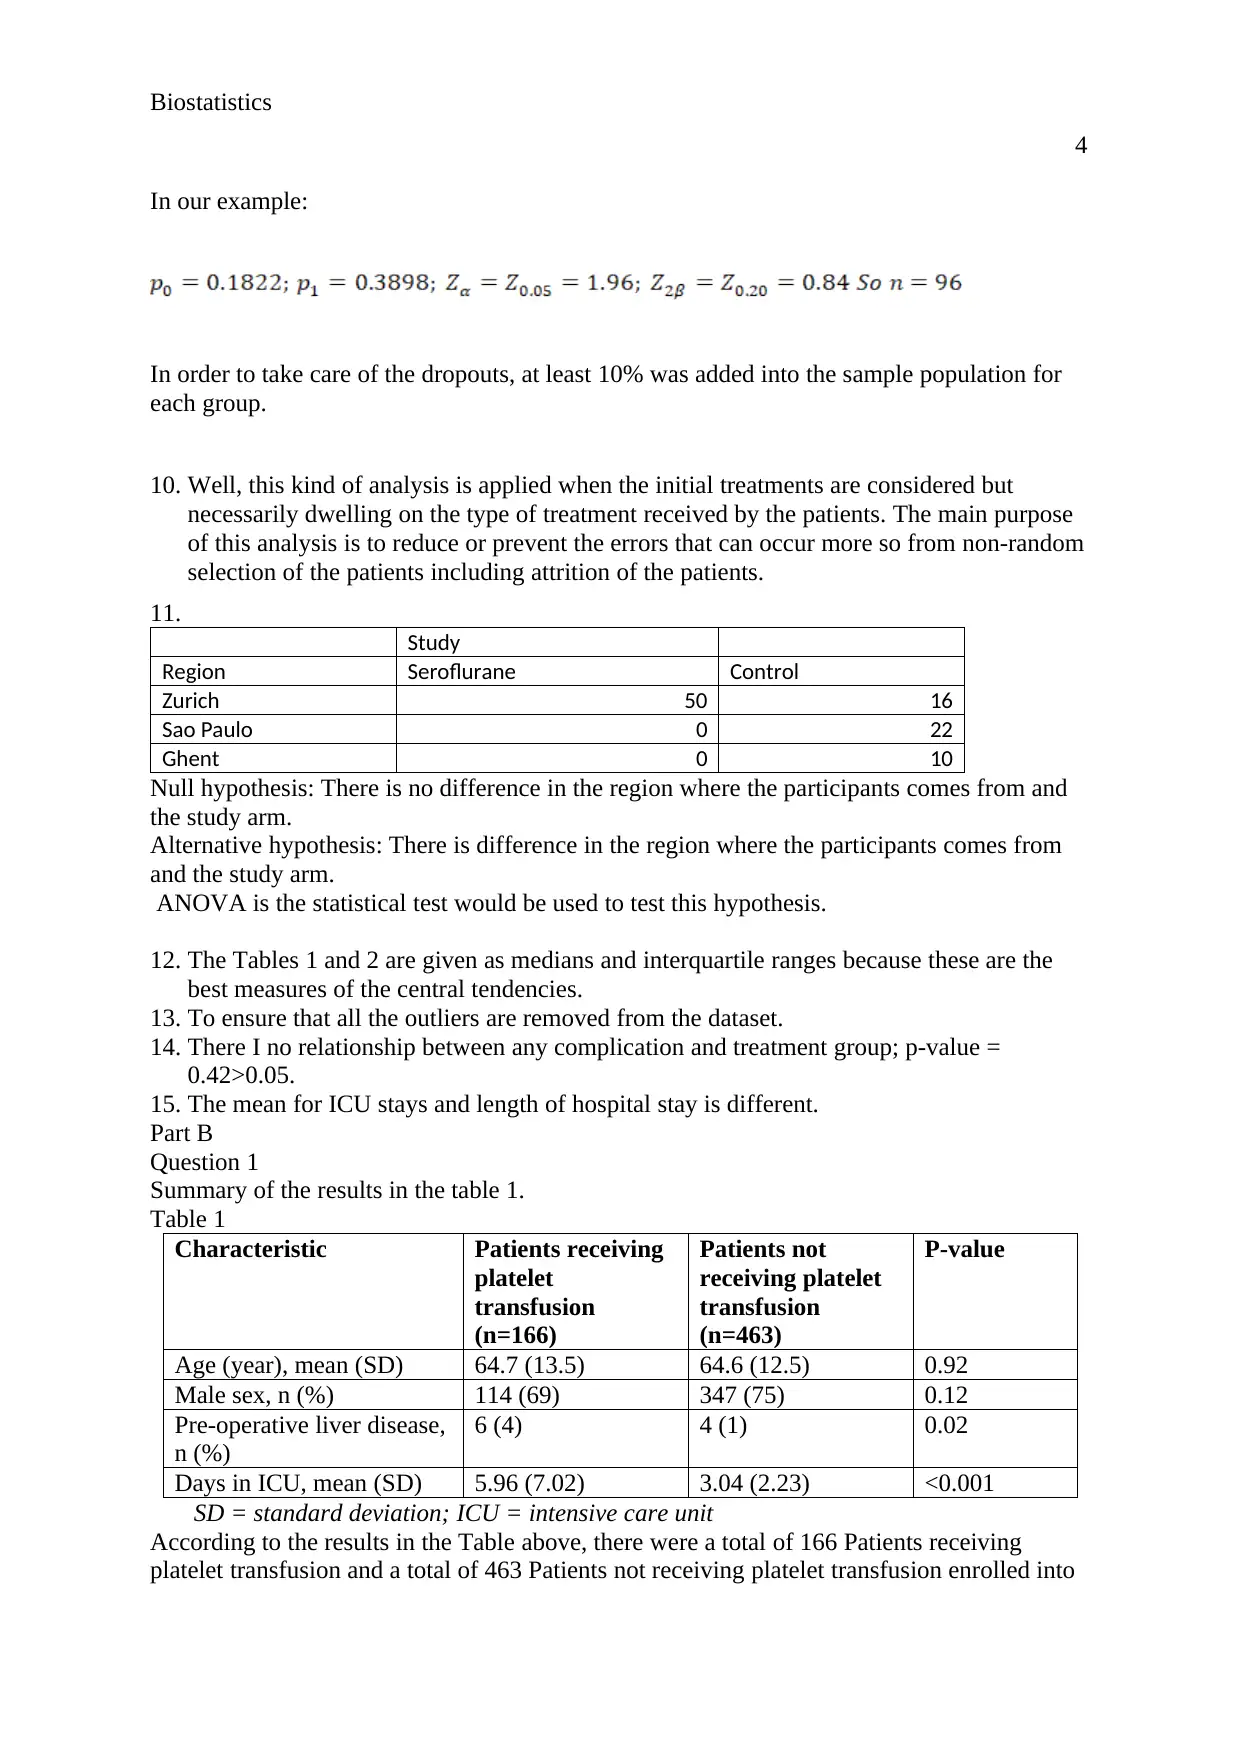
In our example:
In order to take care of the dropouts, at least 10% was added into the sample population for
each group.
10. Well, this kind of analysis is applied when the initial treatments are considered but
necessarily dwelling on the type of treatment received by the patients. The main purpose
of this analysis is to reduce or prevent the errors that can occur more so from non-random
selection of the patients including attrition of the patients.
11.
Study
Region Seroflurane Control
Zurich 50 16
Sao Paulo 0 22
Ghent 0 10
Null hypothesis: There is no difference in the region where the participants comes from and
the study arm.
Alternative hypothesis: There is difference in the region where the participants comes from
and the study arm.
ANOVA is the statistical test would be used to test this hypothesis.
12. The Tables 1 and 2 are given as medians and interquartile ranges because these are the
best measures of the central tendencies.
13. To ensure that all the outliers are removed from the dataset.
14. There I no relationship between any complication and treatment group; p-value =
0.42>0.05.
15. The mean for ICU stays and length of hospital stay is different.
Part B
Question 1
Summary of the results in the table 1.
Table 1
Characteristic Patients receiving
platelet
transfusion
(n=166)
Patients not
receiving platelet
transfusion
(n=463)
P-value
Age (year), mean (SD) 64.7 (13.5) 64.6 (12.5) 0.92
Male sex, n (%) 114 (69) 347 (75) 0.12
Pre-operative liver disease,
n (%)
6 (4) 4 (1) 0.02
Days in ICU, mean (SD) 5.96 (7.02) 3.04 (2.23) <0.001
SD = standard deviation; ICU = intensive care unit
According to the results in the Table above, there were a total of 166 Patients receiving
platelet transfusion and a total of 463 Patients not receiving platelet transfusion enrolled into
4
In our example:
In order to take care of the dropouts, at least 10% was added into the sample population for
each group.
10. Well, this kind of analysis is applied when the initial treatments are considered but
necessarily dwelling on the type of treatment received by the patients. The main purpose
of this analysis is to reduce or prevent the errors that can occur more so from non-random
selection of the patients including attrition of the patients.
11.
Study
Region Seroflurane Control
Zurich 50 16
Sao Paulo 0 22
Ghent 0 10
Null hypothesis: There is no difference in the region where the participants comes from and
the study arm.
Alternative hypothesis: There is difference in the region where the participants comes from
and the study arm.
ANOVA is the statistical test would be used to test this hypothesis.
12. The Tables 1 and 2 are given as medians and interquartile ranges because these are the
best measures of the central tendencies.
13. To ensure that all the outliers are removed from the dataset.
14. There I no relationship between any complication and treatment group; p-value =
0.42>0.05.
15. The mean for ICU stays and length of hospital stay is different.
Part B
Question 1
Summary of the results in the table 1.
Table 1
Characteristic Patients receiving
platelet
transfusion
(n=166)
Patients not
receiving platelet
transfusion
(n=463)
P-value
Age (year), mean (SD) 64.7 (13.5) 64.6 (12.5) 0.92
Male sex, n (%) 114 (69) 347 (75) 0.12
Pre-operative liver disease,
n (%)
6 (4) 4 (1) 0.02
Days in ICU, mean (SD) 5.96 (7.02) 3.04 (2.23) <0.001
SD = standard deviation; ICU = intensive care unit
According to the results in the Table above, there were a total of 166 Patients receiving
platelet transfusion and a total of 463 Patients not receiving platelet transfusion enrolled into
Paraphrase This Document
Need a fresh take? Get an instant paraphrase of this document with our AI Paraphraser
Biostatistics
5
the observational study. The results show that the mean age and standard deviation of the
Patients receiving platelet transfusion was higher with a mean of 64.7 years with a standard
deviation of 13.5 compared to the mean and standard deviation of the Patients not receiving
platelet transfusion given as 64.6 years and a standard deviation of 12.5 respectively. On
average, the Patients receiving platelet transfusion seems to be older than the Patients not
receiving platelet transfusion. However, the results confirmed that the mean age difference of
the Patients receiving platelet transfusion and the Patients not receiving platelet transfusion is
not statistically significant, (p-value = 0.92>0.05). hence, it is just by chance that the Patients
receiving platelet transfusion appeared to be older than the Patients not receiving platelet
transfusion.
Furthermore, the findings on gender indicate that most of the Patients receiving platelet
transfusion were male; 114 (69%) while the female counterparts only accounted for 52
(31%). Similarly, most of the Patients not receiving platelet transfusion were males; 347
(75%) as compared to the female colleagues who only account for 116 (25%) of the total 463
Patients not receiving platelet transfusion. Again, the results indicate that there is no gender
difference for the Patients receiving platelet transfusion and the Patients not receiving platelet
transfusion; (p-value = 0.12>0.05). therefore, it is just by chance that male participants
outweigh the female counterparts in the two groups of the participants.
Moreover, the results of the Pre-operative liver disease indicate that only 6 (4%) of the
Patients receiving platelet transfusion had the pre-operative liver diseases whereas 160 (96%)
did not. Again, the results show that 4 (1%) of the Patients not receiving platelet transfusion
had the pre-operative liver disease unlike to 359 (99%) who had no pre-operative liver
disease. The results further indicate that there is a statistically significant difference of the
patients with a pre-operative liver disease in both the groups; (p-value = 0.02<0.05). Hence, it
is prudent to conclude that Patients receiving platelet transfusion appeared to be more likely
to develop a pre-operative liver disease than the Patients not receiving platelet transfusion.
Finally, the results of the days taken in the intensive care unity show that the mean and
standard deviation for the Patients receiving platelet transfusion is 5.96 and 7.02 respectively
whereas the results for the Patients not receiving platelet transfusion are given as 3.04 and
2.23 respectively. Similarly, the number of days taken in intensive care unit and whether the
Patients is receiving platelet transfusion or the Patients not receiving platelet transfusion is
statistically significant, (p-value<0.001). The implication is that subjecting the Patients to
receiving platelet transfusion has an influence in the number of days taken in the intensive
care unit.
Different way of presenting the summary statistics
Basically, there different proportions of the study participants within each group. For
example, there were a total of 166 Patients receiving platelet transfusion and a total of 463
Patients not receiving platelet transfusion enrolled into the observational study. Hence, it was
not prudent to generate one table comparing the characteristics given that the proportions are
not the same. As a way of improving the presentation of the findings, it is in order to compare
the results of each characteristics for every group of the patients. On this note, gender
difference would have been presented differently depending on the arm of the study. This
would have improved on the precision of the presentation of the findings. Otherwise, it is
confusing to compare the table findings while the group of the study participants are not the
same.

Biostatistics
6
Question 2
Table 2
Characteristic Intraoperative
platelet transfusion
adjusted OR (95%
CI)
Perioperative platelet
transfusion adjusted
OR (95% CI)
Mild pre-operative liver disease 6.43 (1.17, 35.37) 6.70 (1.20, 37.49)
Preoperative thienopyridines 0.44 (0.26, 0.76) 0.51 (0.29, 0.88)
Duration of CPB (in units of 30 mins) 1.49 (1.30, 1.70) 1.43 (1.24, 1.65)
Post-operative chest tube drainage
(in units of 500 mL)
- 2.14 (1.62, 2.82)
OR = odds ratio; 95% CI = 95% confidence interval; CPB = cardiopulmonary bypass
a)
Normally, in statistics, the term adjusted odds ratio is used when identifying the strength of
relationship between the exposure variable and the outcome variable, (Lloyd-Jones, et, al,
2018). In research, it helps the researchers especially those conducting an experiment to
compare the relative effects of a given product like drug or any given treatment outcome for
two groups of patients. For instance, adjusted OR in the above results show the comparison
of the relative effects of the Intraoperative platelet transfusion and Perioperative platelet
transfusion among the patients. This help researchers understand and compare the two
outcomes. Again, adjusted OR show how strong is the association between two treatment
outcomes so that effective decision can be made.
b)
Based on the results in table 2, the risk of platelet transfusion is increased by the Mild pre-
operative liver disease for the Perioperative platelet transfusion than the Intraoperative
platelet transfusion, (Greenland, et, al, 2016). For example, the patients under the
Perioperative platelet transfusion 6.7 times more likely to develop Mild pre-operative liver
disease than the patients under the Intraoperative platelet transfusion category; (95% CI; 6.7
(1.2, 37.49)> 95% CI; 6.43 (1.17, 35.37).
In addition, Preoperative thienopyridines are high among Perioperative platelet transfusion
patients than Intraoperative platelet transfusion patients. For instance, patients under
Perioperative platelet transfusion are more than half likely to develop the Preoperative
thienopyridines than the patients under the Intraoperative platelet transfusion; (95% CI; 0.51
(0.29, 0.88) > 95% CI; 0.44 (0.26, 0.76).
Finally, the Perioperative platelet transfusion patients are 2.14 times more likely to develop
Post-operative chest tube drainage (in units of 500 mL) than the Intraoperative platelet
transfusion patients; (95% CI; 2.14 (1.62, 2.82). This implies that Perioperative platelet
transfusion increases chances of developing the Post-operative chest tube drainage (in units
of 500 mL).
c)
However, Duration of CPB (in units of 30 mins) is less likely to be experienced in
Perioperative platelet transfusion patients compared to the Intraoperative platelet transfusion
patients. For instance, patients under Perioperative platelet transfusion are 1.43 times less
⊘ This is a preview!⊘
Do you want full access?
Subscribe today to unlock all pages.
Trusted by 1+ million students worldwide
Biostatistics
7
likely to develop the Duration of CPB (in units of 30 mins) than the patients under the
Intraoperative platelet transfusion; (95% CI; 1.43 (1.24, 1.65) < 95% CI; 1.49 (1.30, 1.70). in
other words, Duration of CPB (in units of 30 mins) is the only factor that is associated with a
decrease in risk of platelet transfusion.
d)
Well, the fact that there are no reported results for the relationship between post-operative
chest tube drainage and intraoperative platelet transfusion is since the post-operative chest
tube drainage and intraoperative platelet transfusion were considered as the reference
variables in the analysis, (Zeremdini, Messaoud, and Bouzid, 2017).
Question 3
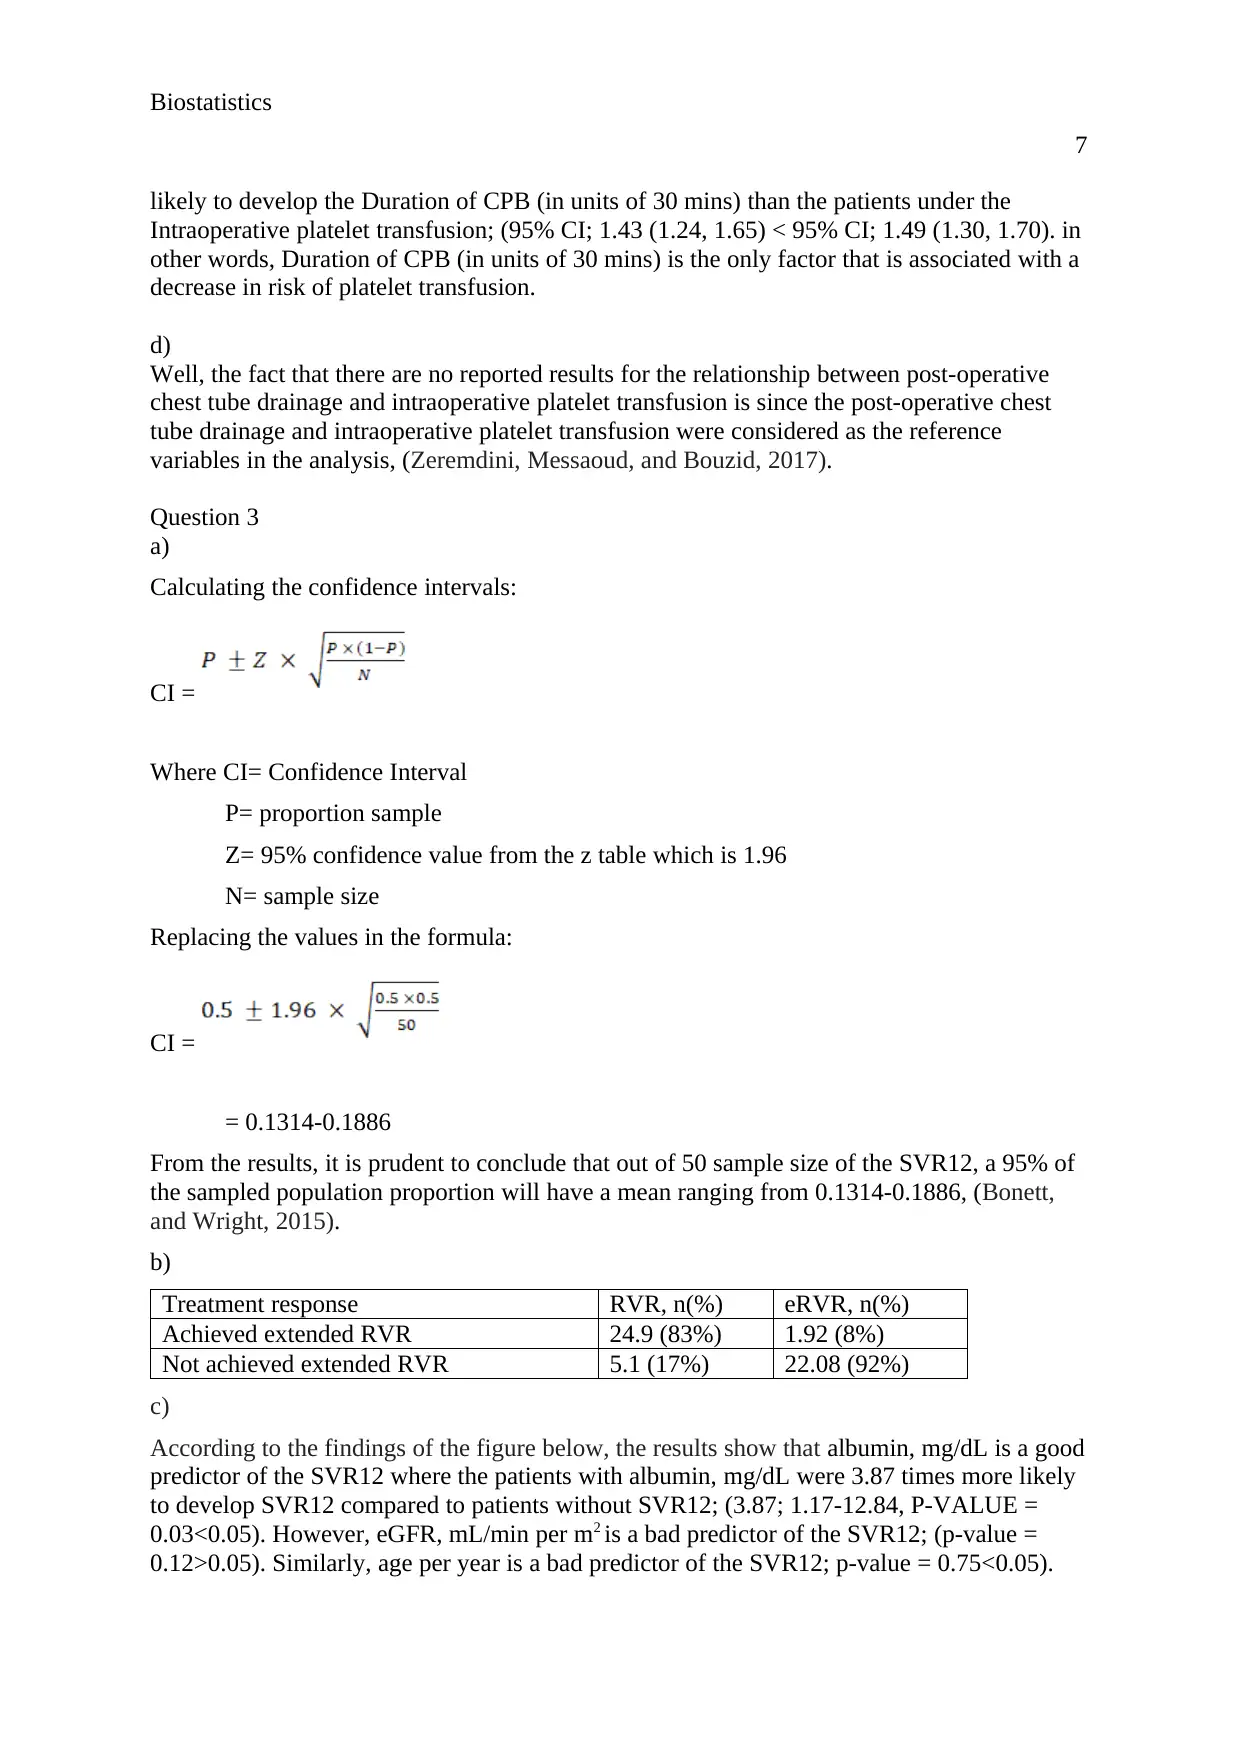
a)
Calculating the confidence intervals:
CI =
Where CI= Confidence Interval
P= proportion sample
Z= 95% confidence value from the z table which is 1.96
N= sample size
Replacing the values in the formula:
CI =
= 0.1314-0.1886
From the results, it is prudent to conclude that out of 50 sample size of the SVR12, a 95% of
the sampled population proportion will have a mean ranging from 0.1314-0.1886, (Bonett,
and Wright, 2015).
b)
Treatment response RVR, n(%) eRVR, n(%)
Achieved extended RVR 24.9 (83%) 1.92 (8%)
Not achieved extended RVR 5.1 (17%) 22.08 (92%)
c)
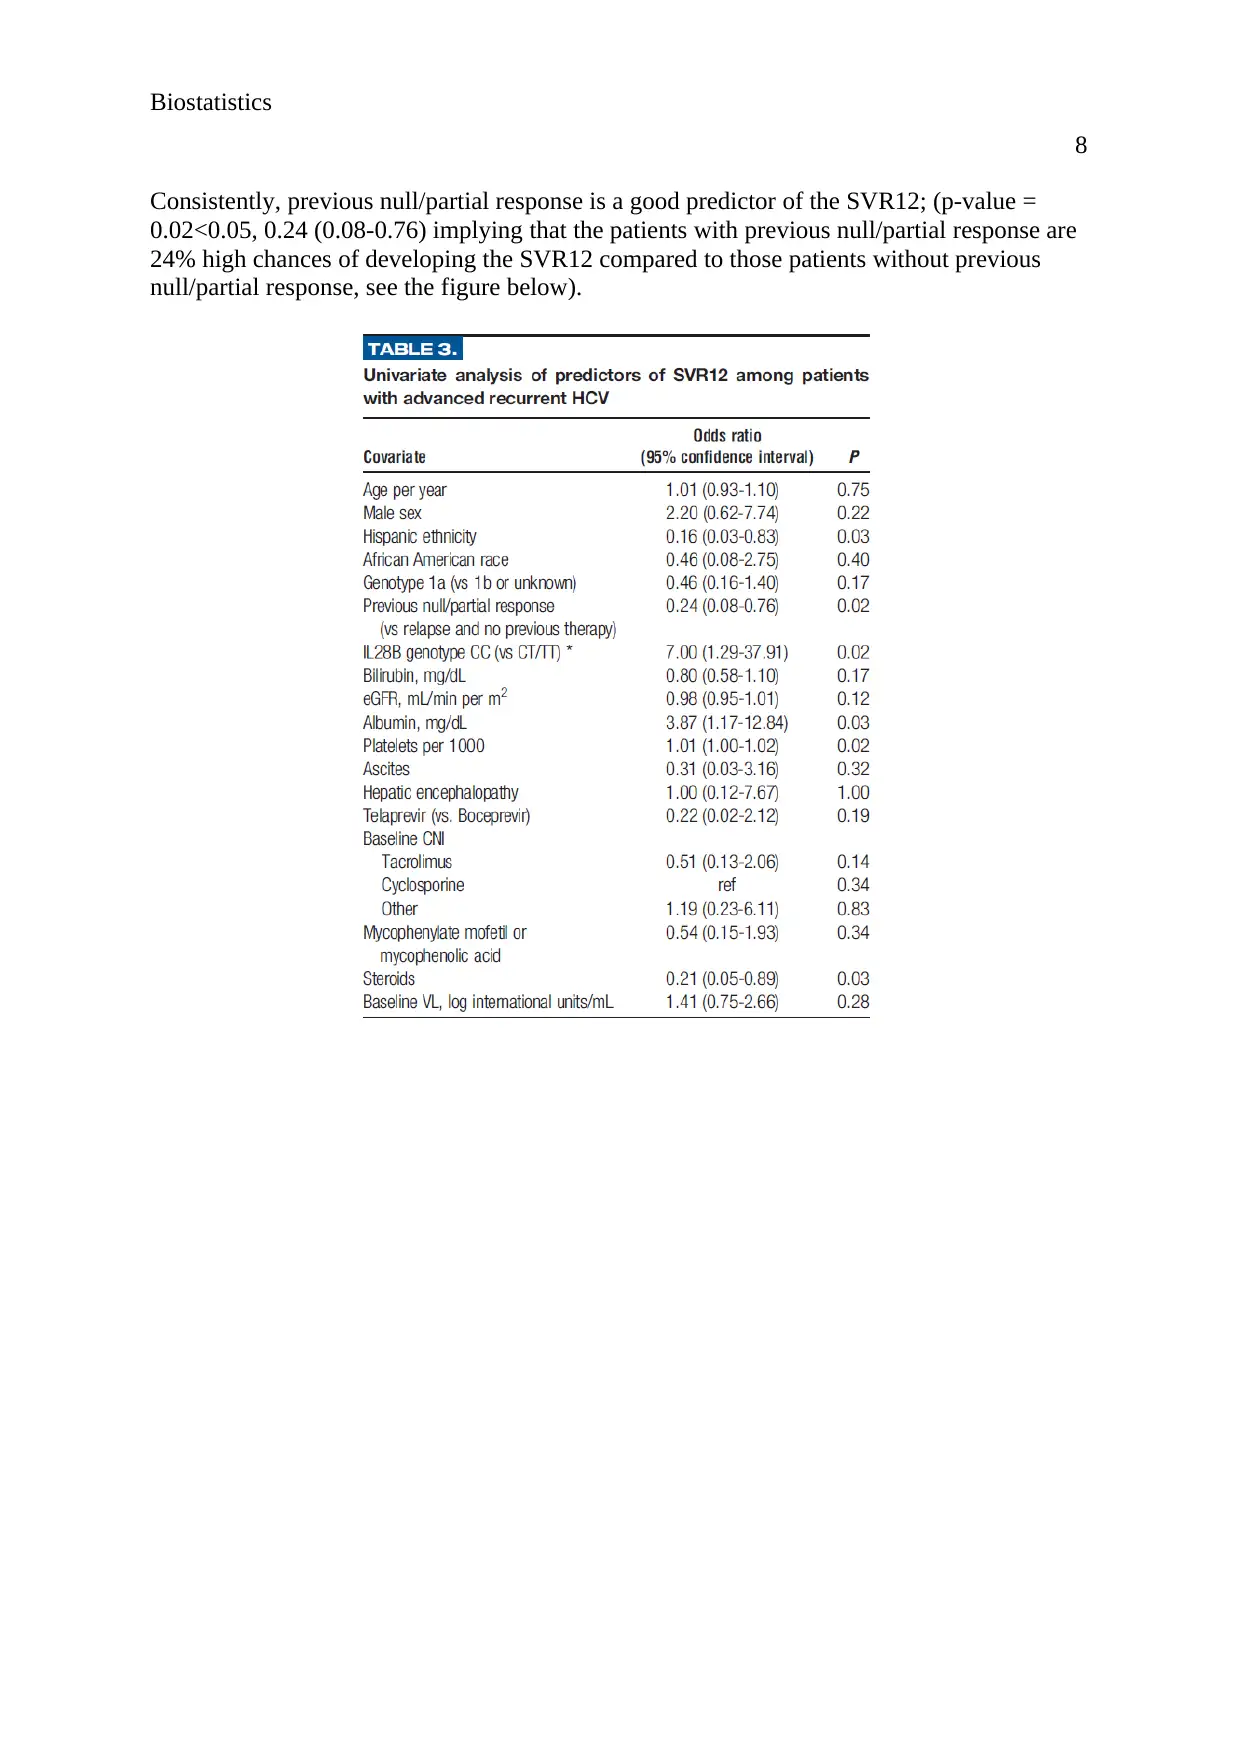
According to the findings of the figure below, the results show that albumin, mg/dL is a good
predictor of the SVR12 where the patients with albumin, mg/dL were 3.87 times more likely
to develop SVR12 compared to patients without SVR12; (3.87; 1.17-12.84, P-VALUE =
0.03<0.05). However, eGFR, mL/min per m2 is a bad predictor of the SVR12; (p-value =
0.12>0.05). Similarly, age per year is a bad predictor of the SVR12; p-value = 0.75<0.05).
7
likely to develop the Duration of CPB (in units of 30 mins) than the patients under the
Intraoperative platelet transfusion; (95% CI; 1.43 (1.24, 1.65) < 95% CI; 1.49 (1.30, 1.70). in
other words, Duration of CPB (in units of 30 mins) is the only factor that is associated with a
decrease in risk of platelet transfusion.
d)
Well, the fact that there are no reported results for the relationship between post-operative
chest tube drainage and intraoperative platelet transfusion is since the post-operative chest
tube drainage and intraoperative platelet transfusion were considered as the reference
variables in the analysis, (Zeremdini, Messaoud, and Bouzid, 2017).
Question 3
a)
Calculating the confidence intervals:
CI =
Where CI= Confidence Interval
P= proportion sample
Z= 95% confidence value from the z table which is 1.96
N= sample size
Replacing the values in the formula:
CI =
= 0.1314-0.1886
From the results, it is prudent to conclude that out of 50 sample size of the SVR12, a 95% of
the sampled population proportion will have a mean ranging from 0.1314-0.1886, (Bonett,
and Wright, 2015).
b)
Treatment response RVR, n(%) eRVR, n(%)
Achieved extended RVR 24.9 (83%) 1.92 (8%)
Not achieved extended RVR 5.1 (17%) 22.08 (92%)
c)
According to the findings of the figure below, the results show that albumin, mg/dL is a good
predictor of the SVR12 where the patients with albumin, mg/dL were 3.87 times more likely
to develop SVR12 compared to patients without SVR12; (3.87; 1.17-12.84, P-VALUE =
0.03<0.05). However, eGFR, mL/min per m2 is a bad predictor of the SVR12; (p-value =
0.12>0.05). Similarly, age per year is a bad predictor of the SVR12; p-value = 0.75<0.05).
Paraphrase This Document
Need a fresh take? Get an instant paraphrase of this document with our AI Paraphraser
Biostatistics
8
Consistently, previous null/partial response is a good predictor of the SVR12; (p-value =
0.02<0.05, 0.24 (0.08-0.76) implying that the patients with previous null/partial response are
24% high chances of developing the SVR12 compared to those patients without previous
null/partial response, see the figure below).
Biostatistics
9
References
Beck-Schimmer, B., Bonvini, J.M., Schadde, E., Dutkowski, P., Oberkofler, C.E., Lesurtel,
M., DeOliveira, M.L., Figueira, E.R., Rocha Filho, J.A., Auler Jr, J.O.C. and Luiz, A.D.,
2015. Conditioning with sevoflurane in liver transplantation: results of a multicenter
randomized controlled trial. Transplantation, 99(8), pp.1606-1612.
Bonett, D.G. and Wright, T.A., 2015. Cronbach's alpha reliability: Interval estimation,
hypothesis testing, and sample size planning. Journal of Organizational Behavior, 36(1),
pp.3-15.
Greenland, S., Senn, S.J., Rothman, K.J., Carlin, J.B., Poole, C., Goodman, S.N. and Altman,
D.G., 2016. Statistical tests, P values, confidence intervals, and power: a guide to
misinterpretations. European journal of epidemiology, 31(4), pp.337-350.
Lloyd-Jones, L.R., Robinson, M.R., Yang, J. and Visscher, P.M., 2018. Transformation of
summary statistics from linear mixed model association on all-or-none traits to odds ratio.
Genetics, 208(4), pp.1397-1408.
Zeremdini, J., Messaoud, M.A.B. and Bouzid, A., 2017, May. Evaluation of multipitch
estimation by multi-scale product analysis. In 2017 International Conference on Engineering
& MIS (ICEMIS) (pp. 1-6). IEEE.
⊘ This is a preview!⊘
Do you want full access?
Subscribe today to unlock all pages.
Trusted by 1+ million students worldwide
1 out of 9
Related Documents


Your All-in-One AI-Powered Toolkit for Academic Success.
+13062052269
info@desklib.com
Available 24*7 on WhatsApp / Email
![[object Object]](/_next/static/media/star-bottom.7253800d.svg)
Unlock your academic potential
Copyright © 2020–2026 A2Z Services. All Rights Reserved. Developed and managed by ZUCOL.