PUBH620 Biostatistics Assessment Task 1: Data Analysis Report
VerifiedAdded on 2023/01/20
|16
|2232
|87
Homework Assignment
AI Summary
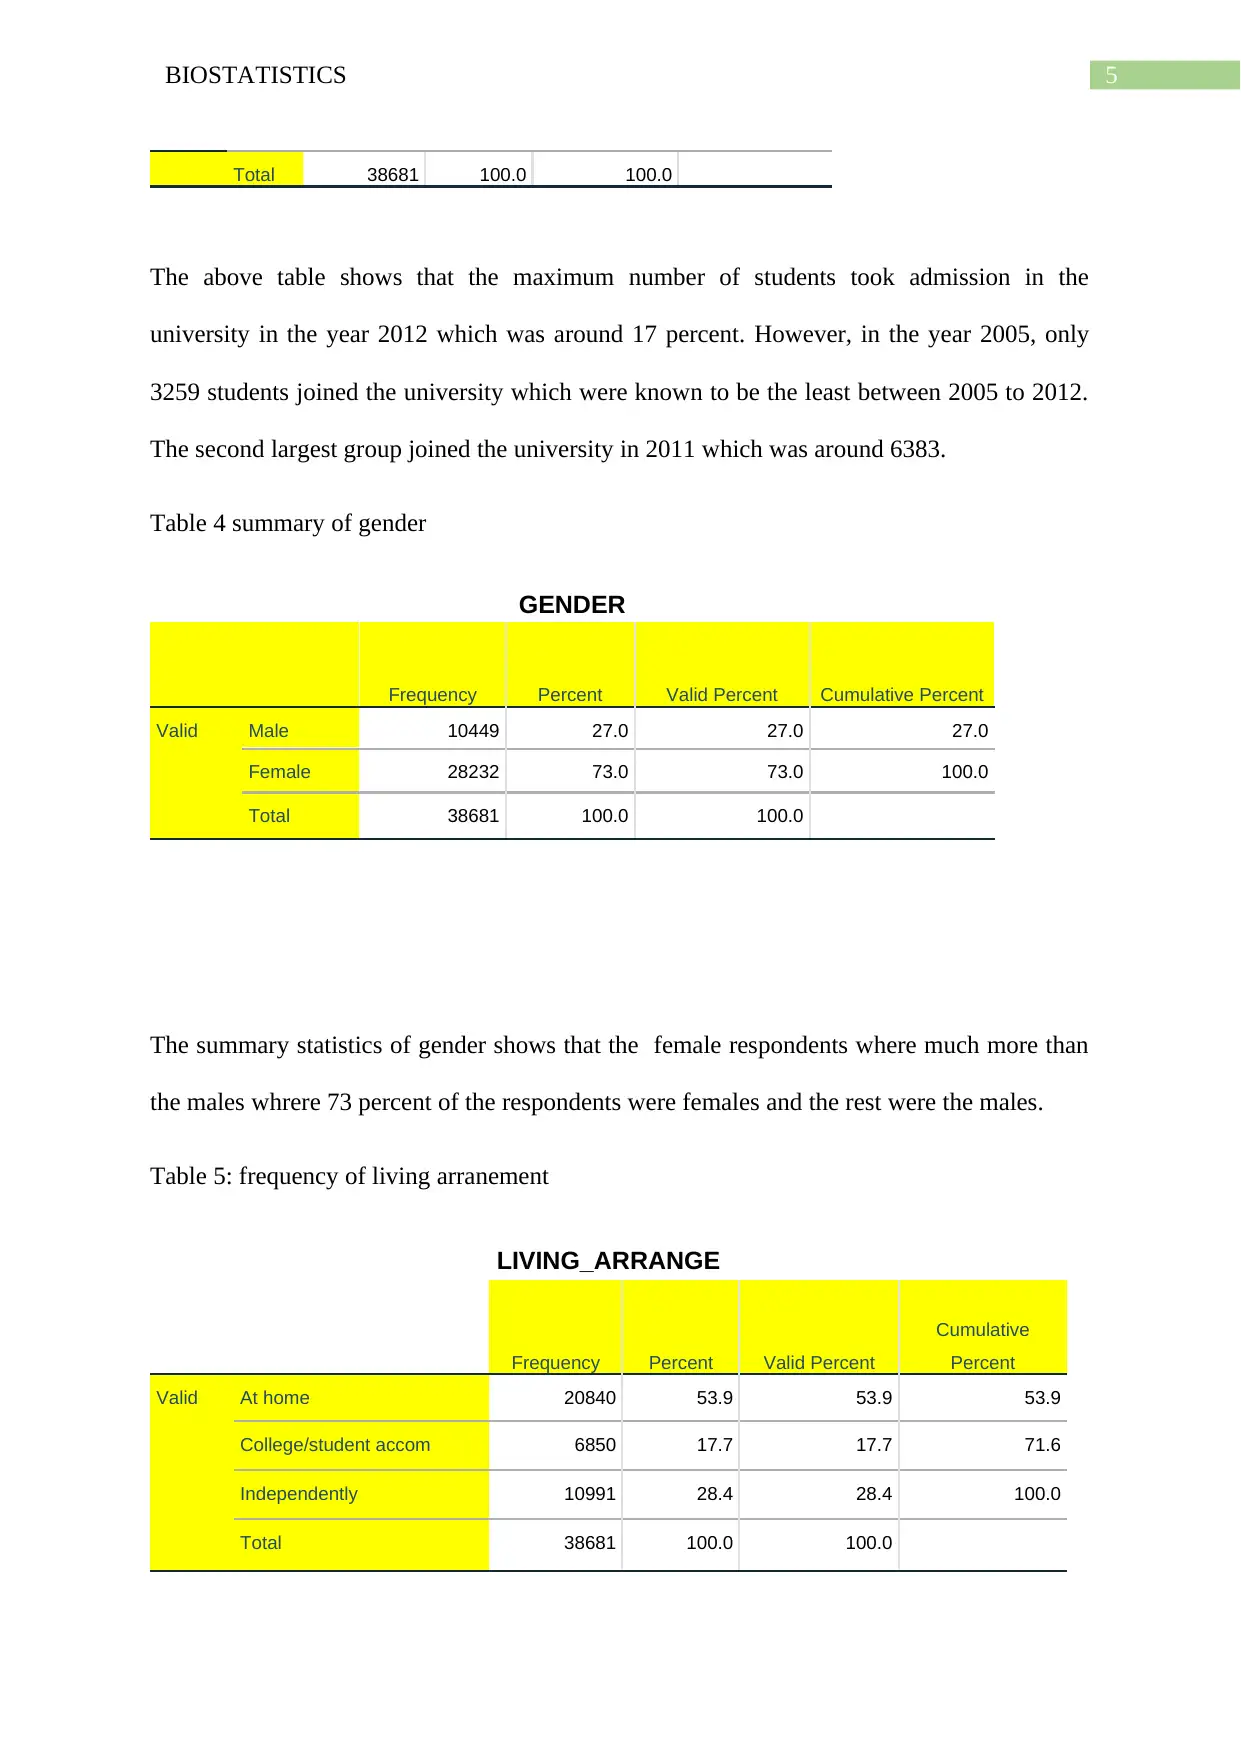
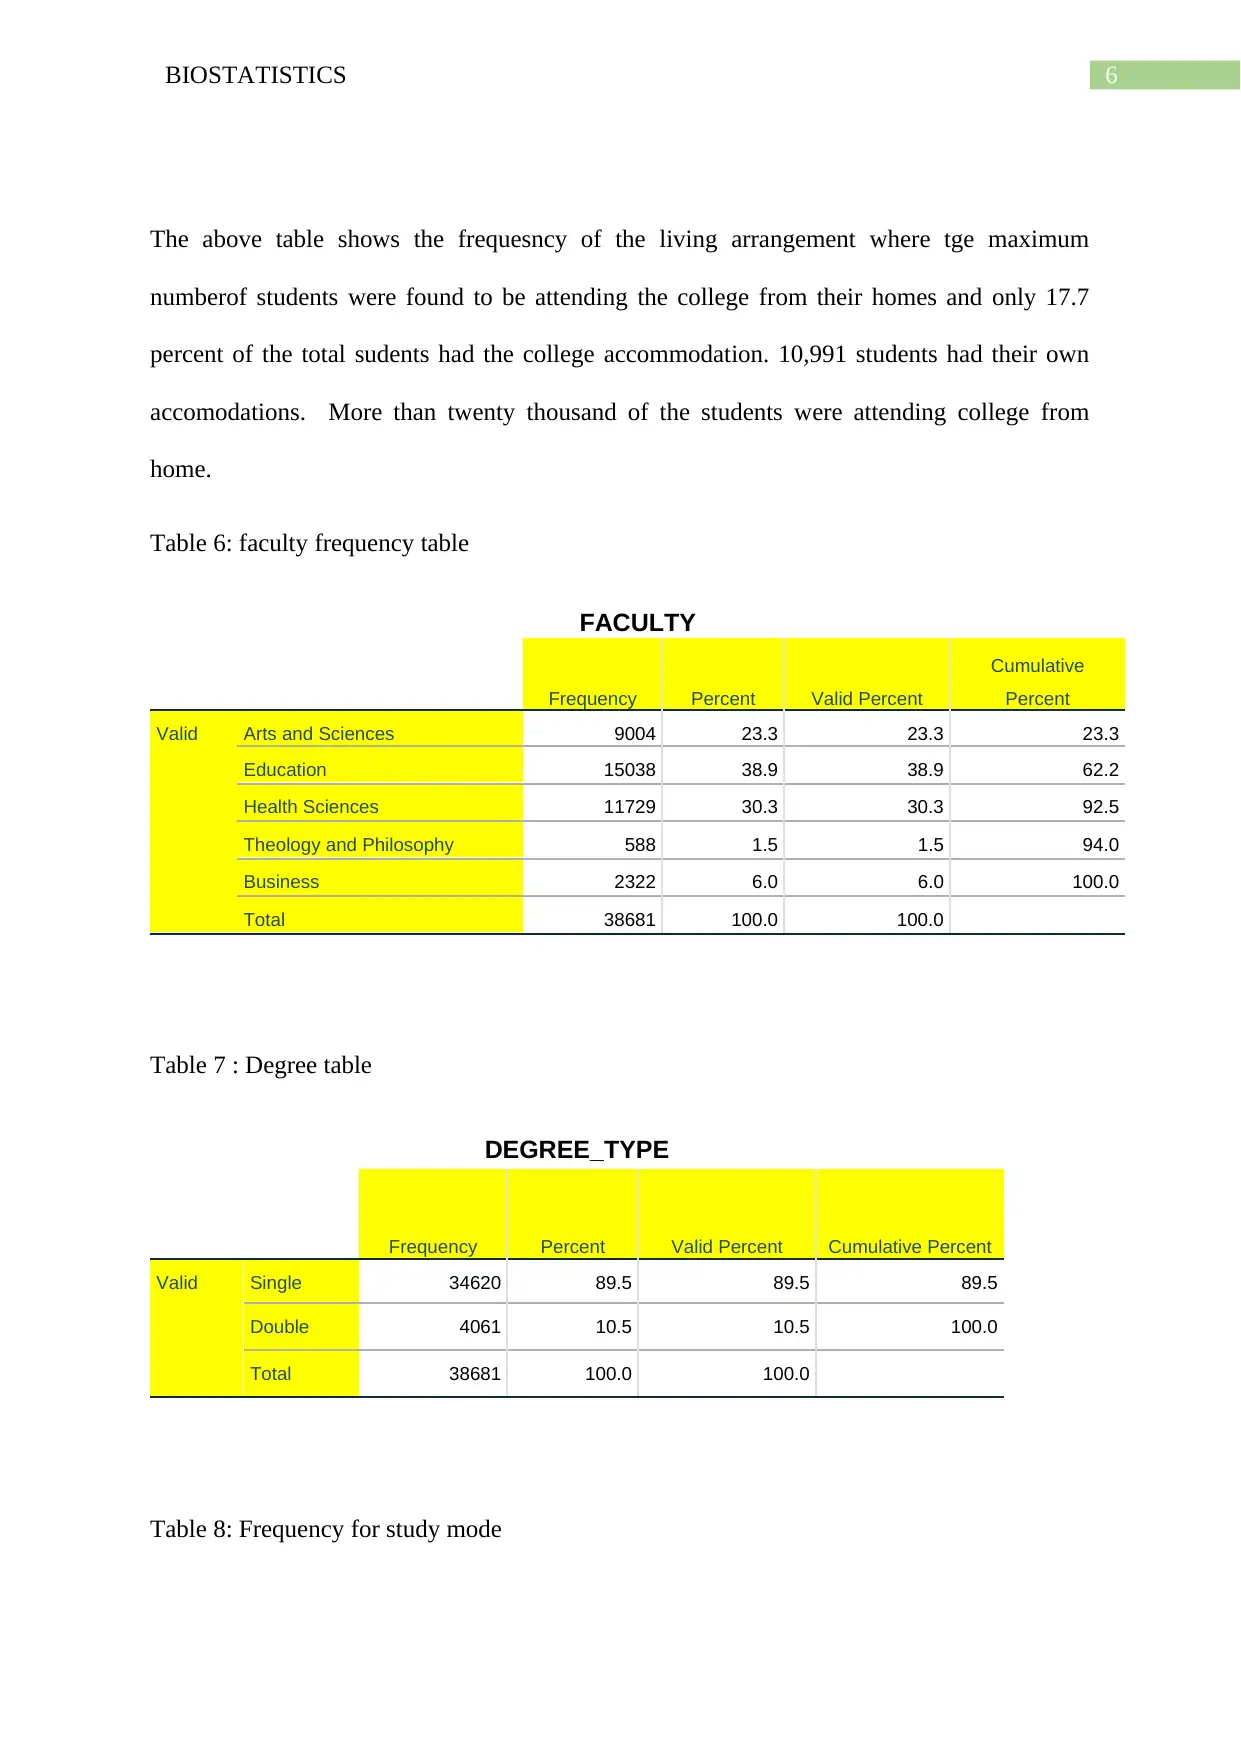
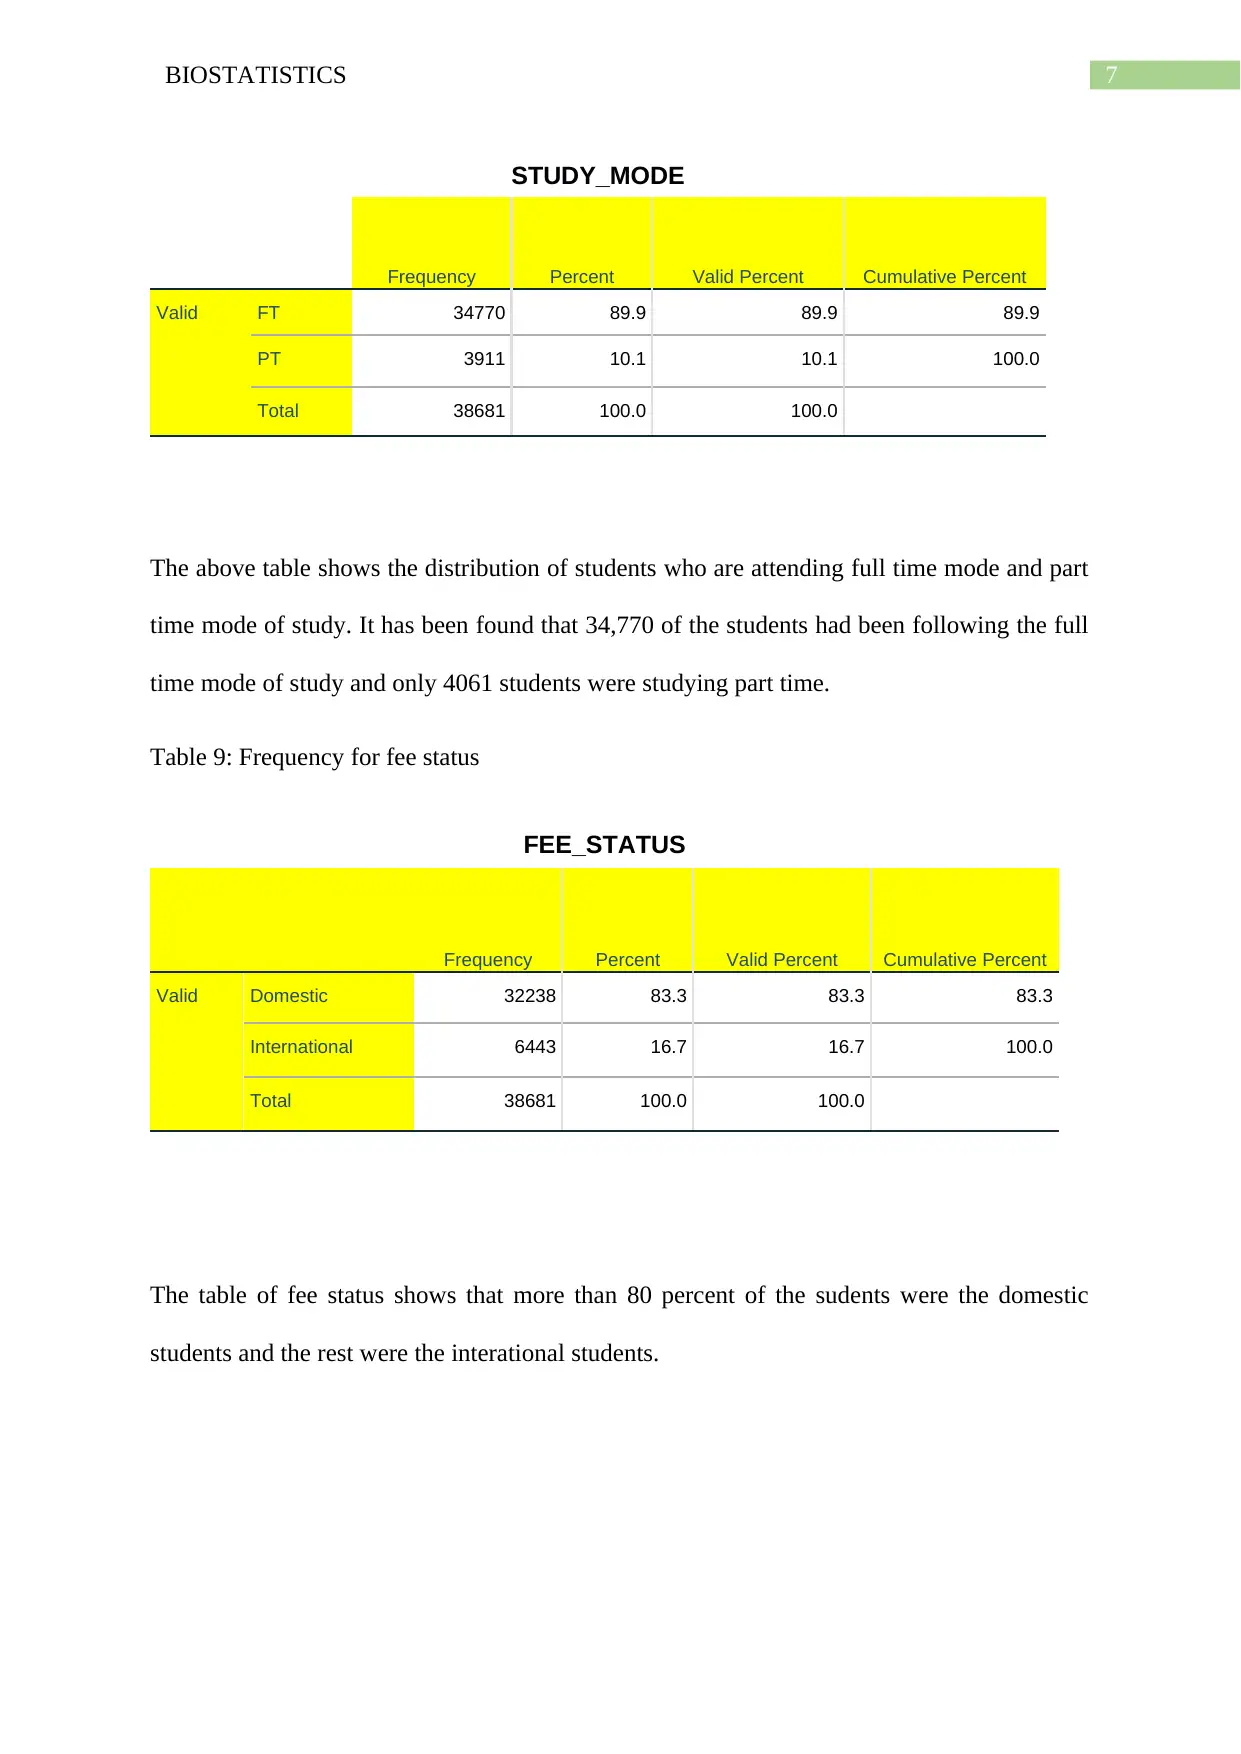
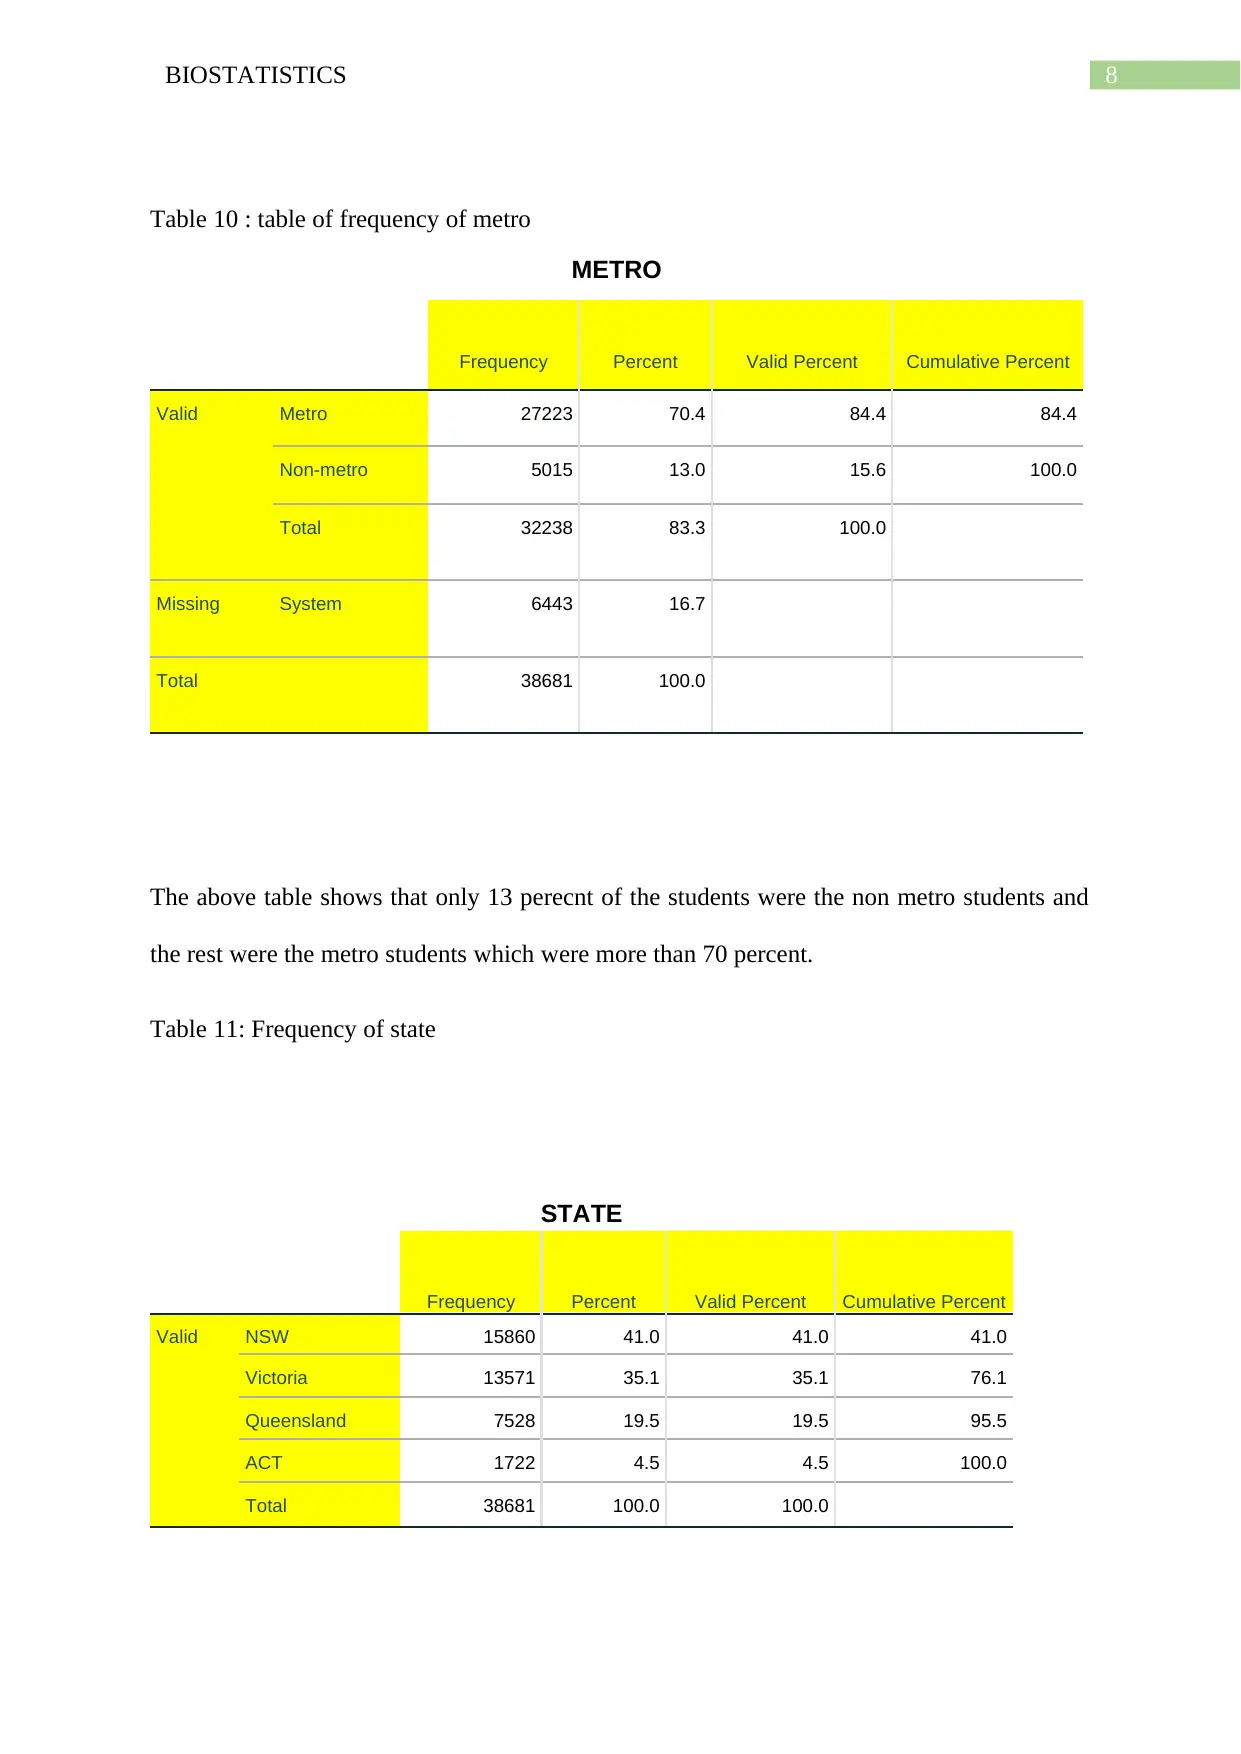
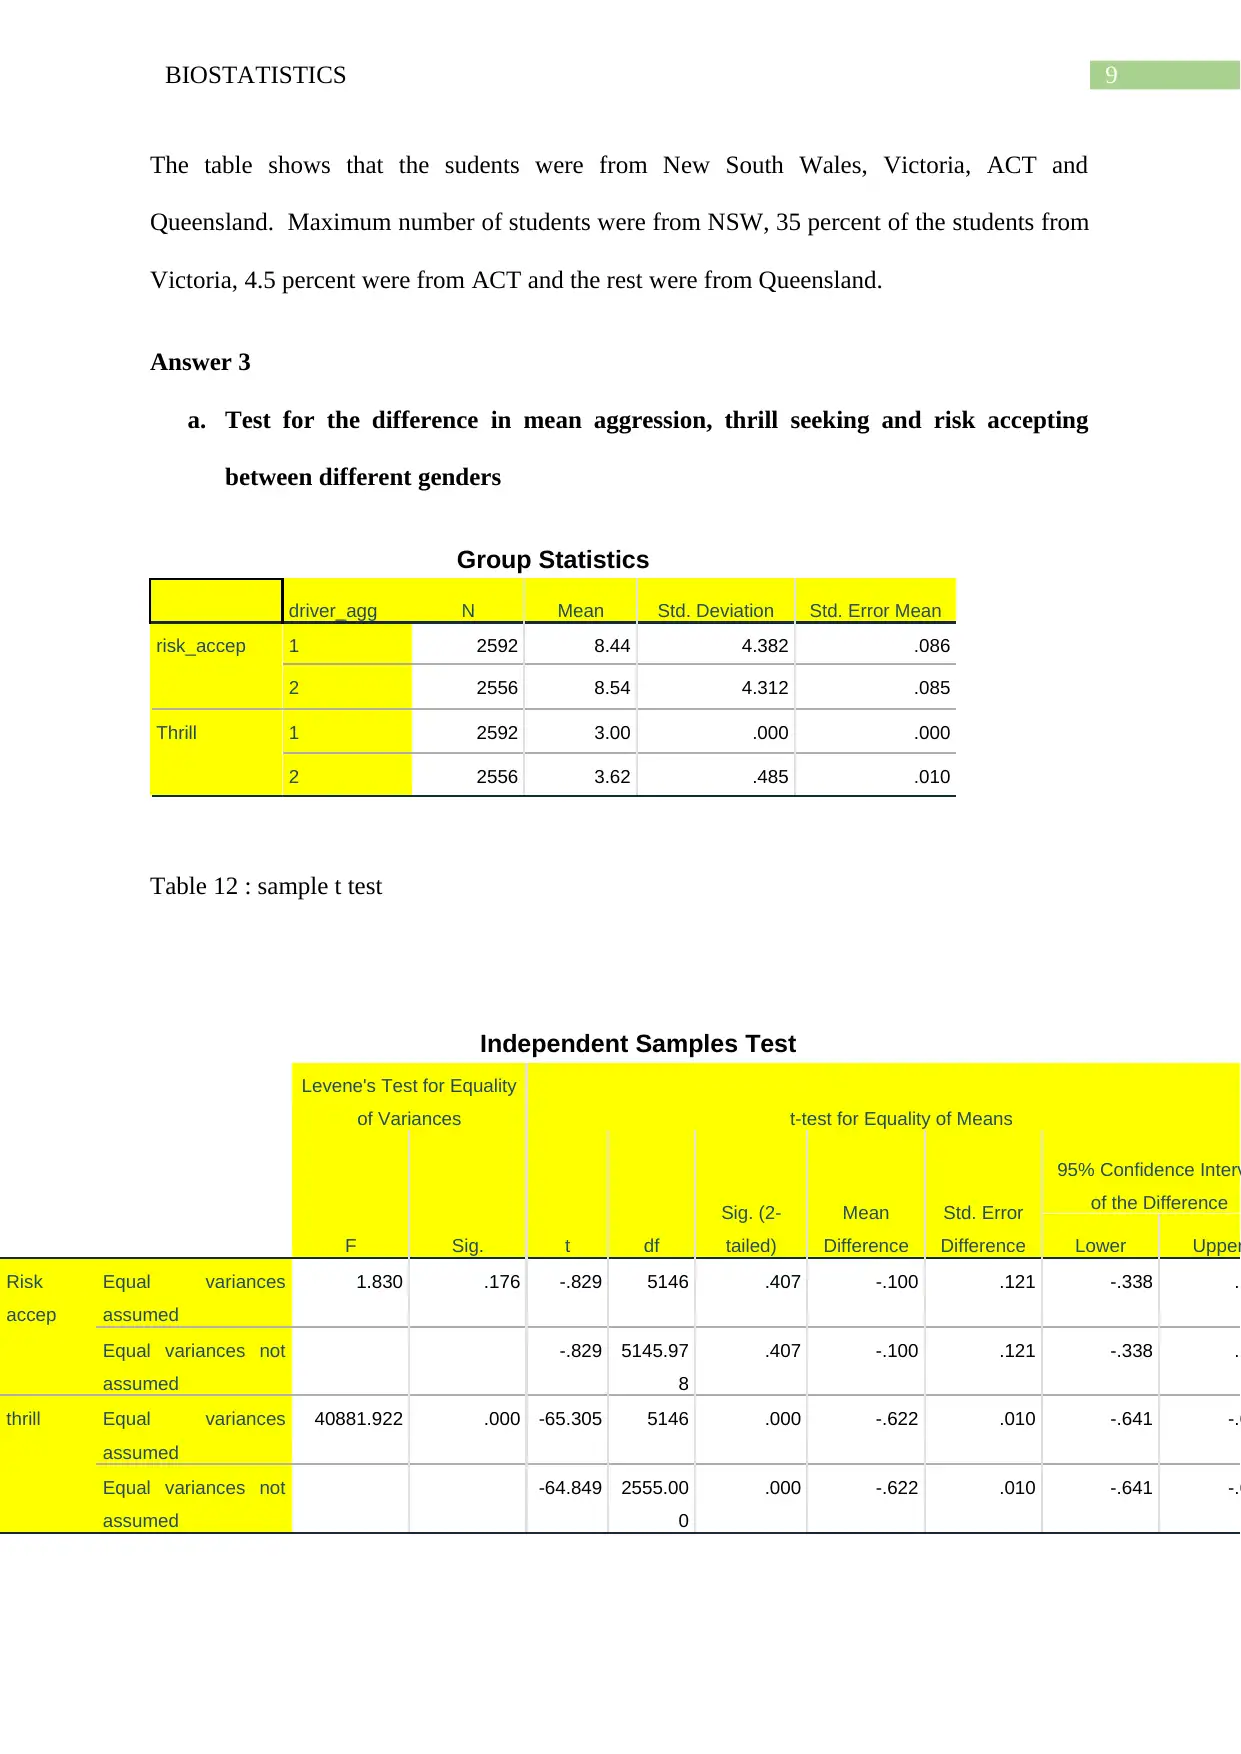
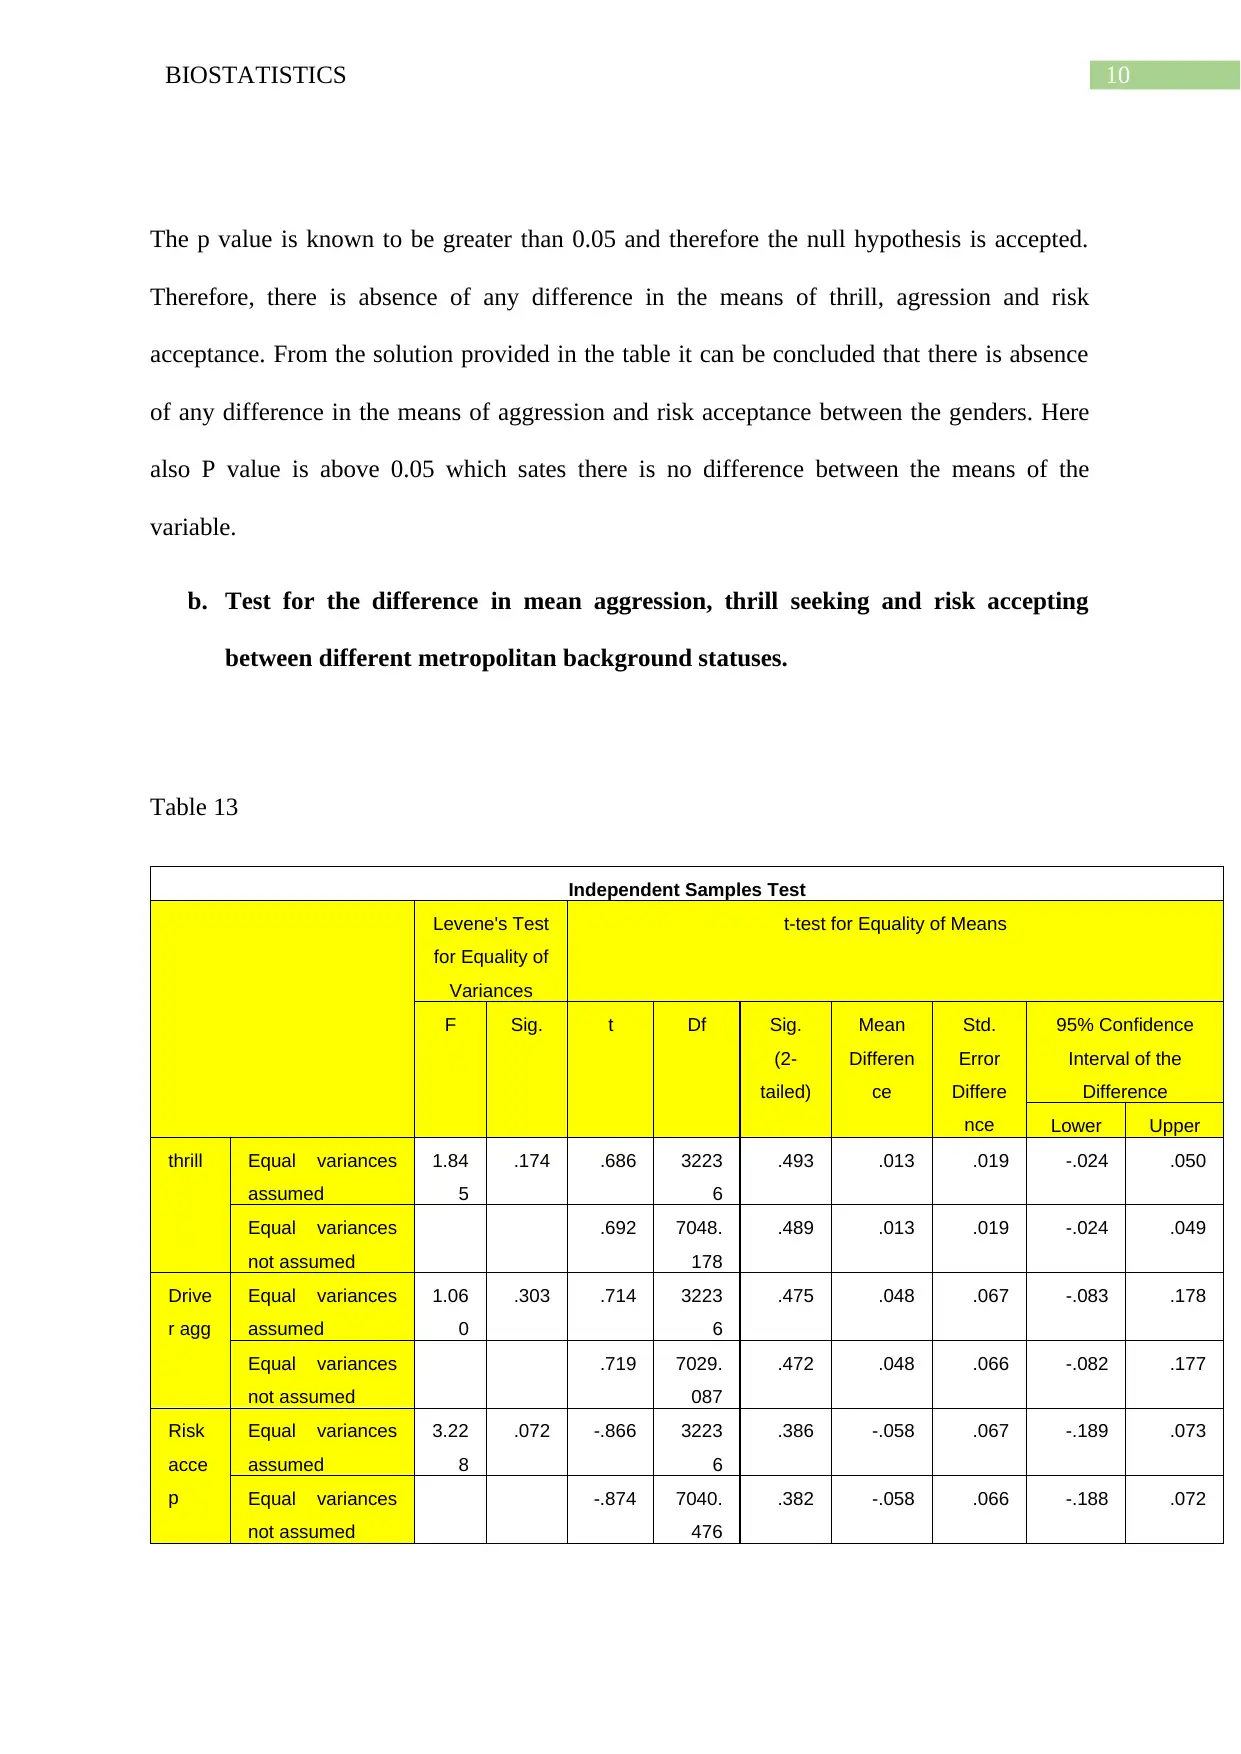
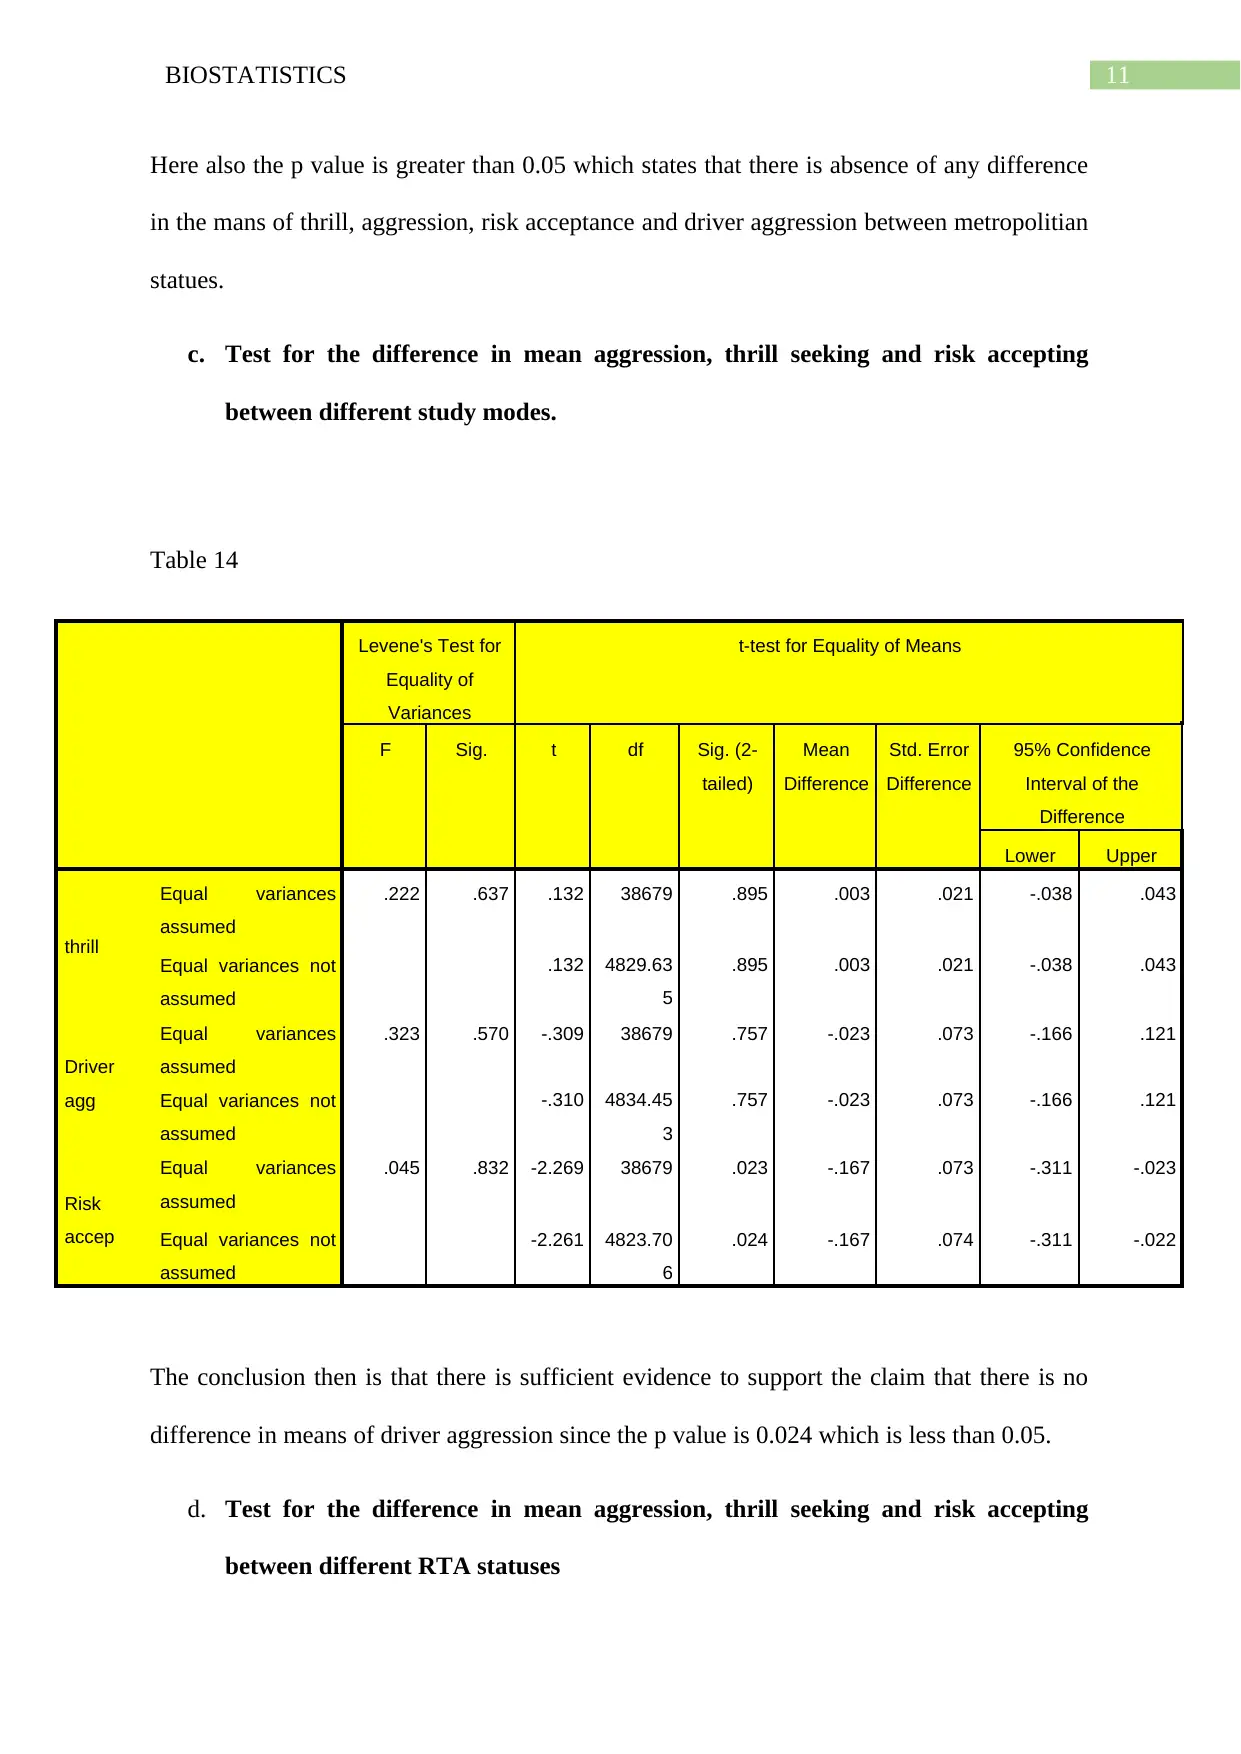
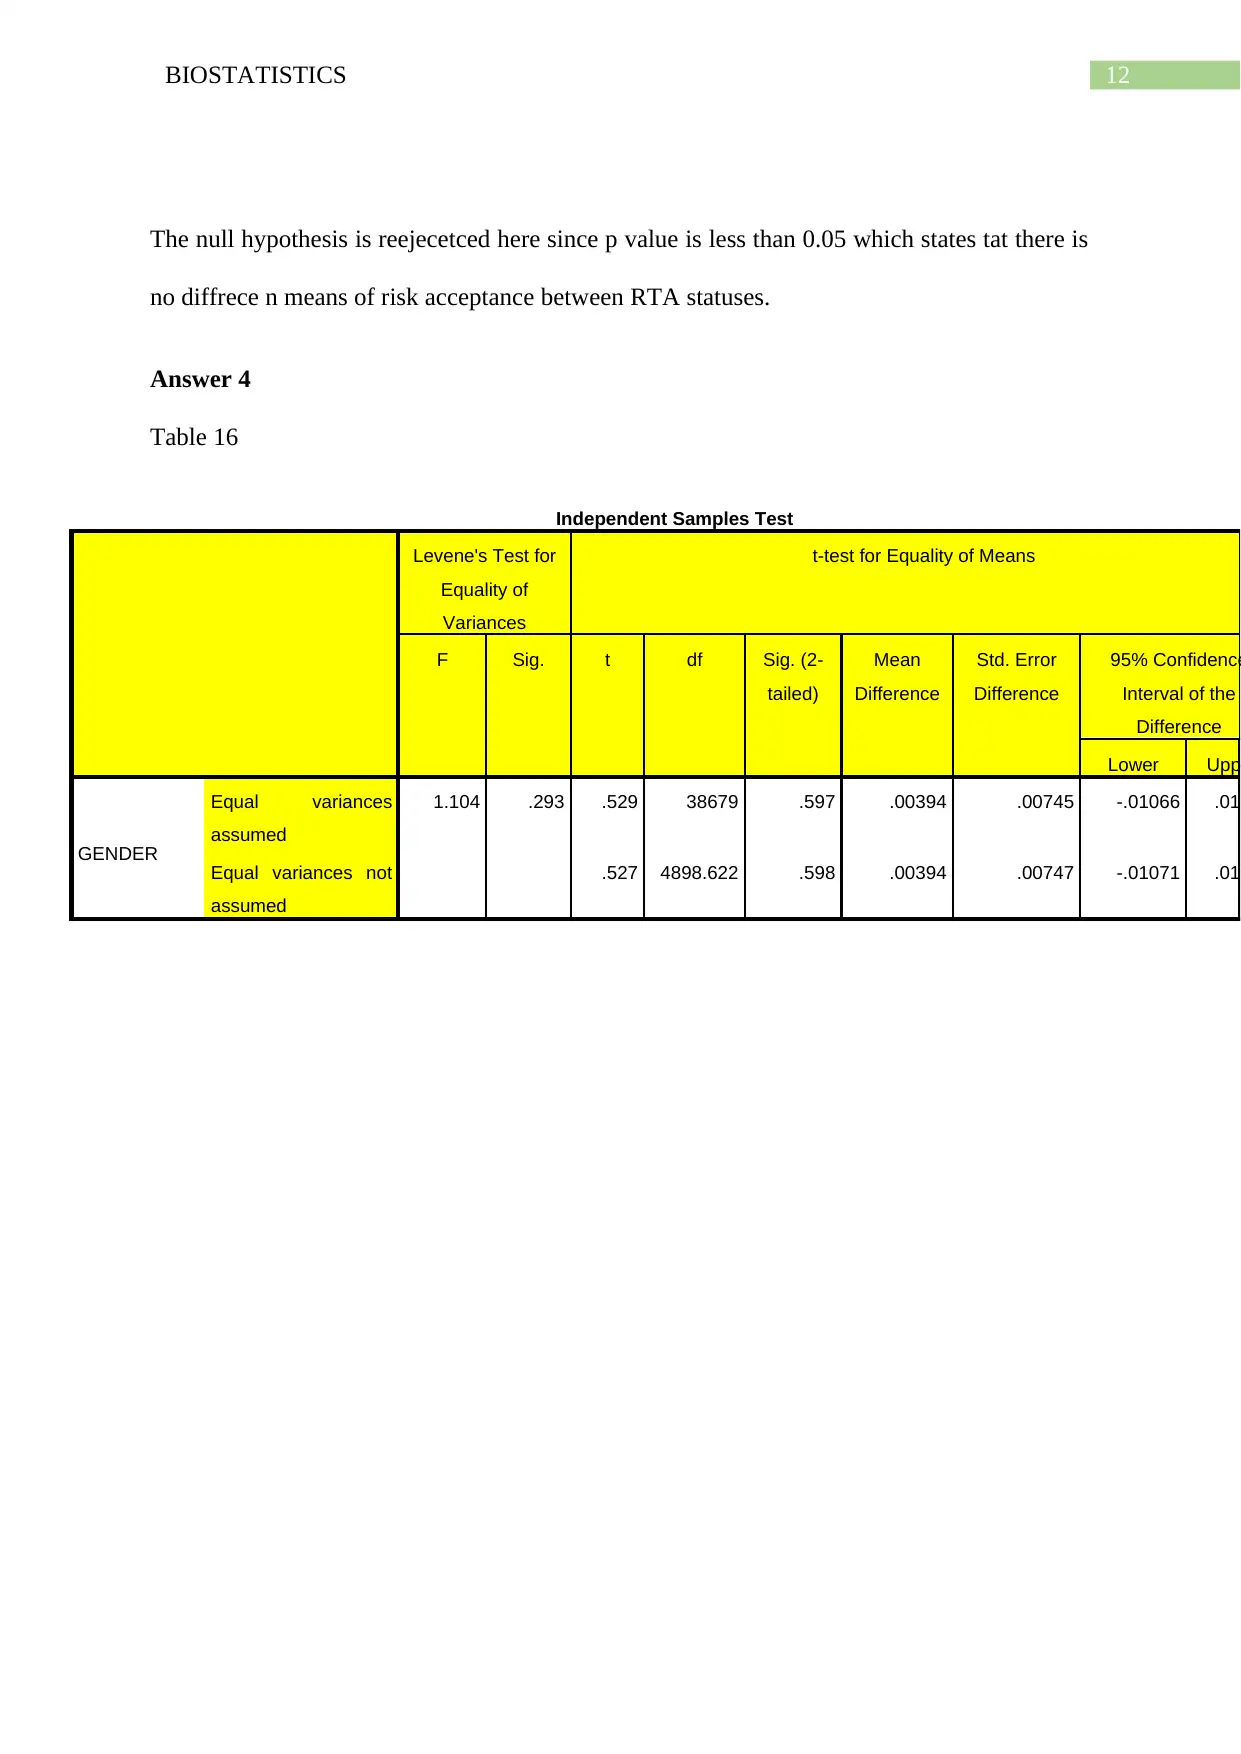
This document presents a biostatistics assignment analyzing a dataset from the Longitudinal Survey of ACU Student Health and Wellbeing. The assignment, focusing on baseline and follow-up data, explores various aspects of student health, including road traffic accidents, depression, and obesity. The analysis includes descriptive statistics of age, gender, living arrangements, faculty, degree type, study mode, fee status, and metropolitan status. It also involves t-tests to compare means of aggression, thrill-seeking, and risk acceptance across different demographic groups and study modes, in addition to regression analysis to identify factors influencing road traffic accidents and depression. The assignment provides detailed SPSS output, interpretations, and statistical conclusions to address specific research questions related to public health.
1 out of 16
Related Documents


Your All-in-One AI-Powered Toolkit for Academic Success.
+13062052269
info@desklib.com
Available 24*7 on WhatsApp / Email
![[object Object]](/_next/static/media/star-bottom.7253800d.svg)
Copyright © 2020–2026 A2Z Services. All Rights Reserved. Developed and managed by ZUCOL.