HSH 746 Biostatistics Assignment: Confidence Intervals and T-Tests
VerifiedAdded on 2023/06/12
|8
|954
|62
Homework Assignment
AI Summary
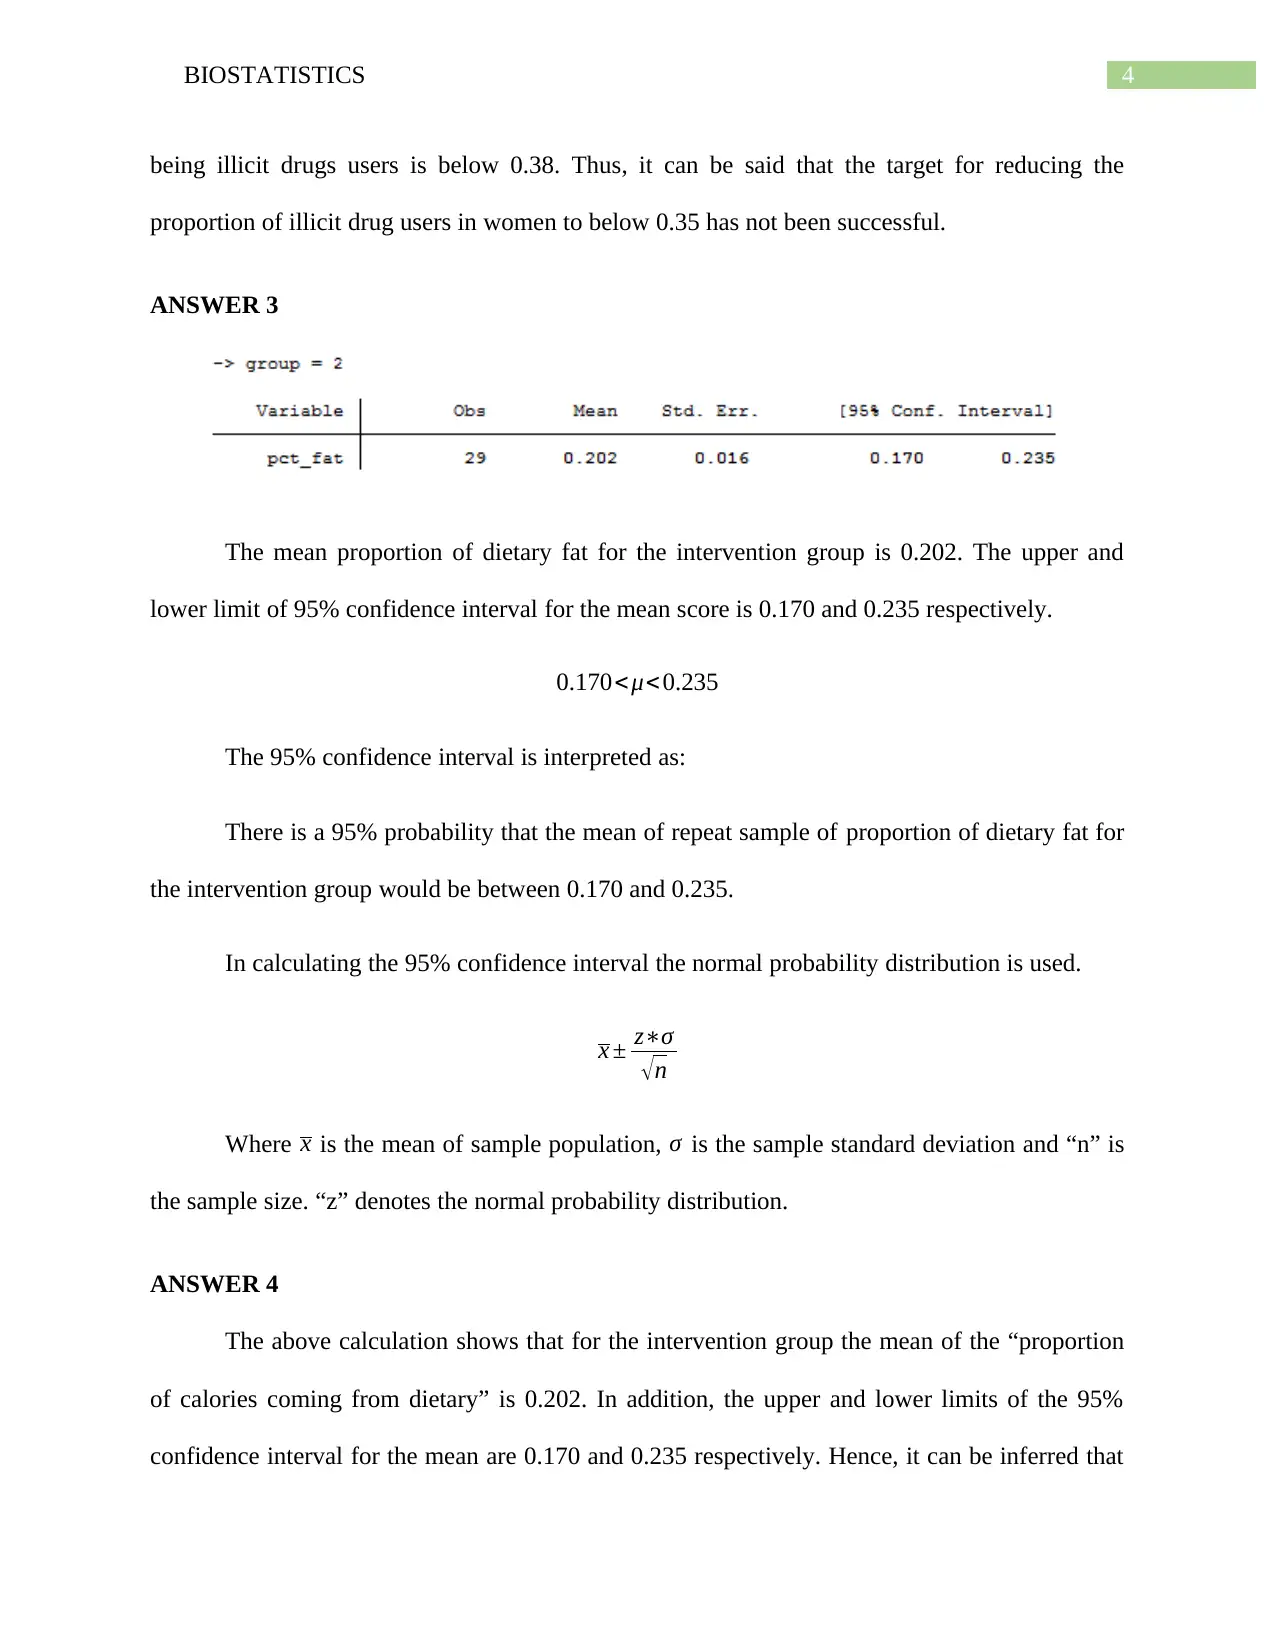
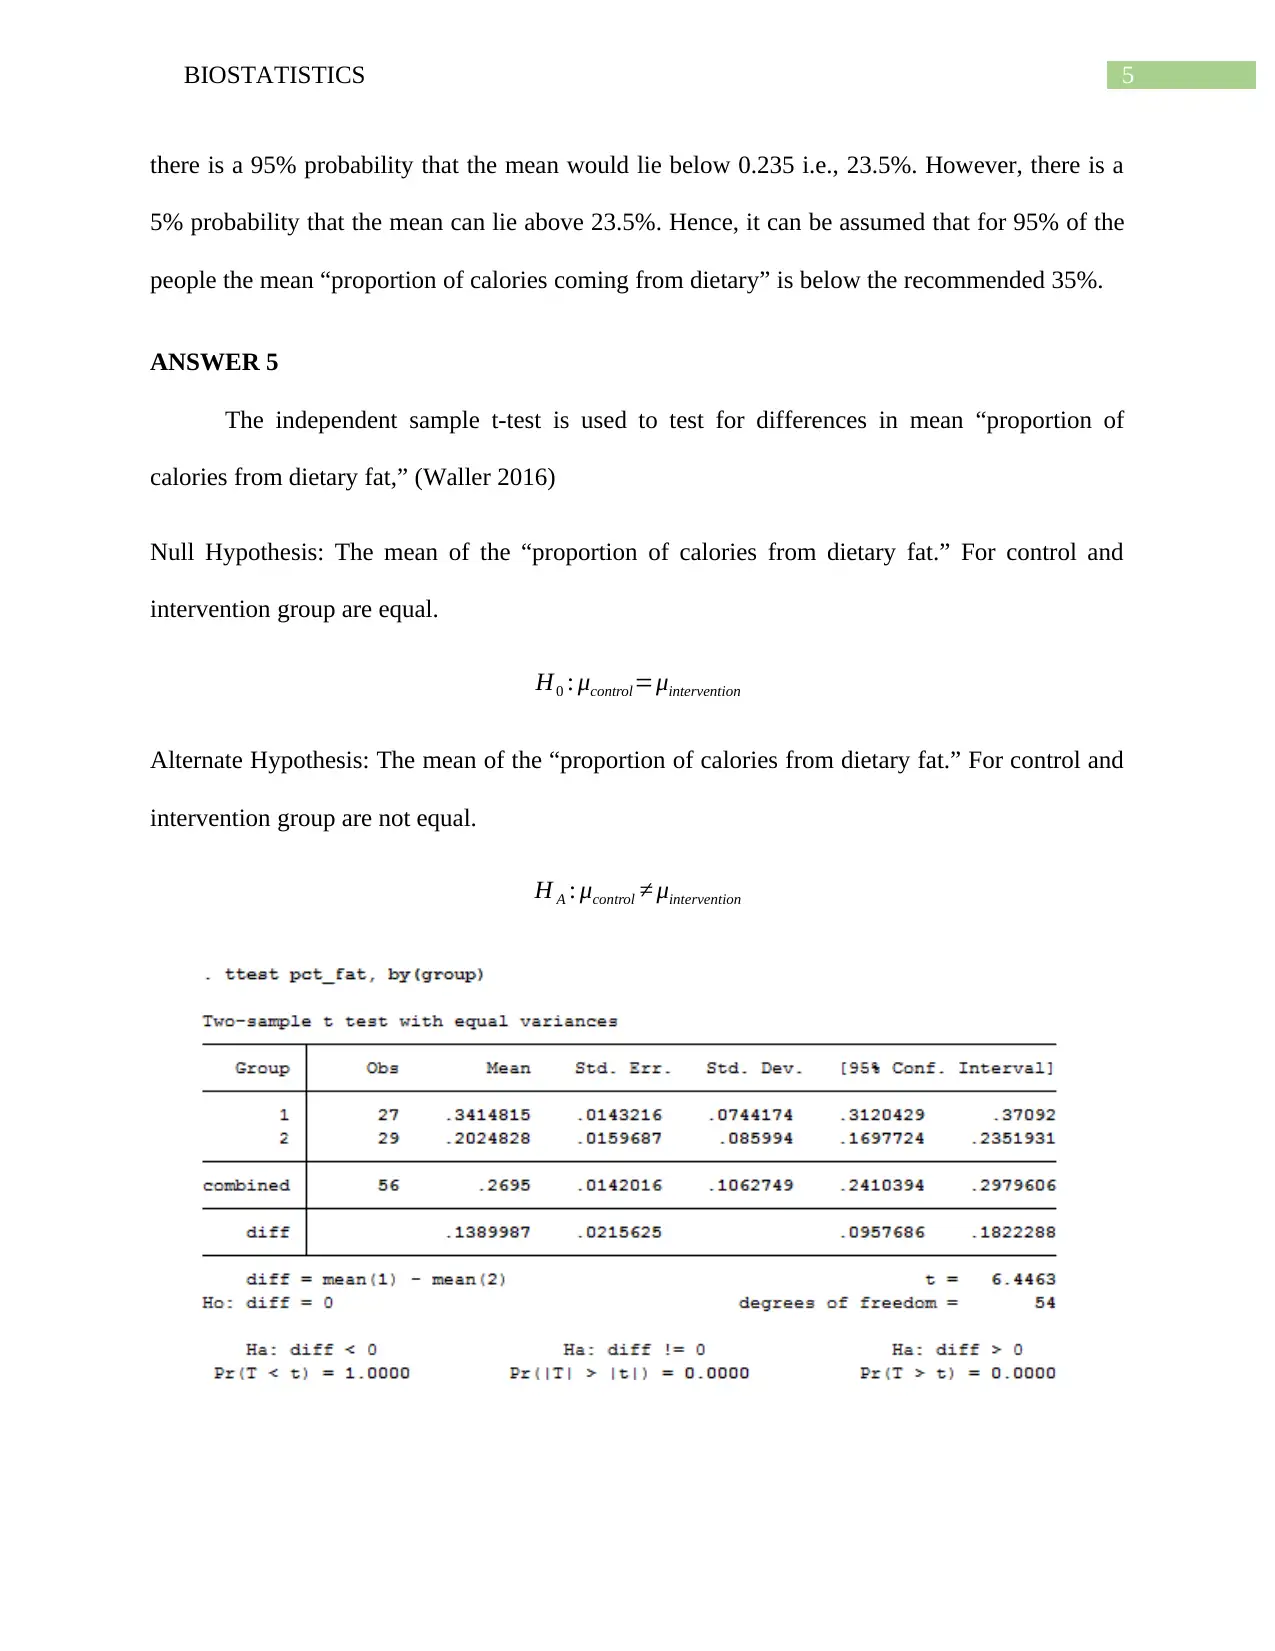
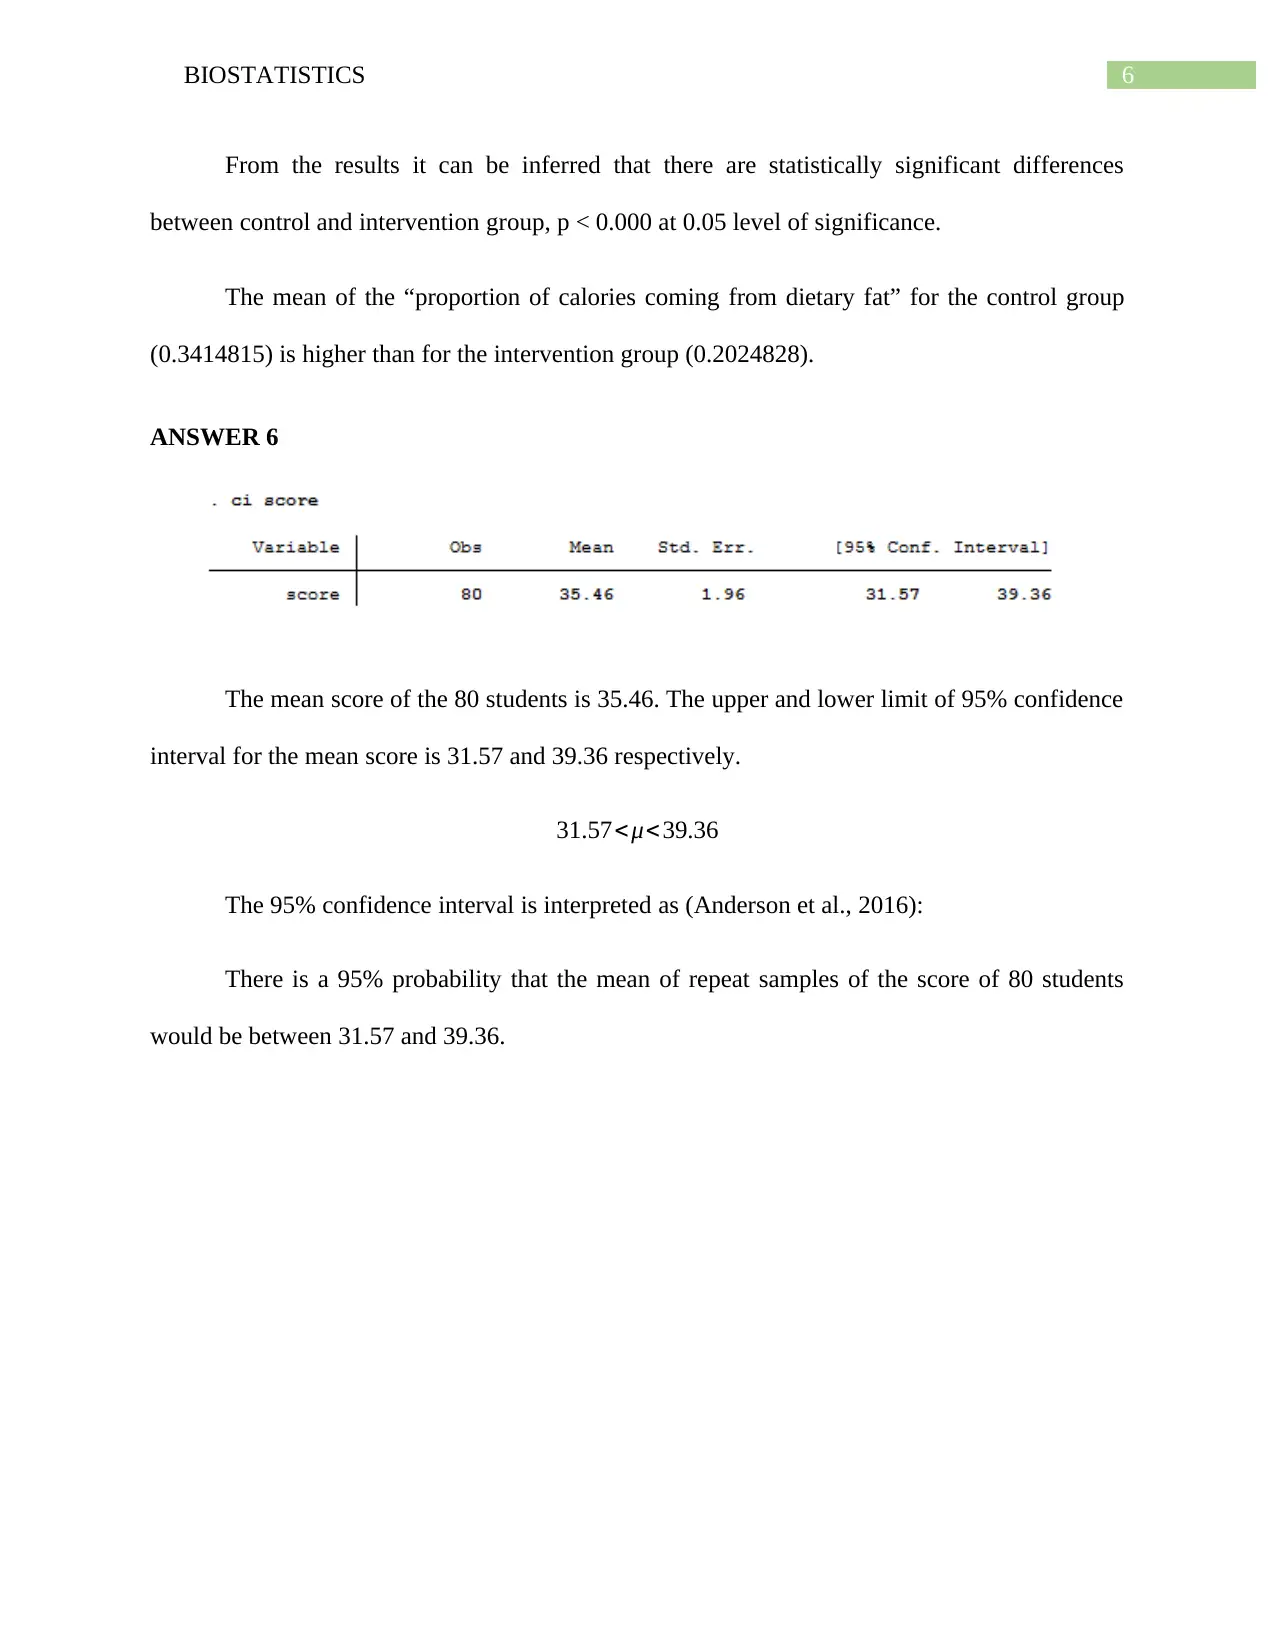
This biostatistics assignment delves into the analysis of drug use proportions and dietary fat. It calculates and interprets 95% confidence intervals for differences in illicit drug use between men and women in 2001. It further examines whether targets for reducing illicit drug use in 2016 were met, based on provided confidence intervals. The assignment also analyzes the mean proportion of dietary fat for an intervention group, interpreting the 95% confidence interval. An independent sample t-test is used to compare the mean proportion of calories from dietary fat between control and intervention groups, with a conclusion drawn based on the p-value. Finally, the assignment calculates and interprets the 95% confidence interval for the mean score of 80 students.
1 out of 8


Your All-in-One AI-Powered Toolkit for Academic Success.
+13062052269
info@desklib.com
Available 24*7 on WhatsApp / Email
![[object Object]](/_next/static/media/star-bottom.7253800d.svg)
Copyright © 2020–2026 A2Z Services. All Rights Reserved. Developed and managed by ZUCOL.