Biostatistical Analysis of CHAT Program: Impact on Student Knowledge
VerifiedAdded on 2023/03/21
|10
|2624
|26
Homework Assignment
AI Summary
This assignment presents a comprehensive biostatistical analysis of the City's Healthy Adolescents & Teens (CHAT) program, a sexual health education initiative implemented in District of Columbia Public Schools. The analysis examines data collected from 851 students, their parents, and teachers over a five-year period, focusing on the impact of the program on students' sexual health knowledge. The study uses descriptive statistics, paired sample t-tests, and Pearson's correlation coefficient to assess the program's effectiveness. Key findings include a statistically significant improvement in students' knowledge scores from 8th to 12th grade, a higher knowledge score among female students compared to male students, and the identification of significant correlations between knowledge scores and variables such as gender, race, family income, and participation in risk behavior. A multiple regression model is also employed to determine the influence of independent variables on 12th-grade knowledge scores. The assignment concludes by discussing the implications of these findings within the context of the health impact pyramid, emphasizing the need for comprehensive interventions involving government, schools, hospitals, and families to enhance sexual health education.
Running head: BIOSTATISTICS FINAL ASSESSMENT 1
CHAT Program Data Analysis
Student’s Name
Institutional Affiliation
CHAT Program Data Analysis
Student’s Name
Institutional Affiliation
Paraphrase This Document
Need a fresh take? Get an instant paraphrase of this document with our AI Paraphraser
BIOSTATISTICS FINAL ASSESSMENT 2
CHAT Program Data Analysis
Question 1
This is a study that involves a sample of 851 students. It involves the analysis of the
sexual health education program (CHAT) which was adopted by public schools in Columbia. The target
group was students, parents and their respective students. The survey was conducted through interviews
and sexual knowledge score.
Part 1
Health
Knowledge
Score (8th
Grade) Gender Race
Total
Family
Annual
Income
Reported
Negative
Body
Image
Sexually
Active
Participated
in Risk
Behavior
Health
Knowledge
Score
(12th
Grade)
Accessed
Sexual
Health
Resource
s
Graduated
High
School
N 851 851 851 851 851 851 851 851 851 851
Mean 51.582 0.864
3.58
6 9.522 0.904 0.526 0.821 52.297 0.731 0.919
Median 52.770 1.000
4.00
0 10.000 1.000 1.000 1.000 52.130 1.000 1.000
Mode 68.090 1.000
4.00
0 11.000 1.000 1.000 1.000 70.550 1.000 1.000
Std.
Deviation 9.448 0.343
0.90
1 2.187 0.412 0.500 0.383 9.743 0.444 0.273
Variance 89.260 0.118
0.81
2 4.784 0.170 0.250 0.147 94.918 0.197 0.075
Skewness -0.333 -2.124
-
1.59
3 -1.319 -0.669 -0.106 -1.681 0.081 -1.043 -3.075
Kurtosis -0.904 2.516
1.62
6 1.625 2.293 -1.993 0.828 -0.972 -0.914 7.472
Range 38.440 1.000
4.00
0 11.000 2.000 1.000 1.000 38.200 1.000 1.000
Minimum 29.650 0.000
1.00
0 1.000 0.000 0.000 0.000 32.350 0.000 0.000
Maximum 68.090 1.000
5.00
0 12.000 2.000 1.000 1.000 70.550 1.000 1.000
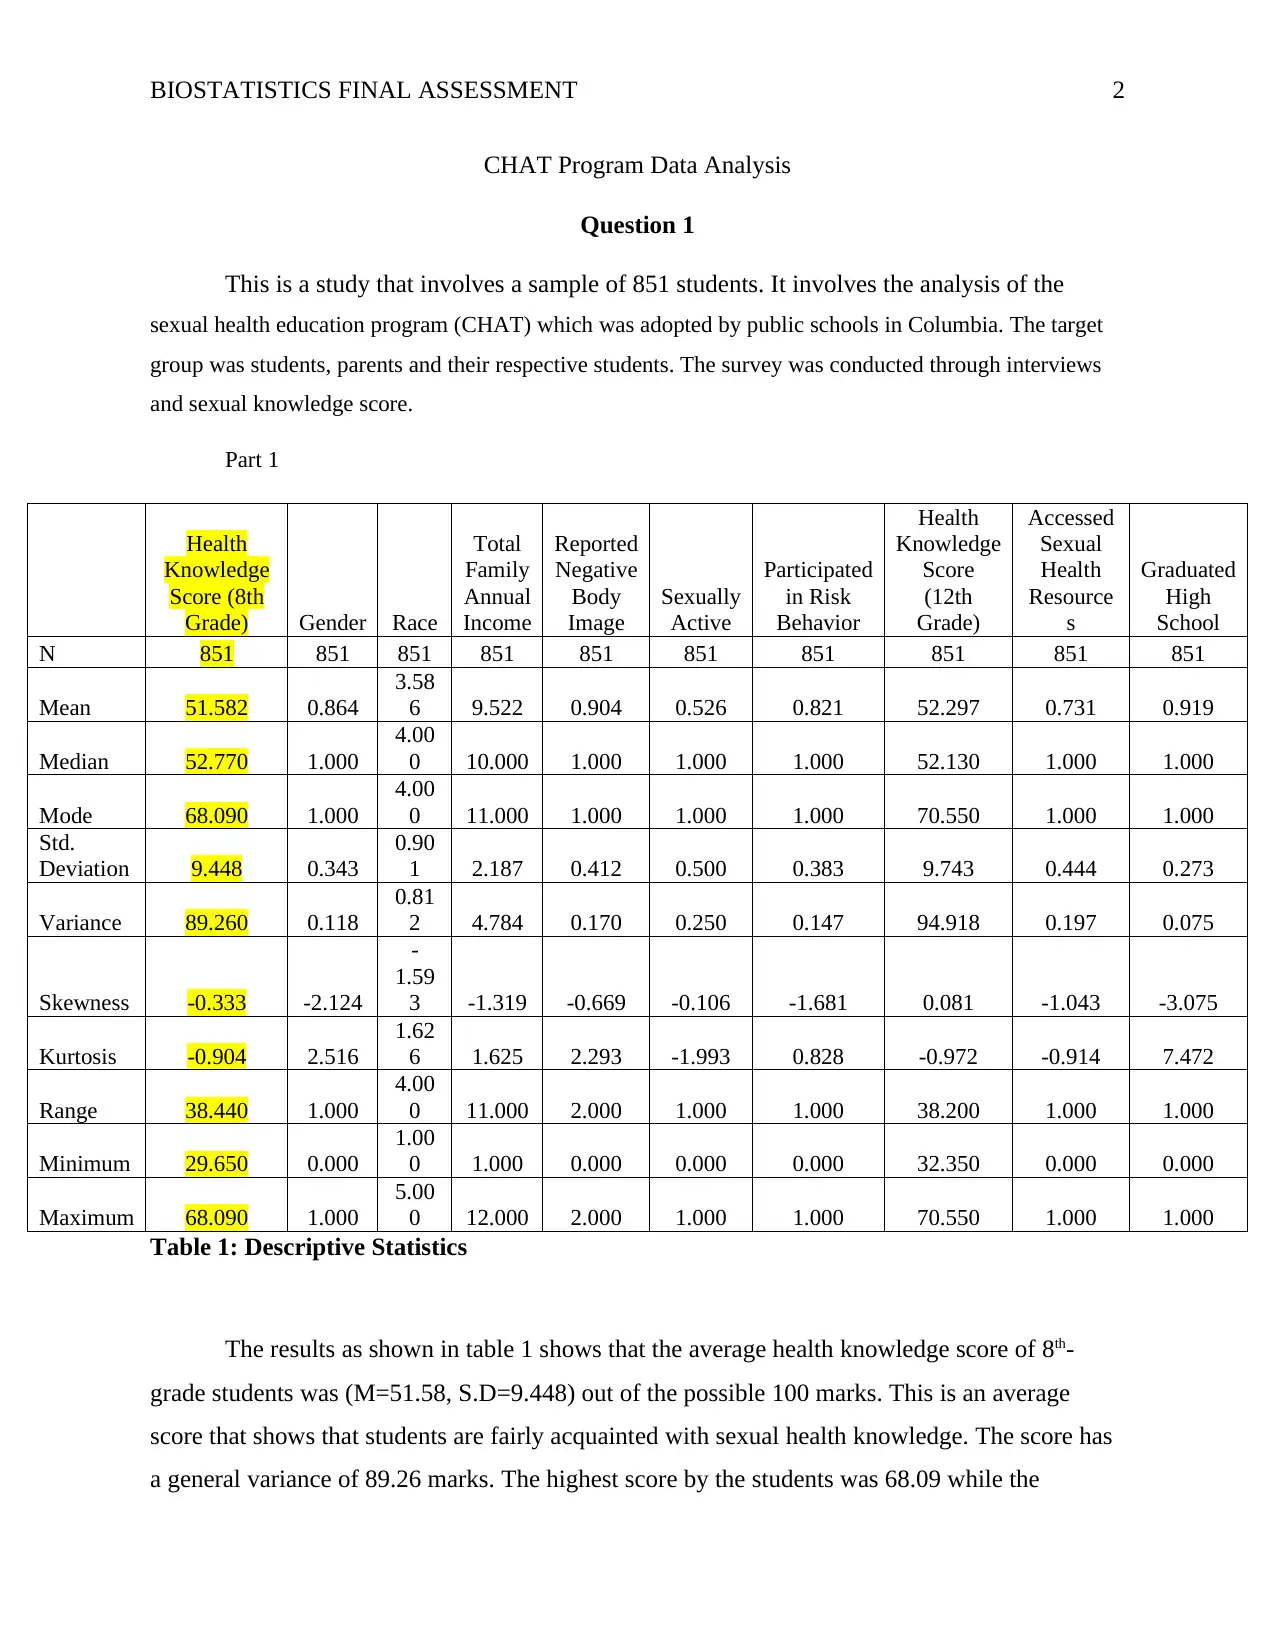
Table 1: Descriptive Statistics
The results as shown in table 1 shows that the average health knowledge score of 8th-
grade students was (M=51.58, S.D=9.448) out of the possible 100 marks. This is an average
score that shows that students are fairly acquainted with sexual health knowledge. The score has
a general variance of 89.26 marks. The highest score by the students was 68.09 while the
CHAT Program Data Analysis
Question 1
This is a study that involves a sample of 851 students. It involves the analysis of the
sexual health education program (CHAT) which was adopted by public schools in Columbia. The target
group was students, parents and their respective students. The survey was conducted through interviews
and sexual knowledge score.
Part 1
Health
Knowledge
Score (8th
Grade) Gender Race
Total
Family
Annual
Income
Reported
Negative
Body
Image
Sexually
Active
Participated
in Risk
Behavior
Health
Knowledge
Score
(12th
Grade)
Accessed
Sexual
Health
Resource
s
Graduated
High
School
N 851 851 851 851 851 851 851 851 851 851
Mean 51.582 0.864
3.58
6 9.522 0.904 0.526 0.821 52.297 0.731 0.919
Median 52.770 1.000
4.00
0 10.000 1.000 1.000 1.000 52.130 1.000 1.000
Mode 68.090 1.000
4.00
0 11.000 1.000 1.000 1.000 70.550 1.000 1.000
Std.
Deviation 9.448 0.343
0.90
1 2.187 0.412 0.500 0.383 9.743 0.444 0.273
Variance 89.260 0.118
0.81
2 4.784 0.170 0.250 0.147 94.918 0.197 0.075
Skewness -0.333 -2.124
-
1.59
3 -1.319 -0.669 -0.106 -1.681 0.081 -1.043 -3.075
Kurtosis -0.904 2.516
1.62
6 1.625 2.293 -1.993 0.828 -0.972 -0.914 7.472
Range 38.440 1.000
4.00
0 11.000 2.000 1.000 1.000 38.200 1.000 1.000
Minimum 29.650 0.000
1.00
0 1.000 0.000 0.000 0.000 32.350 0.000 0.000
Maximum 68.090 1.000
5.00
0 12.000 2.000 1.000 1.000 70.550 1.000 1.000
Table 1: Descriptive Statistics
The results as shown in table 1 shows that the average health knowledge score of 8th-
grade students was (M=51.58, S.D=9.448) out of the possible 100 marks. This is an average
score that shows that students are fairly acquainted with sexual health knowledge. The score has
a general variance of 89.26 marks. The highest score by the students was 68.09 while the
BIOSTATISTICS FINAL ASSESSMENT 3
minimum was 29.65 marks. This shows a big difference (range) of 38.44 between the highest
and lowest student. The most common score was 68.09 hence some students are well above
average in the subject. The Skewness and kurtosis values are -.333 and -.904 respectively. These
statistics show the peakedness and Skewness of the distribution. A negative value shows that
many students score lie more on the left side (lower side).
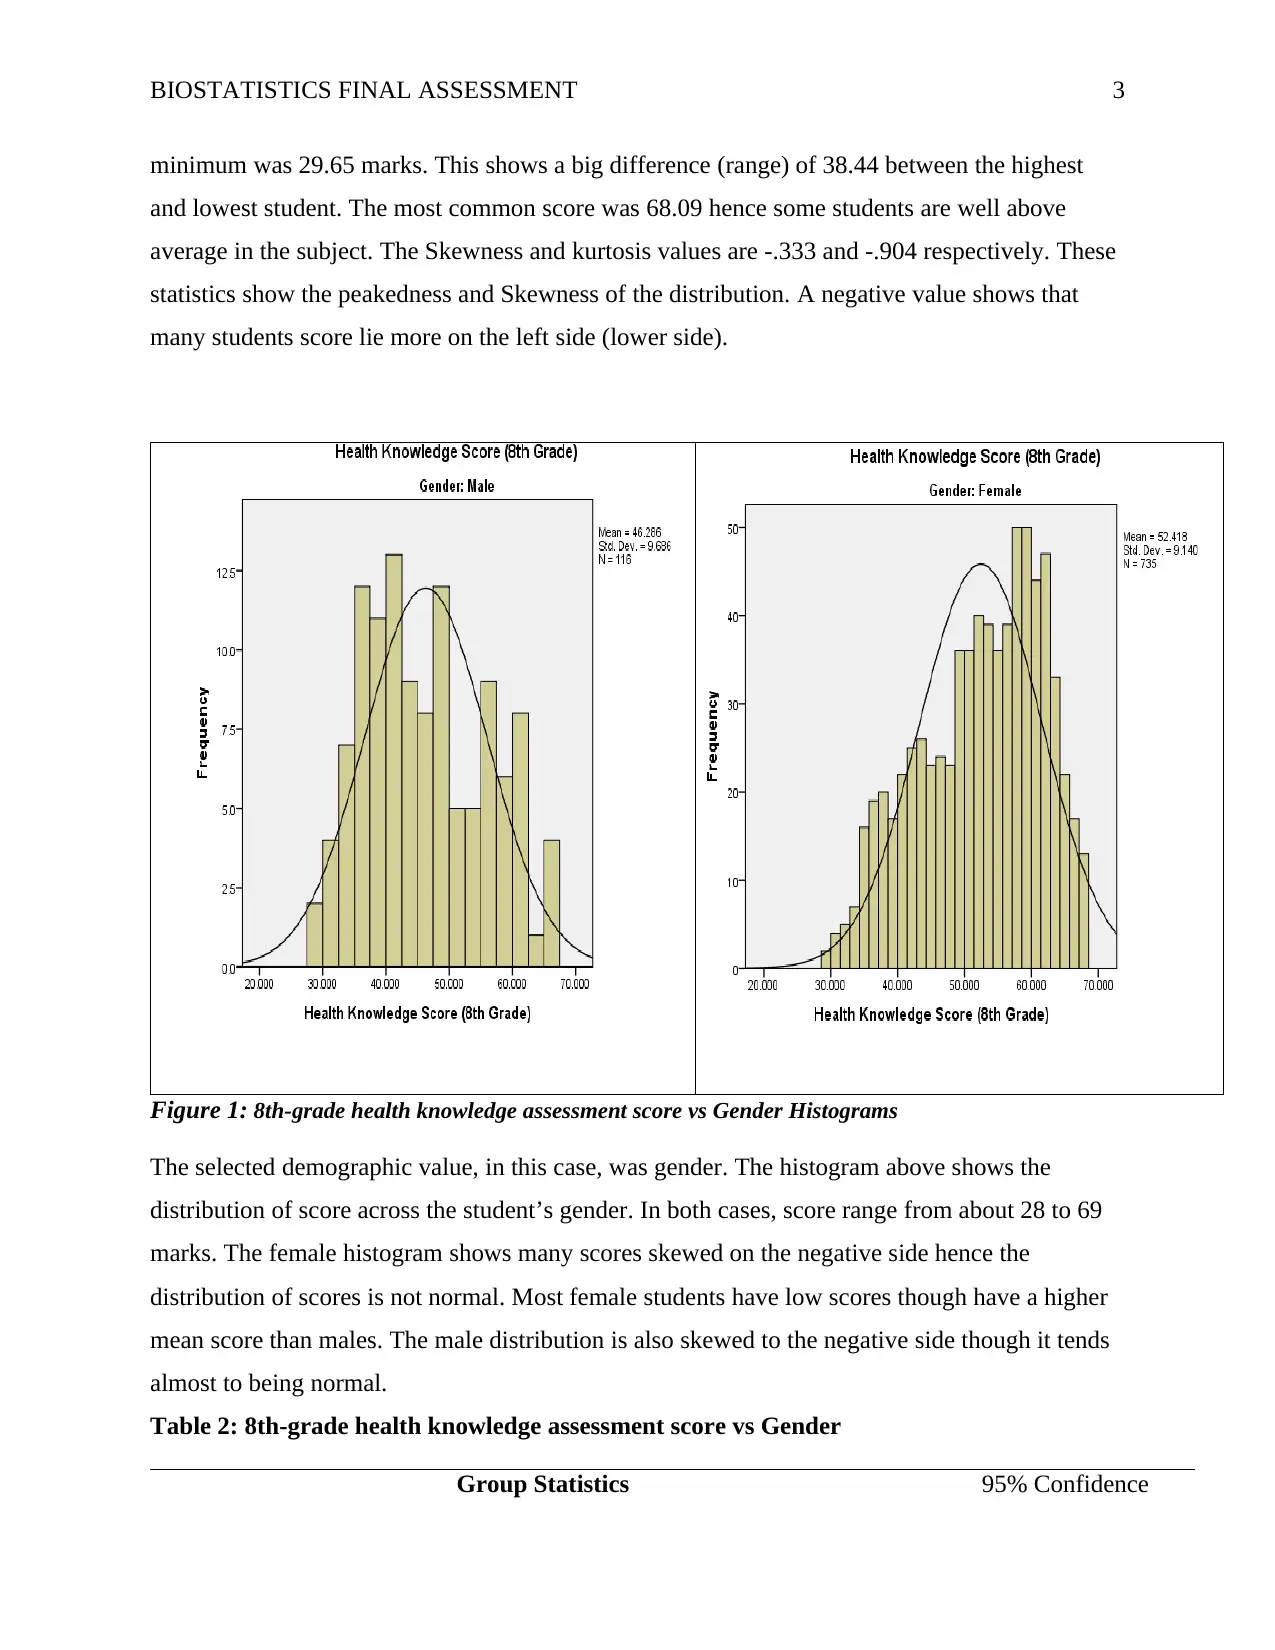
Figure 1: 8th-grade health knowledge assessment score vs Gender Histograms
The selected demographic value, in this case, was gender. The histogram above shows the
distribution of score across the student’s gender. In both cases, score range from about 28 to 69
marks. The female histogram shows many scores skewed on the negative side hence the
distribution of scores is not normal. Most female students have low scores though have a higher
mean score than males. The male distribution is also skewed to the negative side though it tends
almost to being normal.
Table 2: 8th-grade health knowledge assessment score vs Gender
Group Statistics 95% Confidence
minimum was 29.65 marks. This shows a big difference (range) of 38.44 between the highest
and lowest student. The most common score was 68.09 hence some students are well above
average in the subject. The Skewness and kurtosis values are -.333 and -.904 respectively. These
statistics show the peakedness and Skewness of the distribution. A negative value shows that
many students score lie more on the left side (lower side).
Figure 1: 8th-grade health knowledge assessment score vs Gender Histograms
The selected demographic value, in this case, was gender. The histogram above shows the
distribution of score across the student’s gender. In both cases, score range from about 28 to 69
marks. The female histogram shows many scores skewed on the negative side hence the
distribution of scores is not normal. Most female students have low scores though have a higher
mean score than males. The male distribution is also skewed to the negative side though it tends
almost to being normal.
Table 2: 8th-grade health knowledge assessment score vs Gender
Group Statistics 95% Confidence
⊘ This is a preview!⊘
Do you want full access?
Subscribe today to unlock all pages.
Trusted by 1+ million students worldwide
BIOSTATISTICS FINAL ASSESSMENT 4
Interval
Gender N Mean
Std.
Deviation
Std.
Error
Mean Lower Upper
Health
Knowledge
Score (8th
Grade)
Male 116 46.286 9.686 0.899 44.504 48.067
Female 735 52.418 9.140 0.337 51.757 53.080
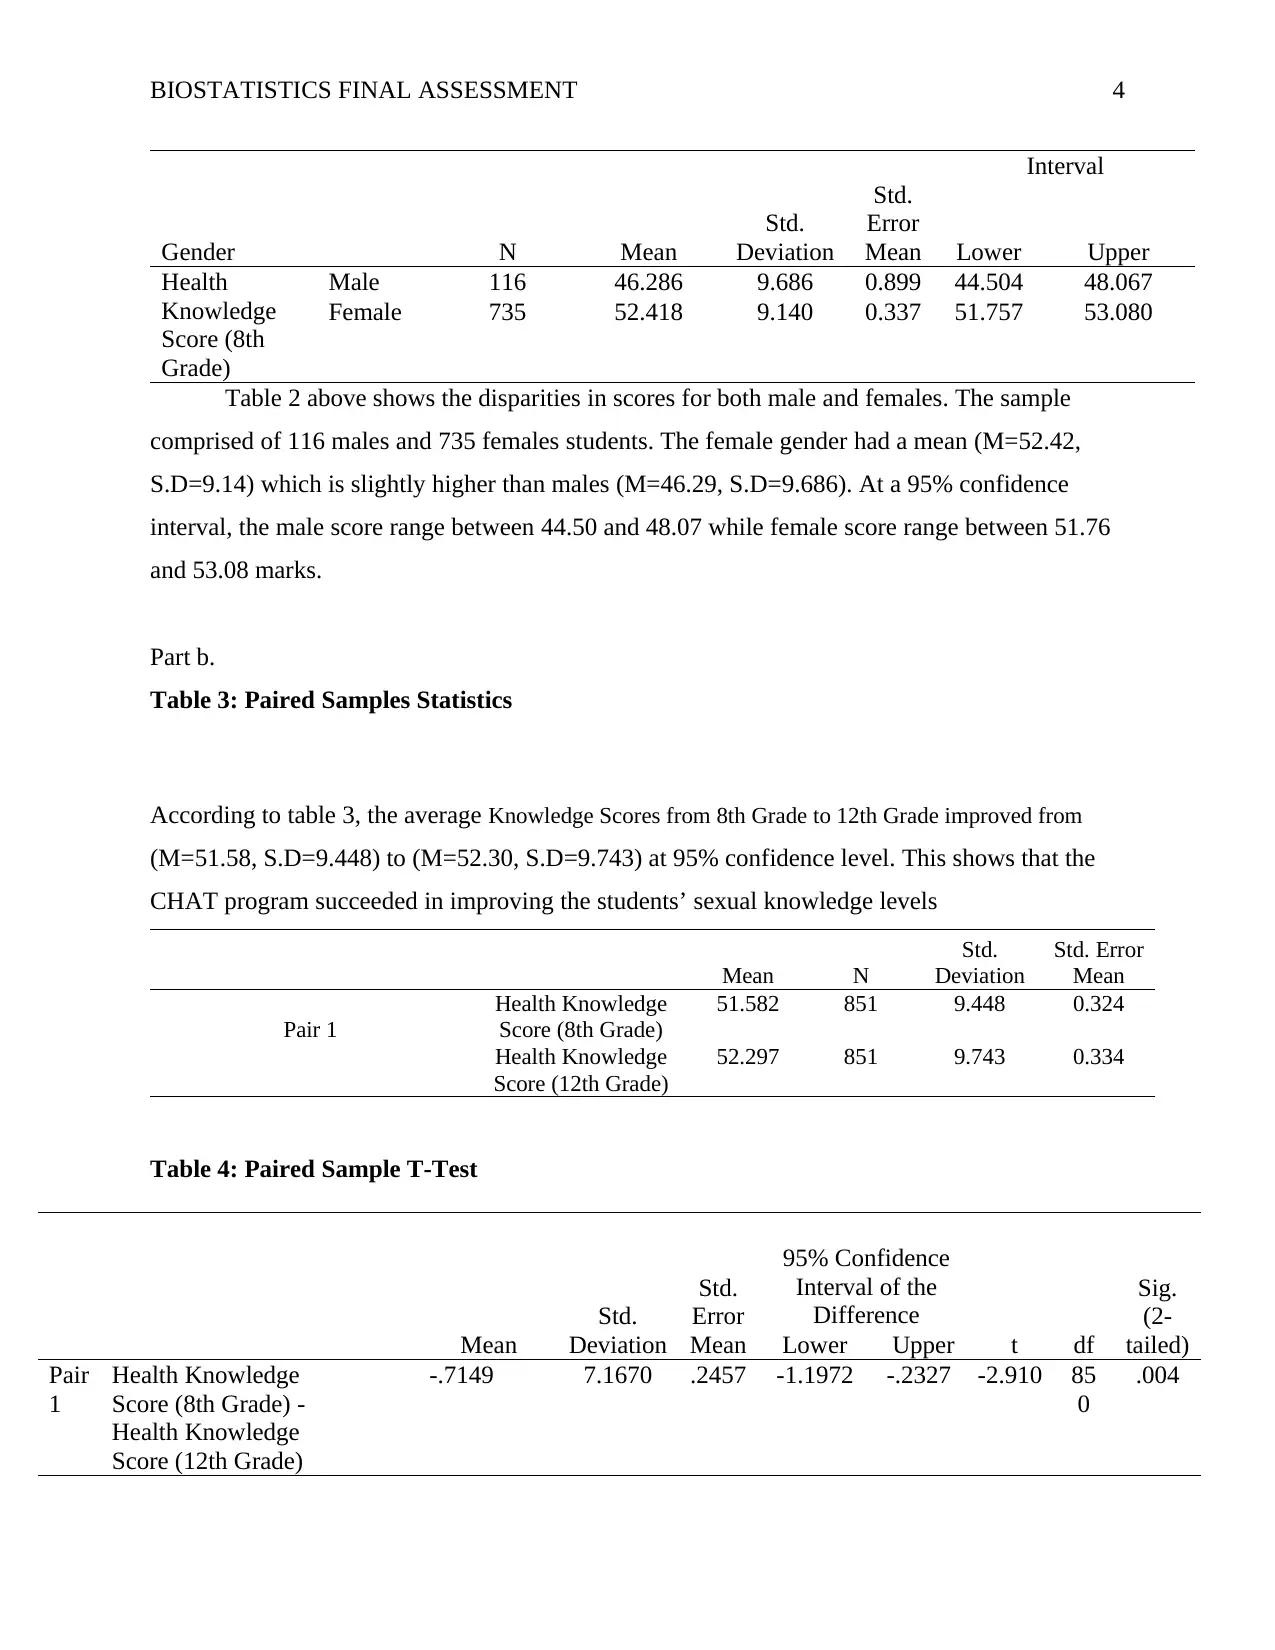
Table 2 above shows the disparities in scores for both male and females. The sample
comprised of 116 males and 735 females students. The female gender had a mean (M=52.42,
S.D=9.14) which is slightly higher than males (M=46.29, S.D=9.686). At a 95% confidence
interval, the male score range between 44.50 and 48.07 while female score range between 51.76
and 53.08 marks.
Part b.
Table 3: Paired Samples Statistics
According to table 3, the average Knowledge Scores from 8th Grade to 12th Grade improved from
(M=51.58, S.D=9.448) to (M=52.30, S.D=9.743) at 95% confidence level. This shows that the
CHAT program succeeded in improving the students’ sexual knowledge levels
Mean N
Std.
Deviation
Std. Error
Mean
Pair 1
Health Knowledge
Score (8th Grade)
51.582 851 9.448 0.324
Health Knowledge
Score (12th Grade)
52.297 851 9.743 0.334
Table 4: Paired Sample T-Test
t df
Sig.
(2-
tailed)Mean
Std.
Deviation
Std.
Error
Mean
95% Confidence
Interval of the
Difference
Lower Upper
Pair
1
Health Knowledge
Score (8th Grade) -
Health Knowledge
Score (12th Grade)
-.7149 7.1670 .2457 -1.1972 -.2327 -2.910 85
0
.004
Interval
Gender N Mean
Std.
Deviation
Std.
Error
Mean Lower Upper
Health
Knowledge
Score (8th
Grade)
Male 116 46.286 9.686 0.899 44.504 48.067
Female 735 52.418 9.140 0.337 51.757 53.080
Table 2 above shows the disparities in scores for both male and females. The sample
comprised of 116 males and 735 females students. The female gender had a mean (M=52.42,
S.D=9.14) which is slightly higher than males (M=46.29, S.D=9.686). At a 95% confidence
interval, the male score range between 44.50 and 48.07 while female score range between 51.76
and 53.08 marks.
Part b.
Table 3: Paired Samples Statistics
According to table 3, the average Knowledge Scores from 8th Grade to 12th Grade improved from
(M=51.58, S.D=9.448) to (M=52.30, S.D=9.743) at 95% confidence level. This shows that the
CHAT program succeeded in improving the students’ sexual knowledge levels
Mean N
Std.
Deviation
Std. Error
Mean
Pair 1
Health Knowledge
Score (8th Grade)
51.582 851 9.448 0.324
Health Knowledge
Score (12th Grade)
52.297 851 9.743 0.334
Table 4: Paired Sample T-Test
t df
Sig.
(2-
tailed)Mean
Std.
Deviation
Std.
Error
Mean
95% Confidence
Interval of the
Difference
Lower Upper
Pair
1
Health Knowledge
Score (8th Grade) -
Health Knowledge
Score (12th Grade)
-.7149 7.1670 .2457 -1.1972 -.2327 -2.910 85
0
.004
Paraphrase This Document
Need a fresh take? Get an instant paraphrase of this document with our AI Paraphraser
BIOSTATISTICS FINAL ASSESSMENT 5
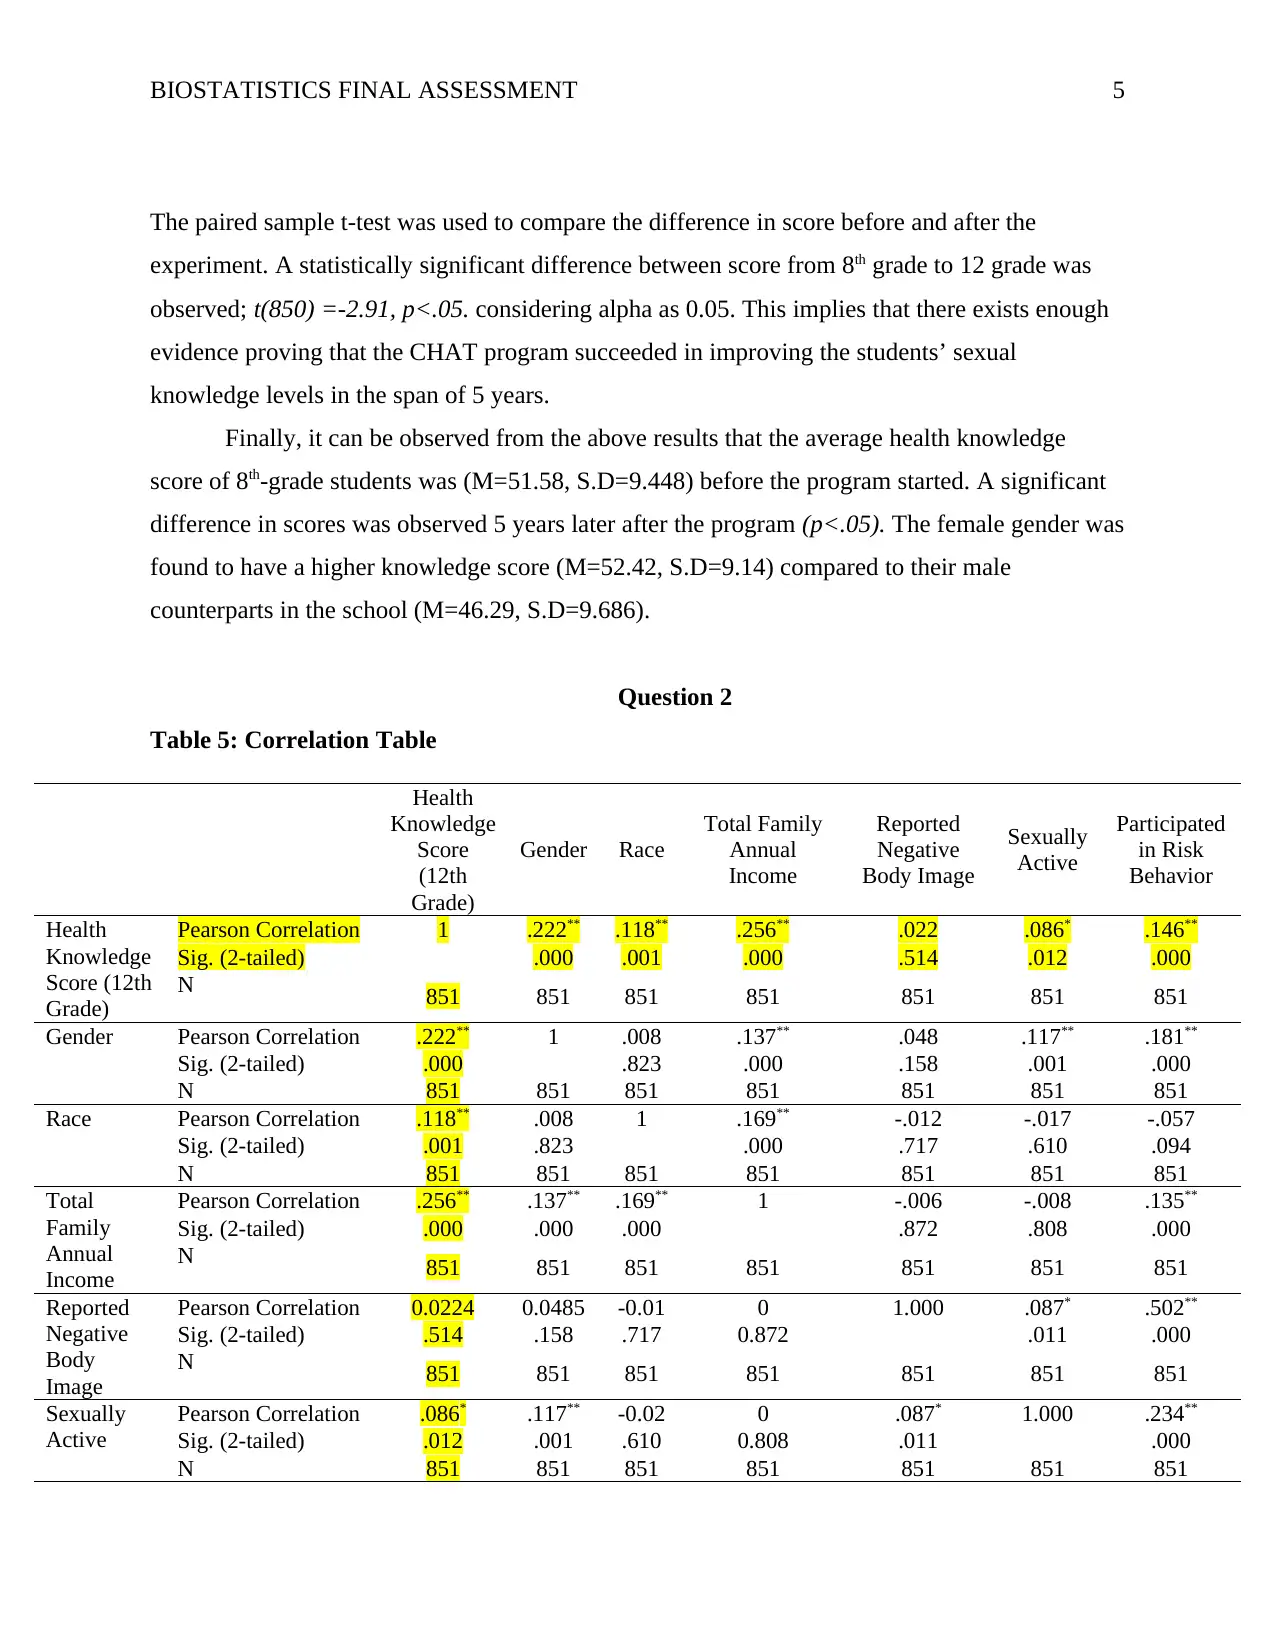
The paired sample t-test was used to compare the difference in score before and after the
experiment. A statistically significant difference between score from 8th grade to 12 grade was
observed; t(850) =-2.91, p<.05. considering alpha as 0.05. This implies that there exists enough
evidence proving that the CHAT program succeeded in improving the students’ sexual
knowledge levels in the span of 5 years.
Finally, it can be observed from the above results that the average health knowledge
score of 8th-grade students was (M=51.58, S.D=9.448) before the program started. A significant
difference in scores was observed 5 years later after the program (p<.05). The female gender was
found to have a higher knowledge score (M=52.42, S.D=9.14) compared to their male
counterparts in the school (M=46.29, S.D=9.686).
Question 2
Table 5: Correlation Table
Health
Knowledge
Score
(12th
Grade)
Gender Race
Total Family
Annual
Income
Reported
Negative
Body Image
Sexually
Active
Participated
in Risk
Behavior
Health
Knowledge
Score (12th
Grade)
Pearson Correlation 1 .222** .118** .256** .022 .086* .146**
Sig. (2-tailed) .000 .001 .000 .514 .012 .000
N 851 851 851 851 851 851 851
Gender Pearson Correlation .222** 1 .008 .137** .048 .117** .181**
Sig. (2-tailed) .000 .823 .000 .158 .001 .000
N 851 851 851 851 851 851 851
Race Pearson Correlation .118** .008 1 .169** -.012 -.017 -.057
Sig. (2-tailed) .001 .823 .000 .717 .610 .094
N 851 851 851 851 851 851 851
Total
Family
Annual
Income
Pearson Correlation .256** .137** .169** 1 -.006 -.008 .135**
Sig. (2-tailed) .000 .000 .000 .872 .808 .000
N 851 851 851 851 851 851 851
Reported
Negative
Body
Image
Pearson Correlation 0.0224 0.0485 -0.01 0 1.000 .087* .502**
Sig. (2-tailed) .514 .158 .717 0.872 .011 .000
N 851 851 851 851 851 851 851
Sexually
Active
Pearson Correlation .086* .117** -0.02 0 .087* 1.000 .234**
Sig. (2-tailed) .012 .001 .610 0.808 .011 .000
N 851 851 851 851 851 851 851
BIOSTATISTICS FINAL ASSESSMENT 6
Participate
d in Risk
Behavior
Pearson Correlation .146** .181** -0.06 .135** .502** .234** 1
Sig. (2-tailed) .000 .000 .094 7.6458E-05 .000 .000
N 851 851 851 851 851 851 851
**. Correlation is significant at the 0.01 level (2-tailed).
*. Correlation is significant at the 0.05 level (2-tailed).
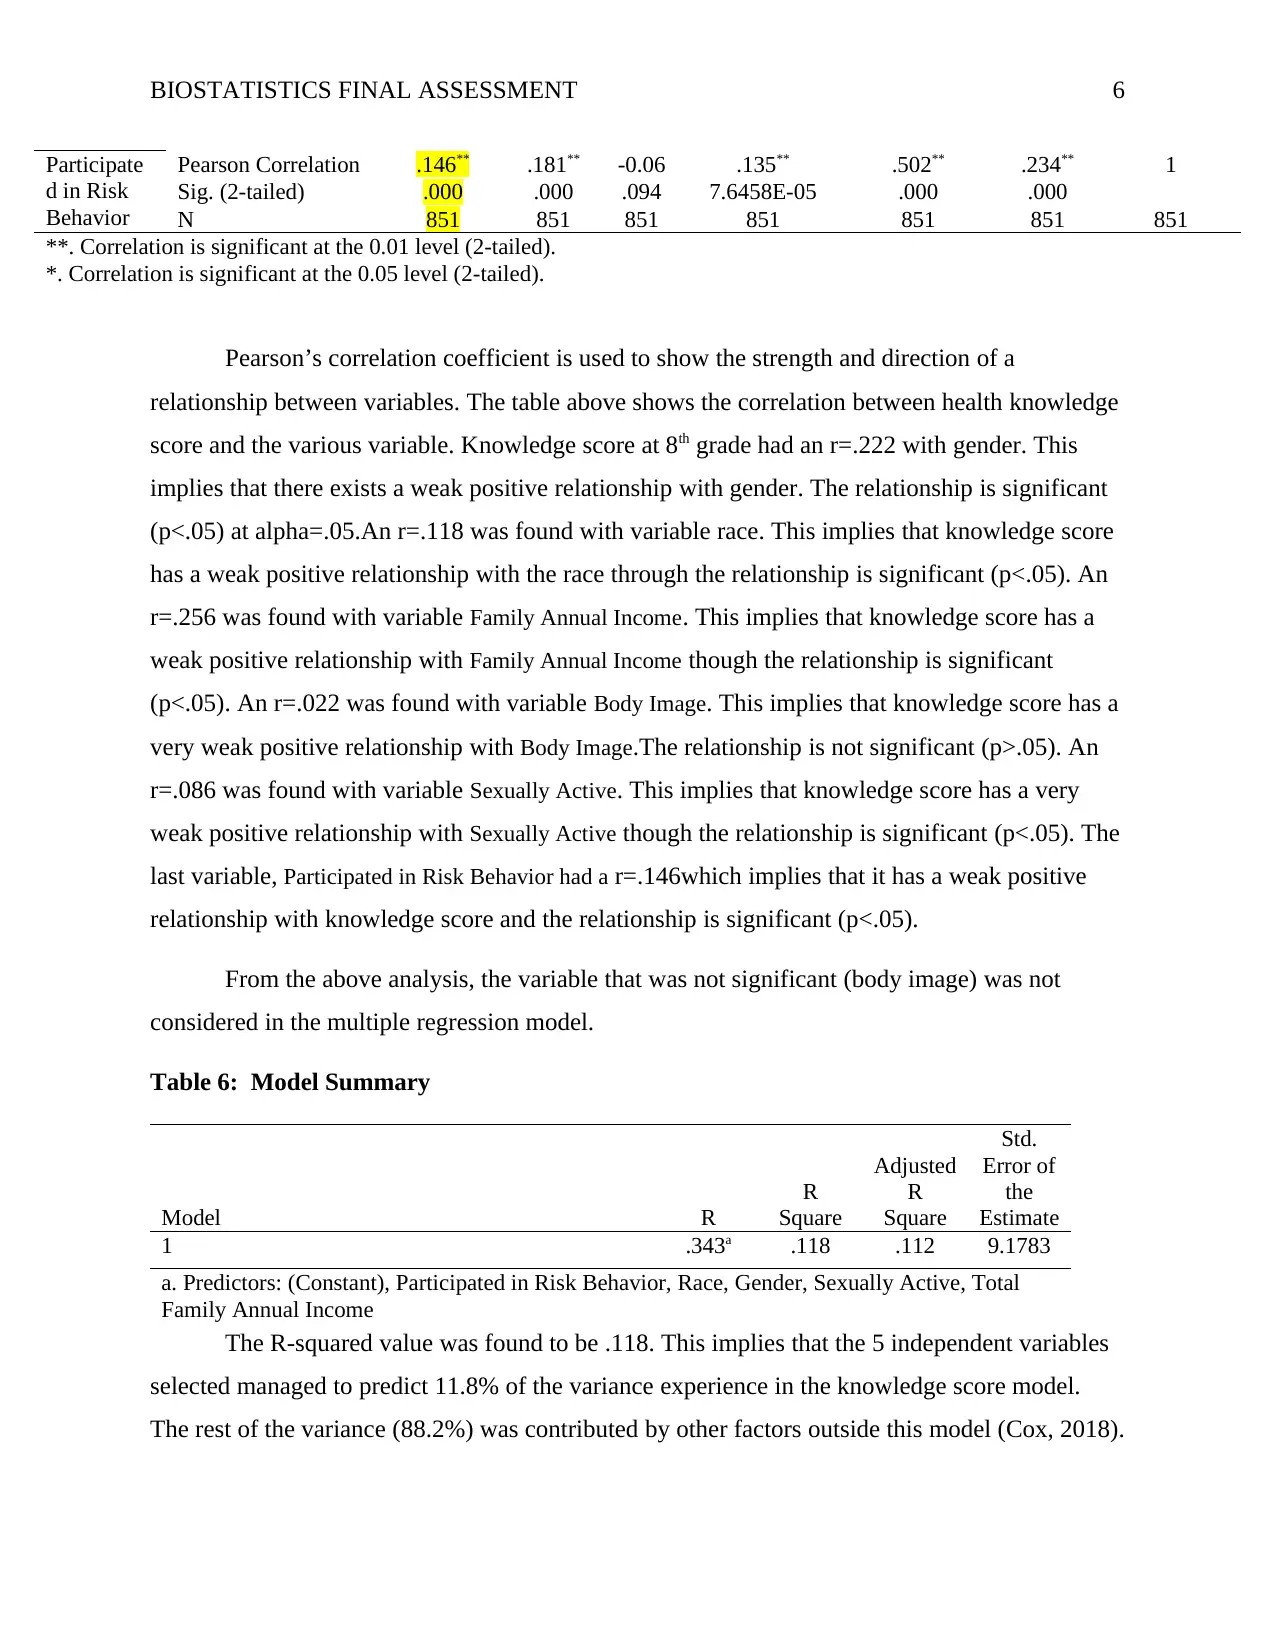
Pearson’s correlation coefficient is used to show the strength and direction of a
relationship between variables. The table above shows the correlation between health knowledge
score and the various variable. Knowledge score at 8th grade had an r=.222 with gender. This
implies that there exists a weak positive relationship with gender. The relationship is significant
(p<.05) at alpha=.05.An r=.118 was found with variable race. This implies that knowledge score
has a weak positive relationship with the race through the relationship is significant (p<.05). An
r=.256 was found with variable Family Annual Income. This implies that knowledge score has a
weak positive relationship with Family Annual Income though the relationship is significant
(p<.05). An r=.022 was found with variable Body Image. This implies that knowledge score has a
very weak positive relationship with Body Image.The relationship is not significant (p>.05). An
r=.086 was found with variable Sexually Active. This implies that knowledge score has a very
weak positive relationship with Sexually Active though the relationship is significant (p<.05). The
last variable, Participated in Risk Behavior had a r=.146which implies that it has a weak positive
relationship with knowledge score and the relationship is significant (p<.05).
From the above analysis, the variable that was not significant (body image) was not
considered in the multiple regression model.
Table 6: Model Summary
Model R
R
Square
Adjusted
R
Square
Std.
Error of
the
Estimate
1 .343a .118 .112 9.1783
a. Predictors: (Constant), Participated in Risk Behavior, Race, Gender, Sexually Active, Total
Family Annual Income
The R-squared value was found to be .118. This implies that the 5 independent variables
selected managed to predict 11.8% of the variance experience in the knowledge score model.
The rest of the variance (88.2%) was contributed by other factors outside this model (Cox, 2018).
Participate
d in Risk
Behavior
Pearson Correlation .146** .181** -0.06 .135** .502** .234** 1
Sig. (2-tailed) .000 .000 .094 7.6458E-05 .000 .000
N 851 851 851 851 851 851 851
**. Correlation is significant at the 0.01 level (2-tailed).
*. Correlation is significant at the 0.05 level (2-tailed).
Pearson’s correlation coefficient is used to show the strength and direction of a
relationship between variables. The table above shows the correlation between health knowledge
score and the various variable. Knowledge score at 8th grade had an r=.222 with gender. This
implies that there exists a weak positive relationship with gender. The relationship is significant
(p<.05) at alpha=.05.An r=.118 was found with variable race. This implies that knowledge score
has a weak positive relationship with the race through the relationship is significant (p<.05). An
r=.256 was found with variable Family Annual Income. This implies that knowledge score has a
weak positive relationship with Family Annual Income though the relationship is significant
(p<.05). An r=.022 was found with variable Body Image. This implies that knowledge score has a
very weak positive relationship with Body Image.The relationship is not significant (p>.05). An
r=.086 was found with variable Sexually Active. This implies that knowledge score has a very
weak positive relationship with Sexually Active though the relationship is significant (p<.05). The
last variable, Participated in Risk Behavior had a r=.146which implies that it has a weak positive
relationship with knowledge score and the relationship is significant (p<.05).
From the above analysis, the variable that was not significant (body image) was not
considered in the multiple regression model.
Table 6: Model Summary
Model R
R
Square
Adjusted
R
Square
Std.
Error of
the
Estimate
1 .343a .118 .112 9.1783
a. Predictors: (Constant), Participated in Risk Behavior, Race, Gender, Sexually Active, Total
Family Annual Income
The R-squared value was found to be .118. This implies that the 5 independent variables
selected managed to predict 11.8% of the variance experience in the knowledge score model.
The rest of the variance (88.2%) was contributed by other factors outside this model (Cox, 2018).
⊘ This is a preview!⊘
Do you want full access?
Subscribe today to unlock all pages.
Trusted by 1+ million students worldwide
BIOSTATISTICS FINAL ASSESSMENT 7
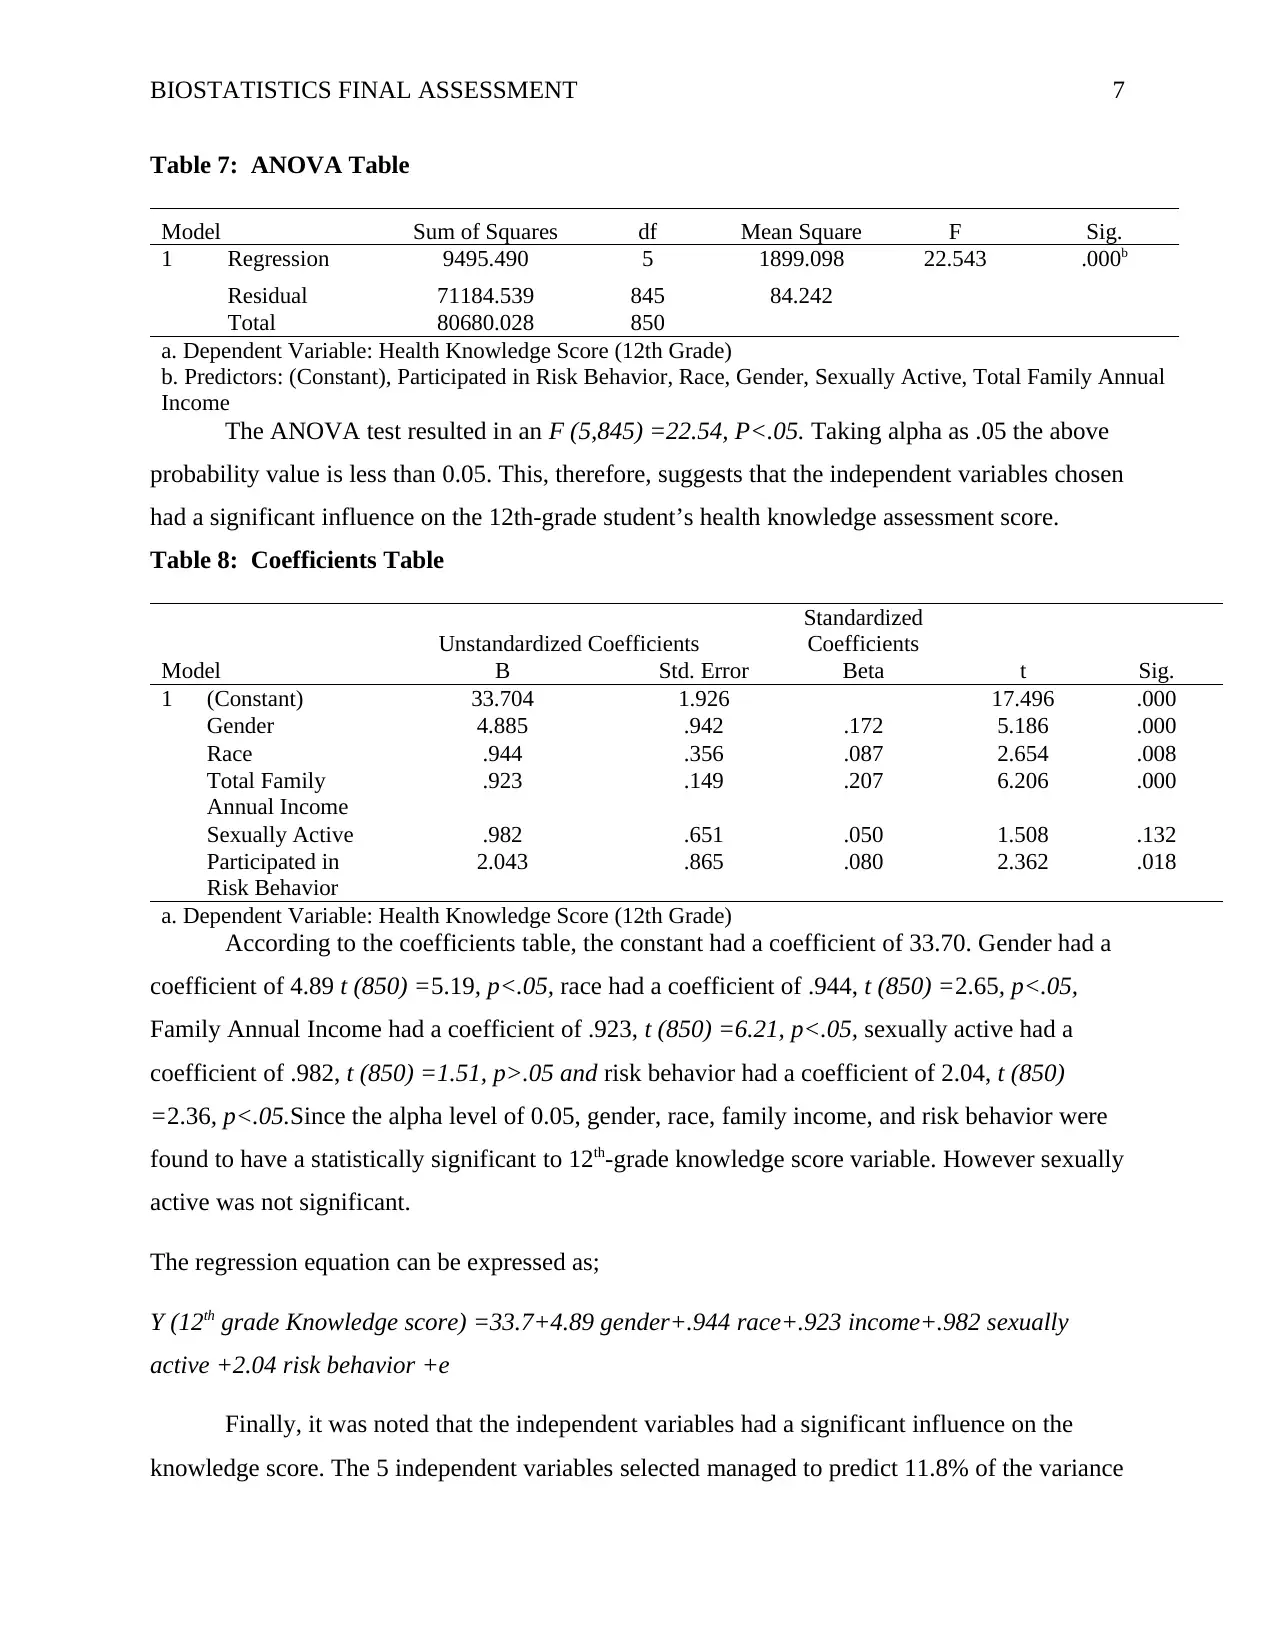
Table 7: ANOVA Table
Model Sum of Squares df Mean Square F Sig.
1 Regression 9495.490 5 1899.098 22.543 .000b
Residual 71184.539 845 84.242
Total 80680.028 850
a. Dependent Variable: Health Knowledge Score (12th Grade)
b. Predictors: (Constant), Participated in Risk Behavior, Race, Gender, Sexually Active, Total Family Annual
Income
The ANOVA test resulted in an F (5,845) =22.54, P<.05. Taking alpha as .05 the above
probability value is less than 0.05. This, therefore, suggests that the independent variables chosen
had a significant influence on the 12th-grade student’s health knowledge assessment score.
Table 8: Coefficients Table
Model
Unstandardized Coefficients
Standardized
Coefficients
t Sig.B Std. Error Beta
1 (Constant) 33.704 1.926 17.496 .000
Gender 4.885 .942 .172 5.186 .000
Race .944 .356 .087 2.654 .008
Total Family
Annual Income
.923 .149 .207 6.206 .000
Sexually Active .982 .651 .050 1.508 .132
Participated in
Risk Behavior
2.043 .865 .080 2.362 .018
a. Dependent Variable: Health Knowledge Score (12th Grade)
According to the coefficients table, the constant had a coefficient of 33.70. Gender had a
coefficient of 4.89 t (850) =5.19, p<.05, race had a coefficient of .944, t (850) =2.65, p<.05,
Family Annual Income had a coefficient of .923, t (850) =6.21, p<.05, sexually active had a
coefficient of .982, t (850) =1.51, p>.05 and risk behavior had a coefficient of 2.04, t (850)
=2.36, p<.05.Since the alpha level of 0.05, gender, race, family income, and risk behavior were
found to have a statistically significant to 12th-grade knowledge score variable. However sexually
active was not significant.
The regression equation can be expressed as;
Y (12th grade Knowledge score) =33.7+4.89 gender+.944 race+.923 income+.982 sexually
active +2.04 risk behavior +e
Finally, it was noted that the independent variables had a significant influence on the
knowledge score. The 5 independent variables selected managed to predict 11.8% of the variance
Paraphrase This Document
Need a fresh take? Get an instant paraphrase of this document with our AI Paraphraser
BIOSTATISTICS FINAL ASSESSMENT 8
experience in the knowledge score model. This, however, is a small value compared to the
recommended values statistically (70%). Variable gender was found to have the highest
contribution on the knowledge score variable, followed by risk behavior, sexually active, race
and income respectively.
Question 3
The health impact pyramid is an alternative conceptual framework for public health
action. According to this arrangement efforts to address the socioeconomic factors are placed at
the base, followed by the general public interventions that will have a change in perception of
health, a protective intervention that have a long time effect, direct clinical care and lastly
counseling and general education. CHAT program is one of the programs that is geared towards
increasing sexual health knowledge to students. This will go a long way to ensure that the
community and the country at large are secure and well informed in sexual health. Generally,
education and counseling were found to be the top of the pyramid. According to the results from
the data analyzed, females were found to be more empowered (M=52.42) in terms of sexual
education compared to males (M= 46.29) from the assessment done. In many societies, the male
figure is tasked to make important decisions about the family. There is, therefore, need to ensure
that they are well empowered too. From the analysis, the variables gender was found to have the
highest contribution on the knowledge score variable, followed by risk behavior, sexually active,
race and family income. (p<.05).There is, therefore, need to incorporate them in our
intervention. To ensure the effectiveness of this program; in counseling and education
intervention, the efforts of the government, schools, hospitals, and family should be increased.
Both parents need to educate their children on sex and sexual health early enough even before
anyone else. This will ensure the students are aware of the changes that occur in their bodies
especially at teenage and are able to face life with responsibility. The government incorporate
sexual health in the curriculum and make it common in school and the media to create
awareness. On clinical interventions, students show be informed of the diseases involved, the
necessary medication from hospitals and the support they can get from the hospital in case of
sexual abuse. On lasting protective interventions, the government through youth affairs can
create points where young people could visit at any time for counseling and guidance. In the case
BIOSTATISTICS FINAL ASSESSMENT 9
of diseases such as HIV, male circumcision and condoms and abstinence can be championed. On
changing context, this is done by instilling responsibility in young people. This involves that
education on abstinence, family and biblical concepts of purity and not engaging in unprotected
sex. Lastly on socioeconomic factors, ensuring parents and guardians have time with their
children, reducing poverty levels that could cause young people to be taken advantage of and
encouraging faith in the society through measures such as attending church to be taught right
values.
⊘ This is a preview!⊘
Do you want full access?
Subscribe today to unlock all pages.
Trusted by 1+ million students worldwide
BIOSTATISTICS FINAL ASSESSMENT 10
References
Cox, D. R. (2018). Applied statistics-principles and examples. Routledge.
Gupta, V.(1999). SPSS for Beginners, published by VJBooks Inc.
References
Cox, D. R. (2018). Applied statistics-principles and examples. Routledge.
Gupta, V.(1999). SPSS for Beginners, published by VJBooks Inc.
1 out of 10
Your All-in-One AI-Powered Toolkit for Academic Success.
+13062052269
info@desklib.com
Available 24*7 on WhatsApp / Email
![[object Object]](/_next/static/media/star-bottom.7253800d.svg)
Unlock your academic potential
© 2024 | Zucol Services PVT LTD | All rights reserved.