Assignment on Biostatistics for Health Care Research
VerifiedAdded on 2022/08/22
|12
|1384
|18
AI Summary
Contribute Materials
Your contribution can guide someone’s learning journey. Share your
documents today.
Running head: BIOSTATISTICS FOR HEALTH CARE RESEARCH
Biostatistics for health care research
Biostatistics for health care research
Secure Best Marks with AI Grader
Need help grading? Try our AI Grader for instant feedback on your assignments.
1BIOSTATISTICS FOR HEALTH CARE RESEARCH
PART A EXERCISES
A1
PART A EXERCISES
A1
2BIOSTATISTICS FOR HEALTH CARE RESEARCH
Part A2: The answers to the following question are dependent on A1.
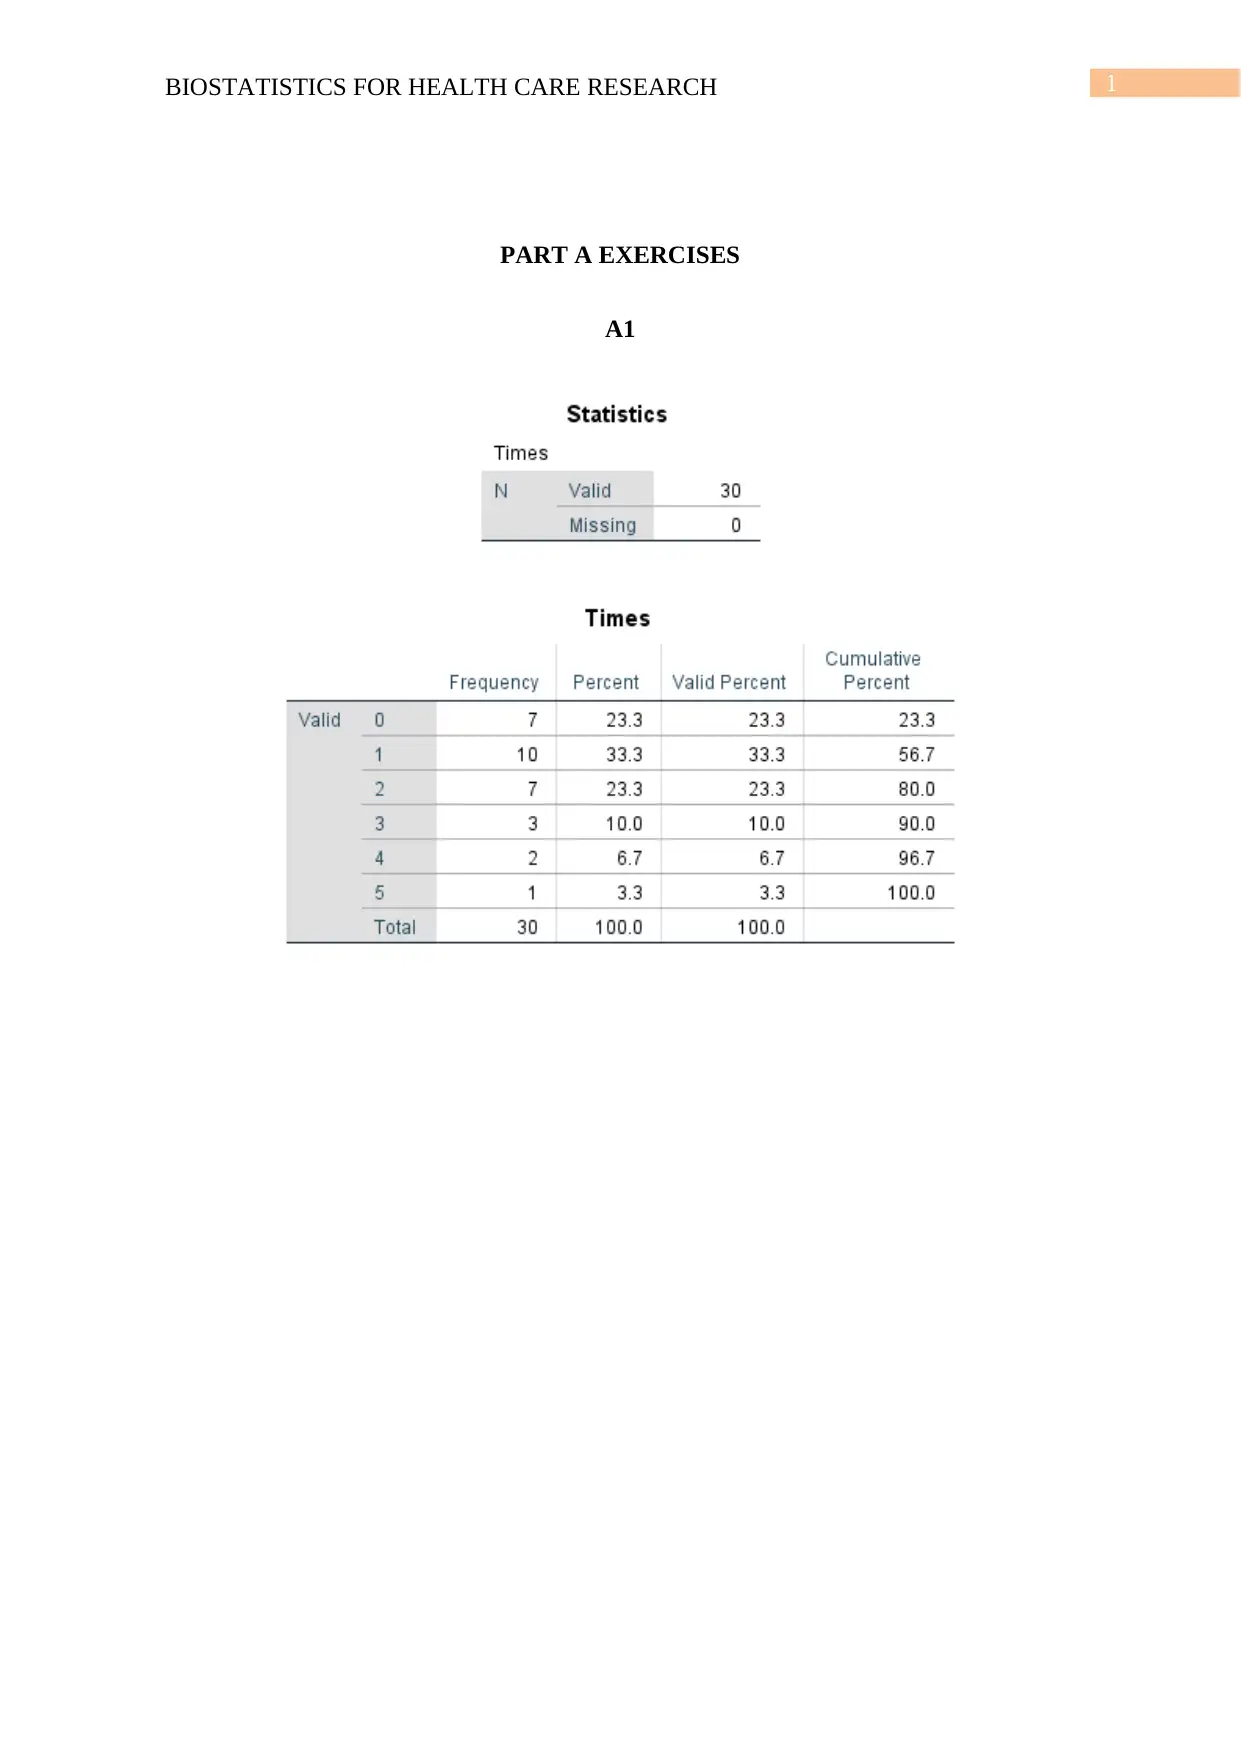
a) The total sample size of the dataset is 30.
b) The percentage of nursing home students is 76.7%. The total valid percentage of the
given sample is 100 and the valid percentage of the given criteria is 23.3.
c) Among the five valid falls, only 1 fall was the most frequent fall of this sample which
is 10.
d) Among the different kinds of falls, the 5th fall which is the least frequent.
e) The total percentage of residents who have 2 or fewer falls is 80%. The total number
of samples is 30 and the summation of the frequency was found to be 24.
f) Outliers can be defined as the type of situation or a pattern that is very much different
from the overall pattern. The outliers are either higher or lower than the rest of the
values which are there in the dataset. It can also be termed as the value which lies
outside the other values. The inner fences of a dataset can be classified as the minor
outliner and which falls outside the outer fence can be termed as the major outlier.
In the given data set there are no real outliners as each and every data are similar.
Part A2: The answers to the following question are dependent on A1.
a) The total sample size of the dataset is 30.
b) The percentage of nursing home students is 76.7%. The total valid percentage of the
given sample is 100 and the valid percentage of the given criteria is 23.3.
c) Among the five valid falls, only 1 fall was the most frequent fall of this sample which
is 10.
d) Among the different kinds of falls, the 5th fall which is the least frequent.
e) The total percentage of residents who have 2 or fewer falls is 80%. The total number
of samples is 30 and the summation of the frequency was found to be 24.
f) Outliers can be defined as the type of situation or a pattern that is very much different
from the overall pattern. The outliers are either higher or lower than the rest of the
values which are there in the dataset. It can also be termed as the value which lies
outside the other values. The inner fences of a dataset can be classified as the minor
outliner and which falls outside the outer fence can be termed as the major outlier.
In the given data set there are no real outliners as each and every data are similar.
3BIOSTATISTICS FOR HEALTH CARE RESEARCH
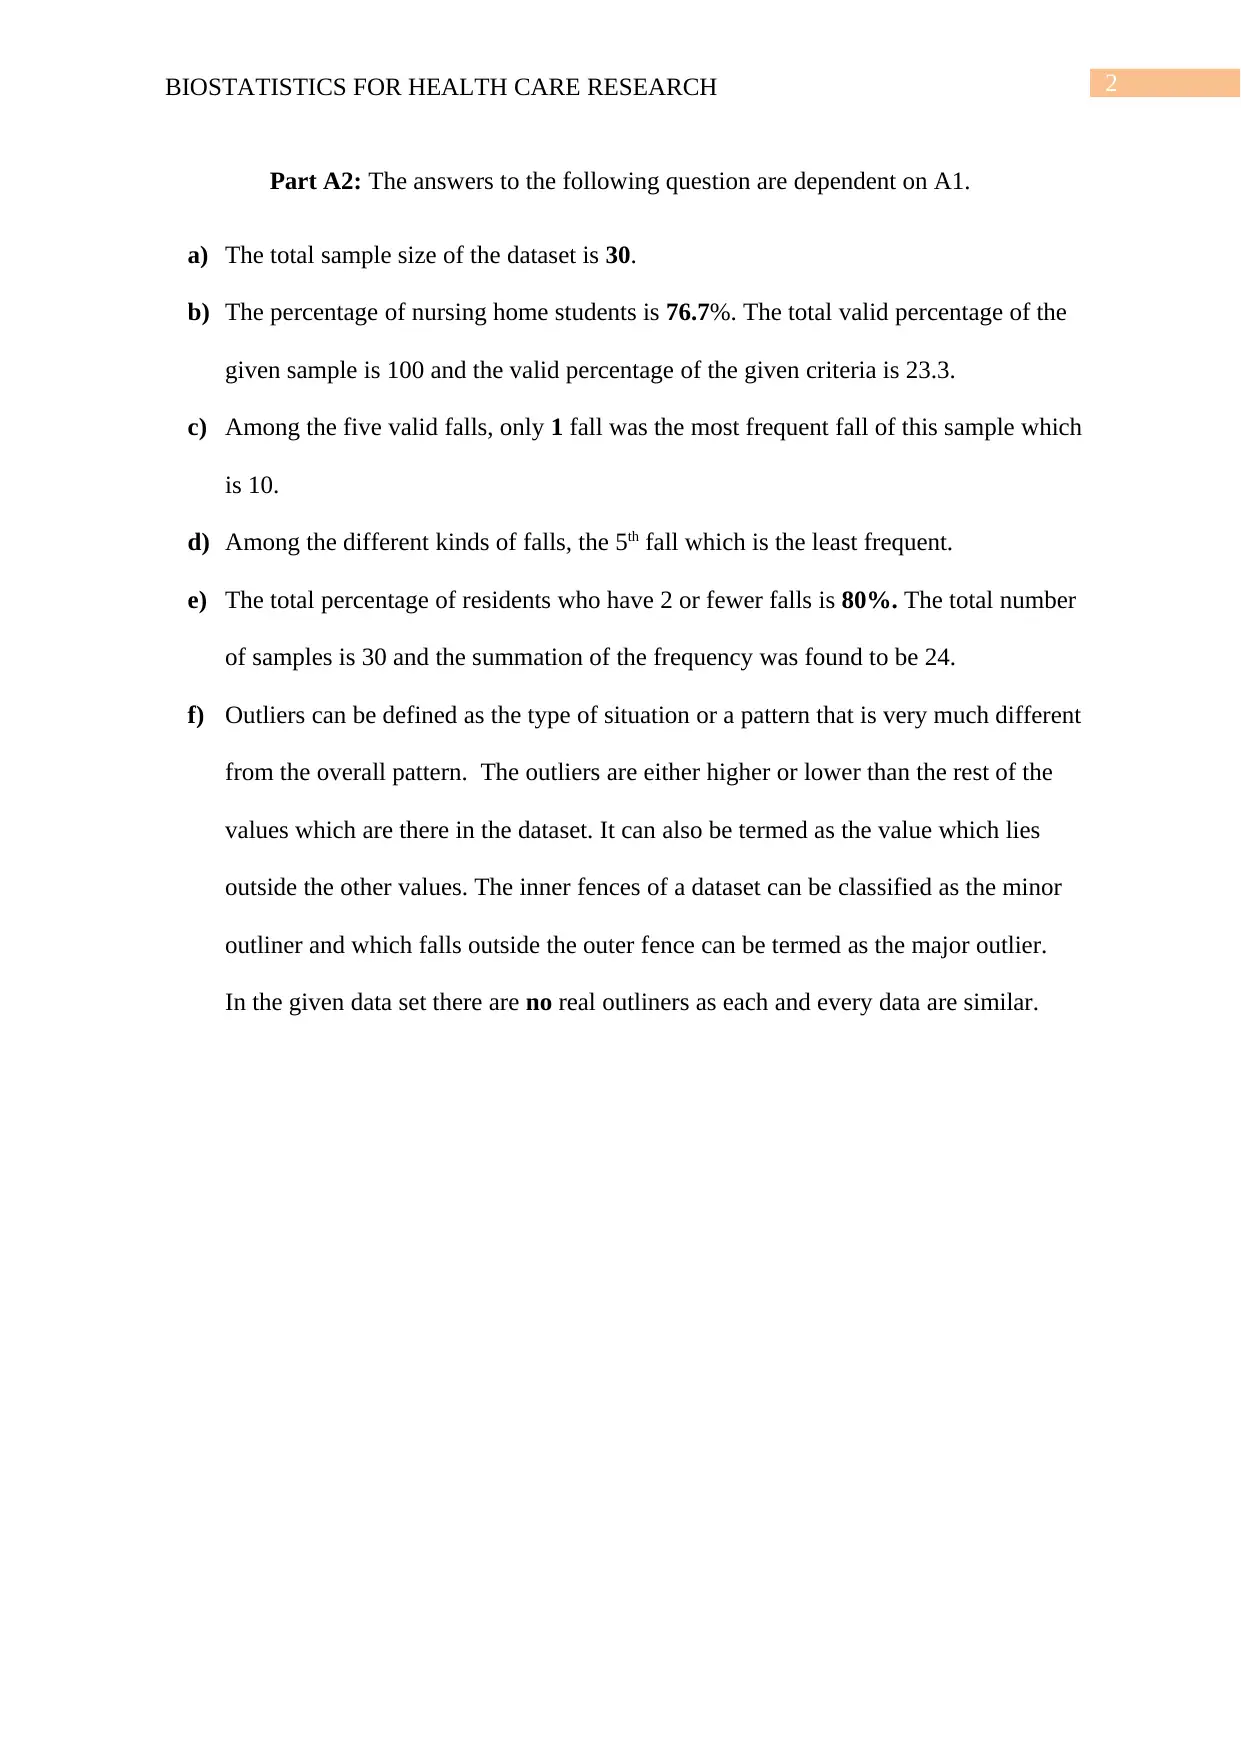
A3: Superimposing of normal distribution of a histogram
a. Histogram
b. There are three different categories of modality and it is named on the basis of the
clear peaks. Based on the above histogram it can be said that there is one clear peak in
this histogram and the entire scenario can be defined as unimodal distribution. There
are two types of skewed distribution techniques such as the right skewed and the left
skewed distribution. The long tail in the negative direction can be termed as the left
skewed and the long tail in the positive direction can be termed as the right skewed.
This histogram was very much helpful to conclude that the shape of the frequency
distribution is left skewed.
Secure Best Marks with AI Grader
Need help grading? Try our AI Grader for instant feedback on your assignments.
4BIOSTATISTICS FOR HEALTH CARE RESEARCH
PART B EXERCISES
B1.
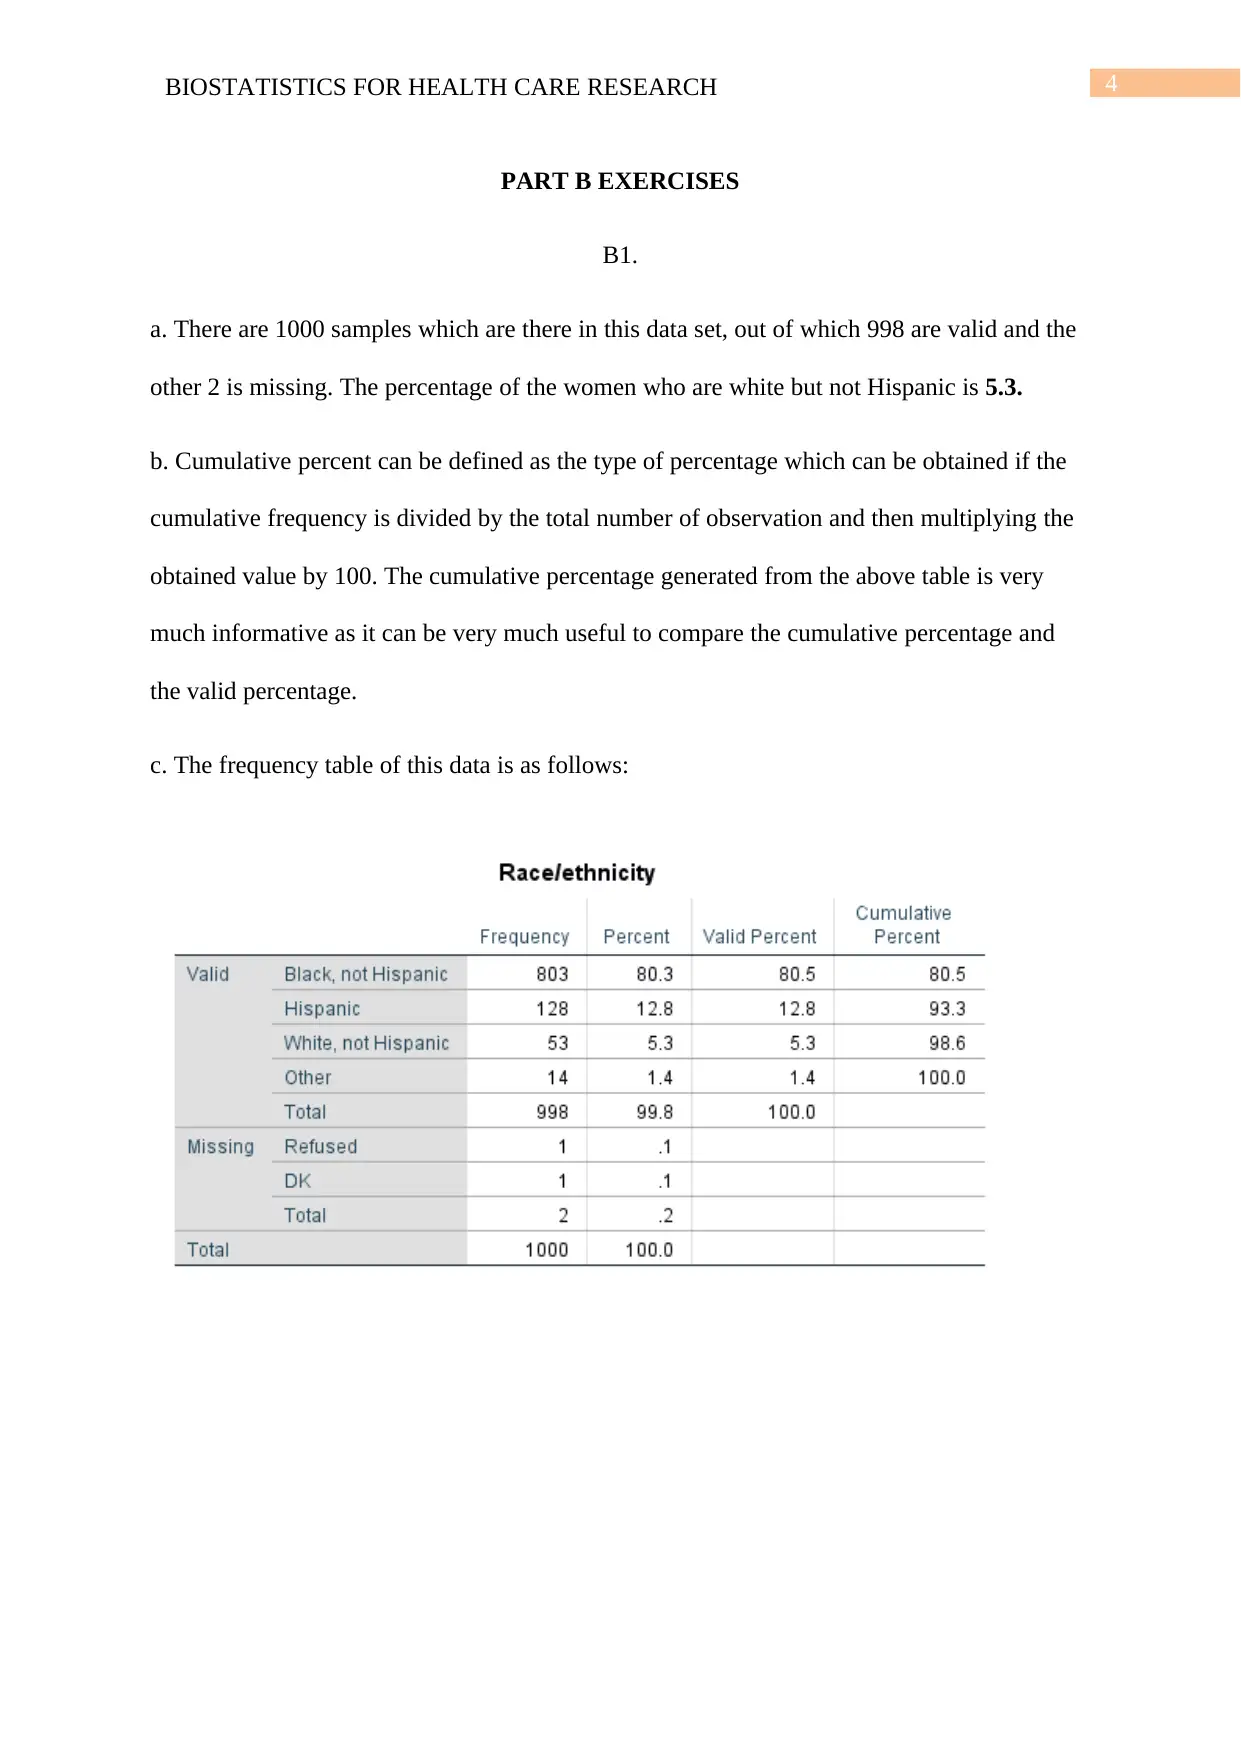
a. There are 1000 samples which are there in this data set, out of which 998 are valid and the
other 2 is missing. The percentage of the women who are white but not Hispanic is 5.3.
b. Cumulative percent can be defined as the type of percentage which can be obtained if the
cumulative frequency is divided by the total number of observation and then multiplying the
obtained value by 100. The cumulative percentage generated from the above table is very
much informative as it can be very much useful to compare the cumulative percentage and
the valid percentage.
c. The frequency table of this data is as follows:
PART B EXERCISES
B1.
a. There are 1000 samples which are there in this data set, out of which 998 are valid and the
other 2 is missing. The percentage of the women who are white but not Hispanic is 5.3.
b. Cumulative percent can be defined as the type of percentage which can be obtained if the
cumulative frequency is divided by the total number of observation and then multiplying the
obtained value by 100. The cumulative percentage generated from the above table is very
much informative as it can be very much useful to compare the cumulative percentage and
the valid percentage.
c. The frequency table of this data is as follows:
5BIOSTATISTICS FOR HEALTH CARE RESEARCH
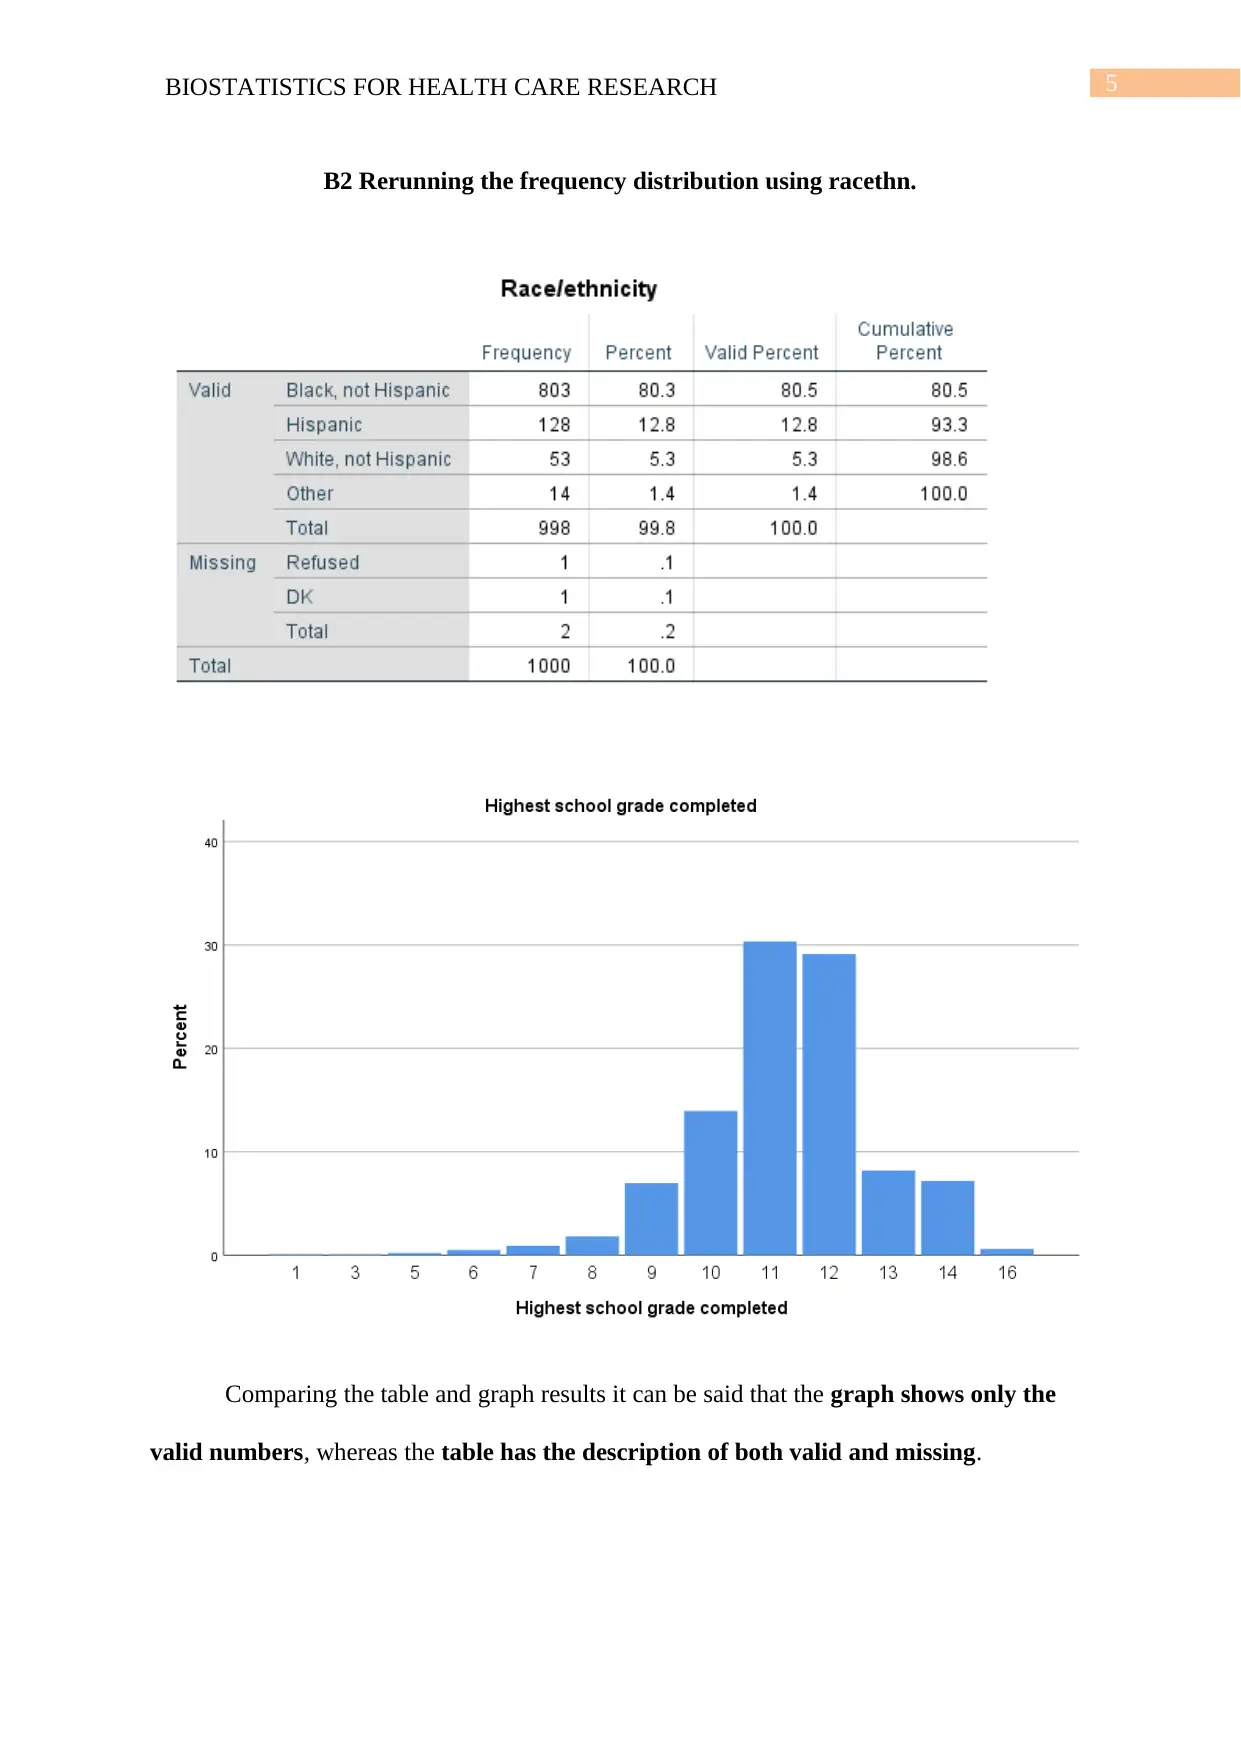
B2 Rerunning the frequency distribution using racethn.
Comparing the table and graph results it can be said that the graph shows only the
valid numbers, whereas the table has the description of both valid and missing.
B2 Rerunning the frequency distribution using racethn.
Comparing the table and graph results it can be said that the graph shows only the
valid numbers, whereas the table has the description of both valid and missing.
6BIOSTATISTICS FOR HEALTH CARE RESEARCH
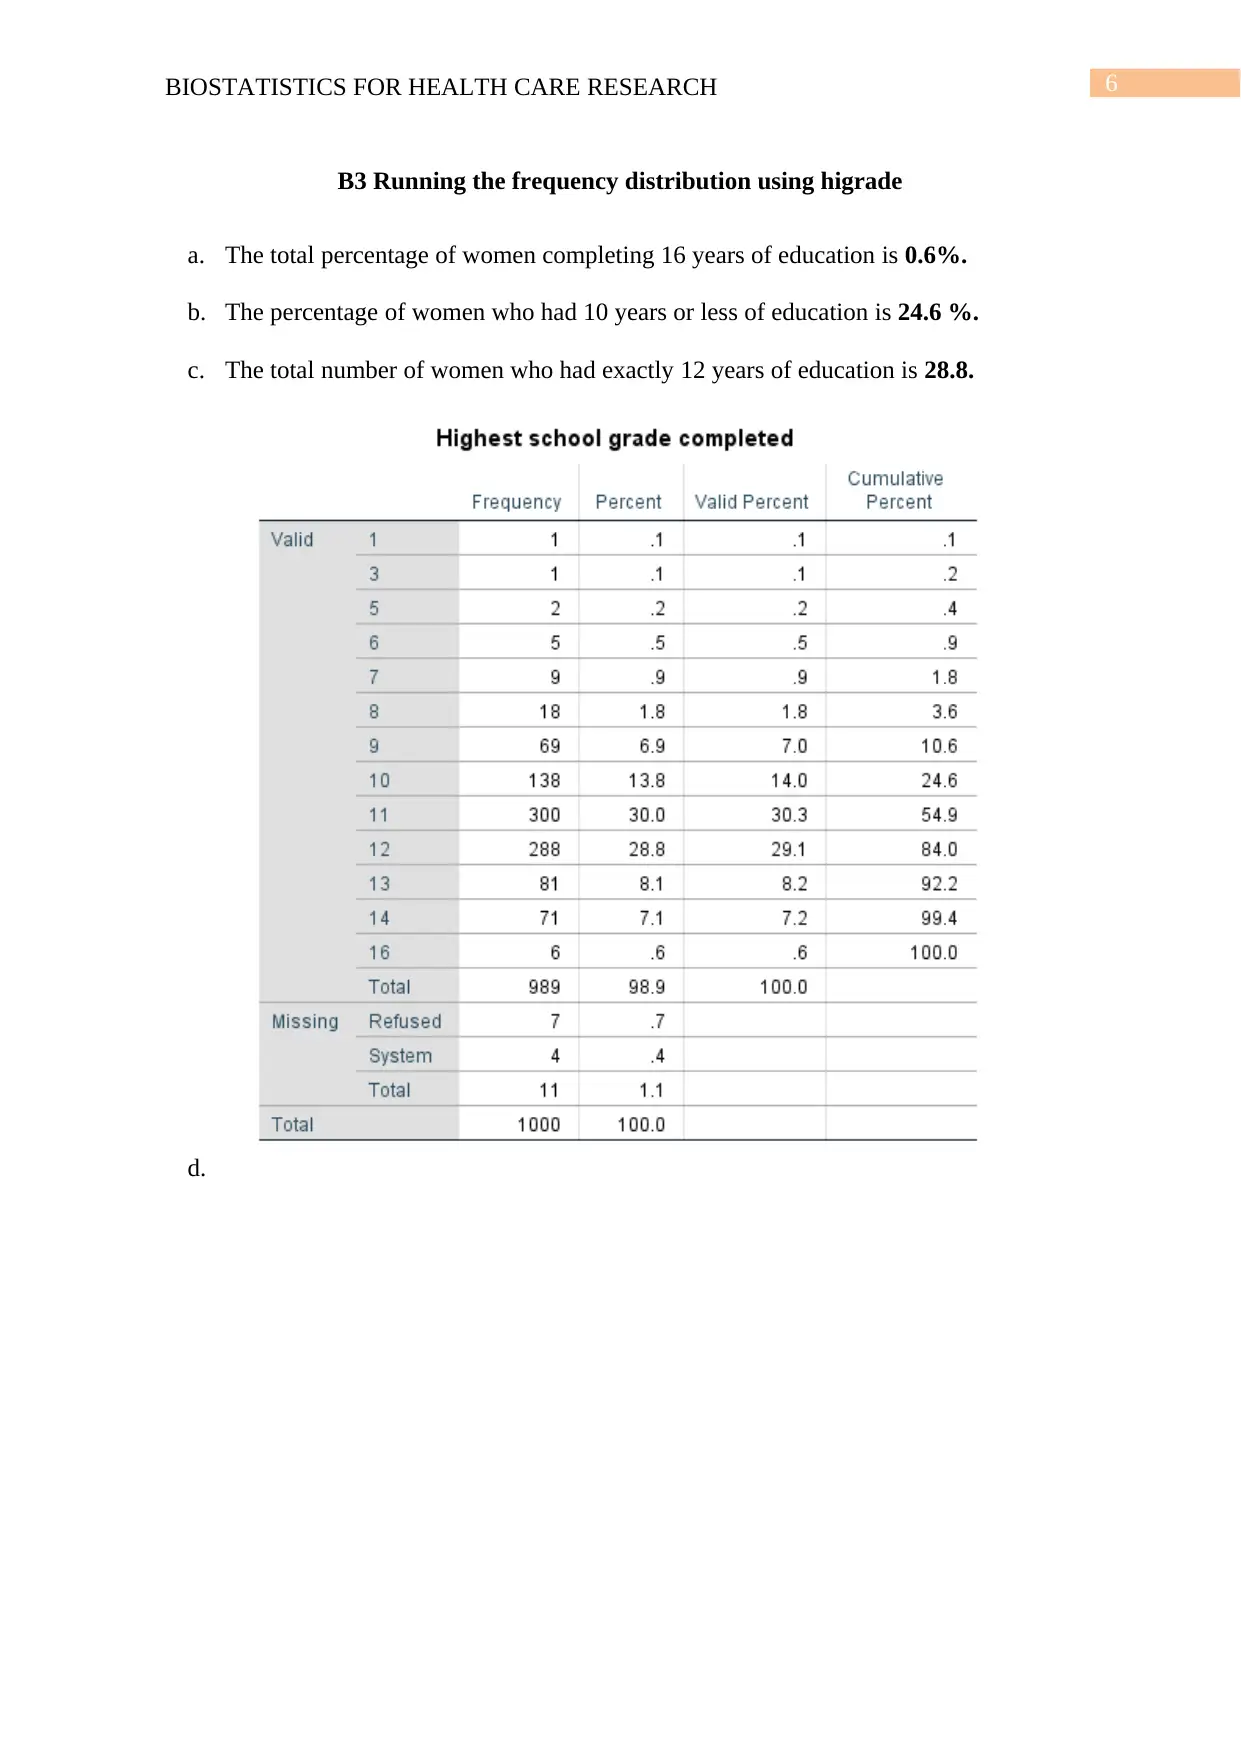
B3 Running the frequency distribution using higrade
a. The total percentage of women completing 16 years of education is 0.6%.
b. The percentage of women who had 10 years or less of education is 24.6 %.
c. The total number of women who had exactly 12 years of education is 28.8.
d.
B3 Running the frequency distribution using higrade
a. The total percentage of women completing 16 years of education is 0.6%.
b. The percentage of women who had 10 years or less of education is 24.6 %.
c. The total number of women who had exactly 12 years of education is 28.8.
d.
Paraphrase This Document
Need a fresh take? Get an instant paraphrase of this document with our AI Paraphraser

7BIOSTATISTICS FOR HEALTH CARE RESEARCH
B4:
a. 989 cases had valid information and the total percentage of the overall sample which
represents these cases is 98.9%.
b. There are 2 different types of missing values.
c. The missing value codes which can be seen from the data editor are 95 and 98.
d. There are two missing codes have unique meanings, 95 denotes the refused and 98
denotes that they don’t know.
B5: Rerunning distribution frequency for higrade for a third time.
a. The normality of the distribution is as follows:
Normality=Mean ± Standard Deviation.
Mean: 11.28
Standard Deviation: 1.561
Hence, Normality = 11.28 ± 1.561 = 12.841 or 9.719
8BIOSTATISTICS FOR HEALTH CARE RESEARCH
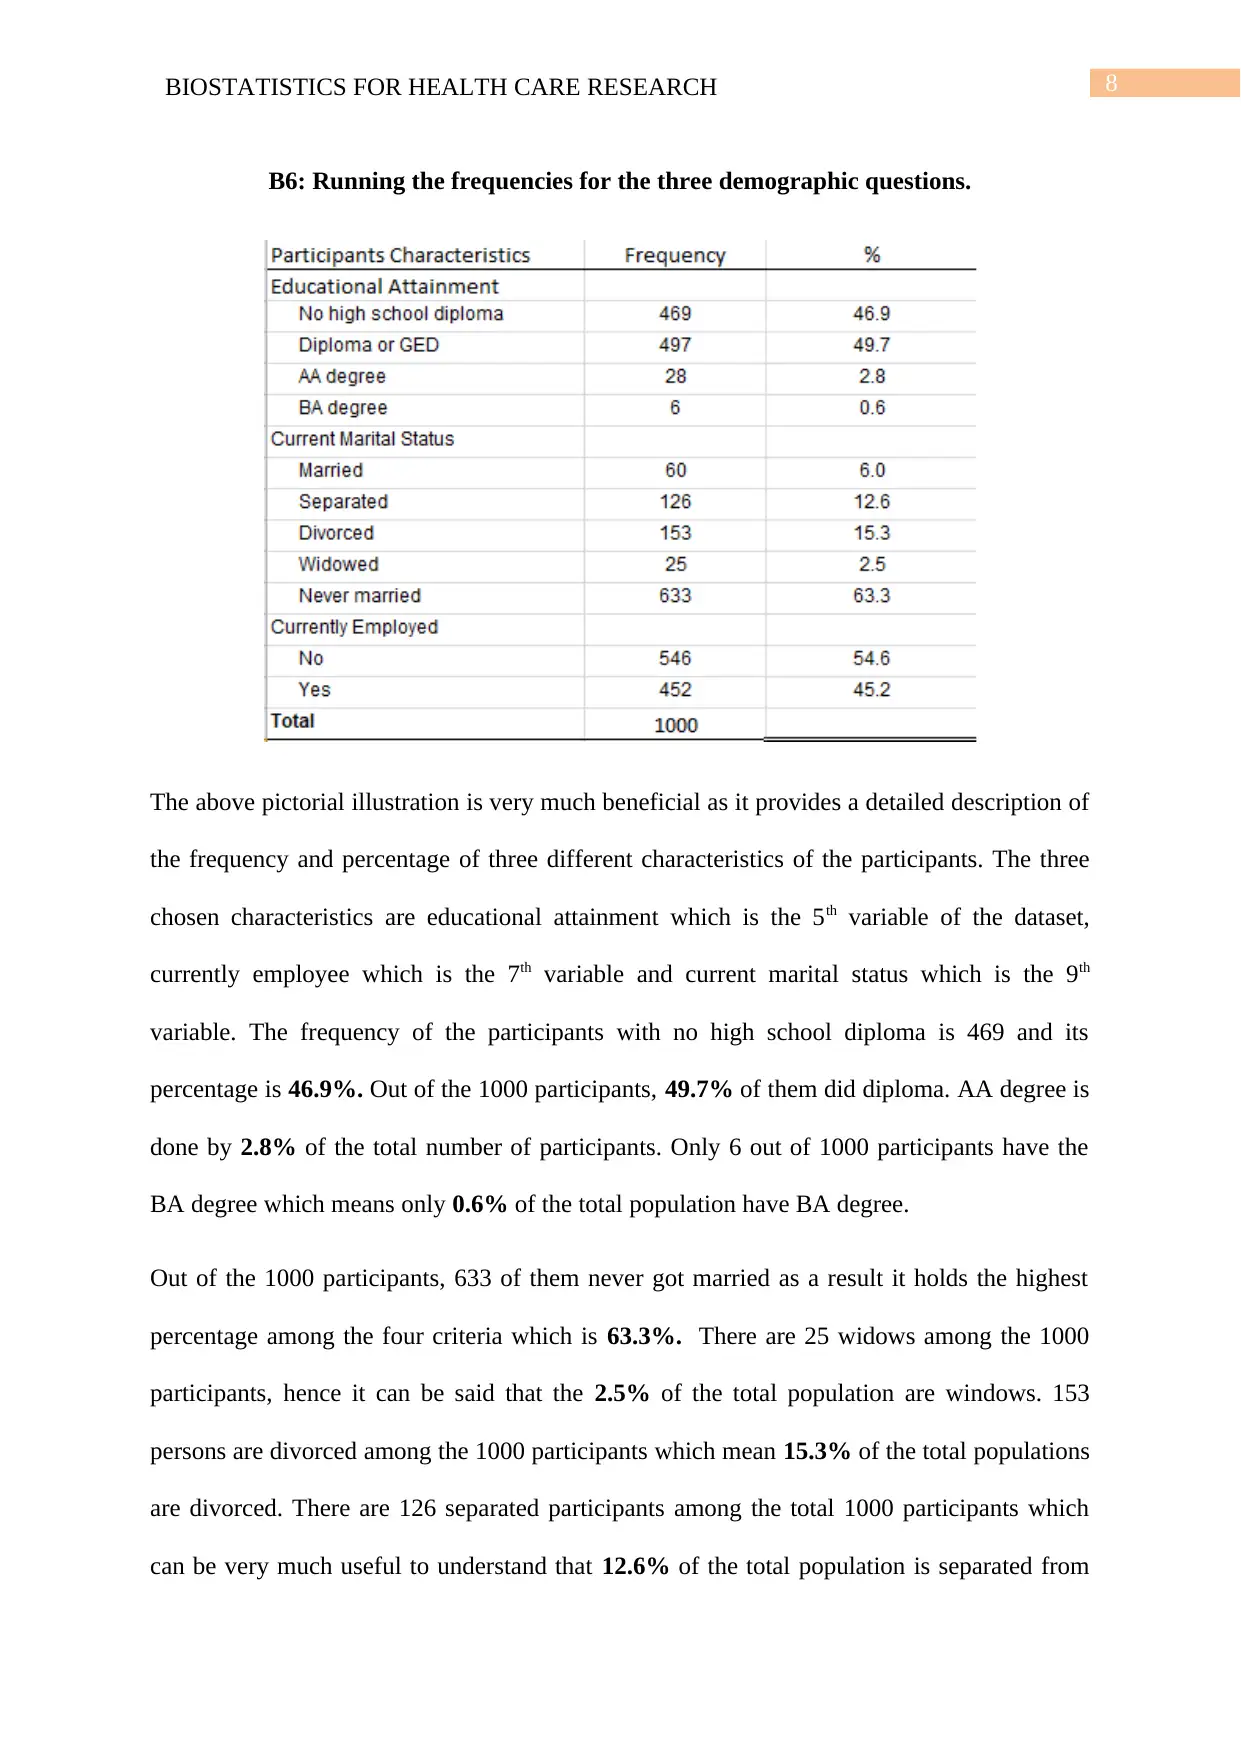
B6: Running the frequencies for the three demographic questions.
The above pictorial illustration is very much beneficial as it provides a detailed description of
the frequency and percentage of three different characteristics of the participants. The three
chosen characteristics are educational attainment which is the 5th variable of the dataset,
currently employee which is the 7th variable and current marital status which is the 9th
variable. The frequency of the participants with no high school diploma is 469 and its
percentage is 46.9%. Out of the 1000 participants, 49.7% of them did diploma. AA degree is
done by 2.8% of the total number of participants. Only 6 out of 1000 participants have the
BA degree which means only 0.6% of the total population have BA degree.
Out of the 1000 participants, 633 of them never got married as a result it holds the highest
percentage among the four criteria which is 63.3%. There are 25 widows among the 1000
participants, hence it can be said that the 2.5% of the total population are windows. 153
persons are divorced among the 1000 participants which mean 15.3% of the total populations
are divorced. There are 126 separated participants among the total 1000 participants which
can be very much useful to understand that 12.6% of the total population is separated from
9BIOSTATISTICS FOR HEALTH CARE RESEARCH
their partners. Only 60 participants among the 1000 are married which indicates that only 6%
of the population is married.
546 participants are not currently employed which indicates that 54.6% of the total
population is not employed. Out of the 1000 participants, 452 of them are current employed
which means that 45.2% of the total population is currently employed.
Secure Best Marks with AI Grader
Need help grading? Try our AI Grader for instant feedback on your assignments.
10BIOSTATISTICS FOR HEALTH CARE RESEARCH
Bibliography
Homer, M. S. (2018). An introduction to secondary data analysis with IBM SPSS statistics.
Educational Review, 70(2), 251-252.
Krstić, I. I., Nikolić, V., & Petković, A. I. (2018). PERFORMANCE OF THE SPSS
SOFTWARE AND ITS APPLICATION IN MANAGEMENT AND SAFETY PROJECTS.
The authors are responsible for the professional and linguistic accuracy of their papers., 78.
Nassar, Y. (2019). Using SPSS as Instruction Assisted Program in Improving Postgraduate
Students’ Comprehension to Statistical Concepts. Jordan Journal of Educational Sciences
Vol, 15(2), 251-257.
Ong, M. H. A., & Puteh, F. (2017). Quantitative Data Analysis: Choosing Between SPSS,
PLS, and AMOS in Social Science Research. International Interdisciplinary Journal of
Scientific Research, 3(1), 14-25.
Subramani, T., & Rajiv, S. R. (2016). Improving construction efficiency and productivity of
industry using SPSS. International Journal of Application or Innovation in Engineering &
Management (IJAIEM), 5(5), 239-250.
Šušić, M. (2018). Research the impact of FDI on some macroeconomic indicators in Bosnia
and Herzegovina by using of program IBM SPSS statistics. Journal of Process Management.
New Technologies, 6(3), 13-24.
Tan, F., Zhang, H., Zhao, X., Zhang, J., & Yi, R. (2020, January). SPSS Statistical Software
Analyses the Influence of Adoptive Persons of Preschool Children on Their Breakfast
Behavior. In Journal of Physics: Conference Series (Vol. 1437, No. 1, p. 012034). IOP
Publishing.

11BIOSTATISTICS FOR HEALTH CARE RESEARCH
Walker, D. A. (2017). JMASM 48: The Pearson Product-Moment Correlation Coefficient and
Adjustment Indices: The Fisher Approximate Unbiased Estimator and the Olkin-Pratt
Adjustment (SPSS). Journal of Modern Applied Statistical Methods, 16(2), 29.
Walker, D. A. (2017). JMASM 48: The Pearson Product-Moment Correlation Coefficient and
Adjustment Indices: The Fisher Approximate Unbiased Estimator and the Olkin-Pratt
Adjustment (SPSS). Journal of Modern Applied Statistical Methods, 16(2), 29.
1 out of 12
Related Documents


Your All-in-One AI-Powered Toolkit for Academic Success.
+13062052269
info@desklib.com
Available 24*7 on WhatsApp / Email
![[object Object]](/_next/static/media/star-bottom.7253800d.svg)
Unlock your academic potential
© 2024 | Zucol Services PVT LTD | All rights reserved.