Biostatistics 2: Analysis of Sample Data and Frequency Tables
VerifiedAdded on 2022/08/20
|12
|1505
|19
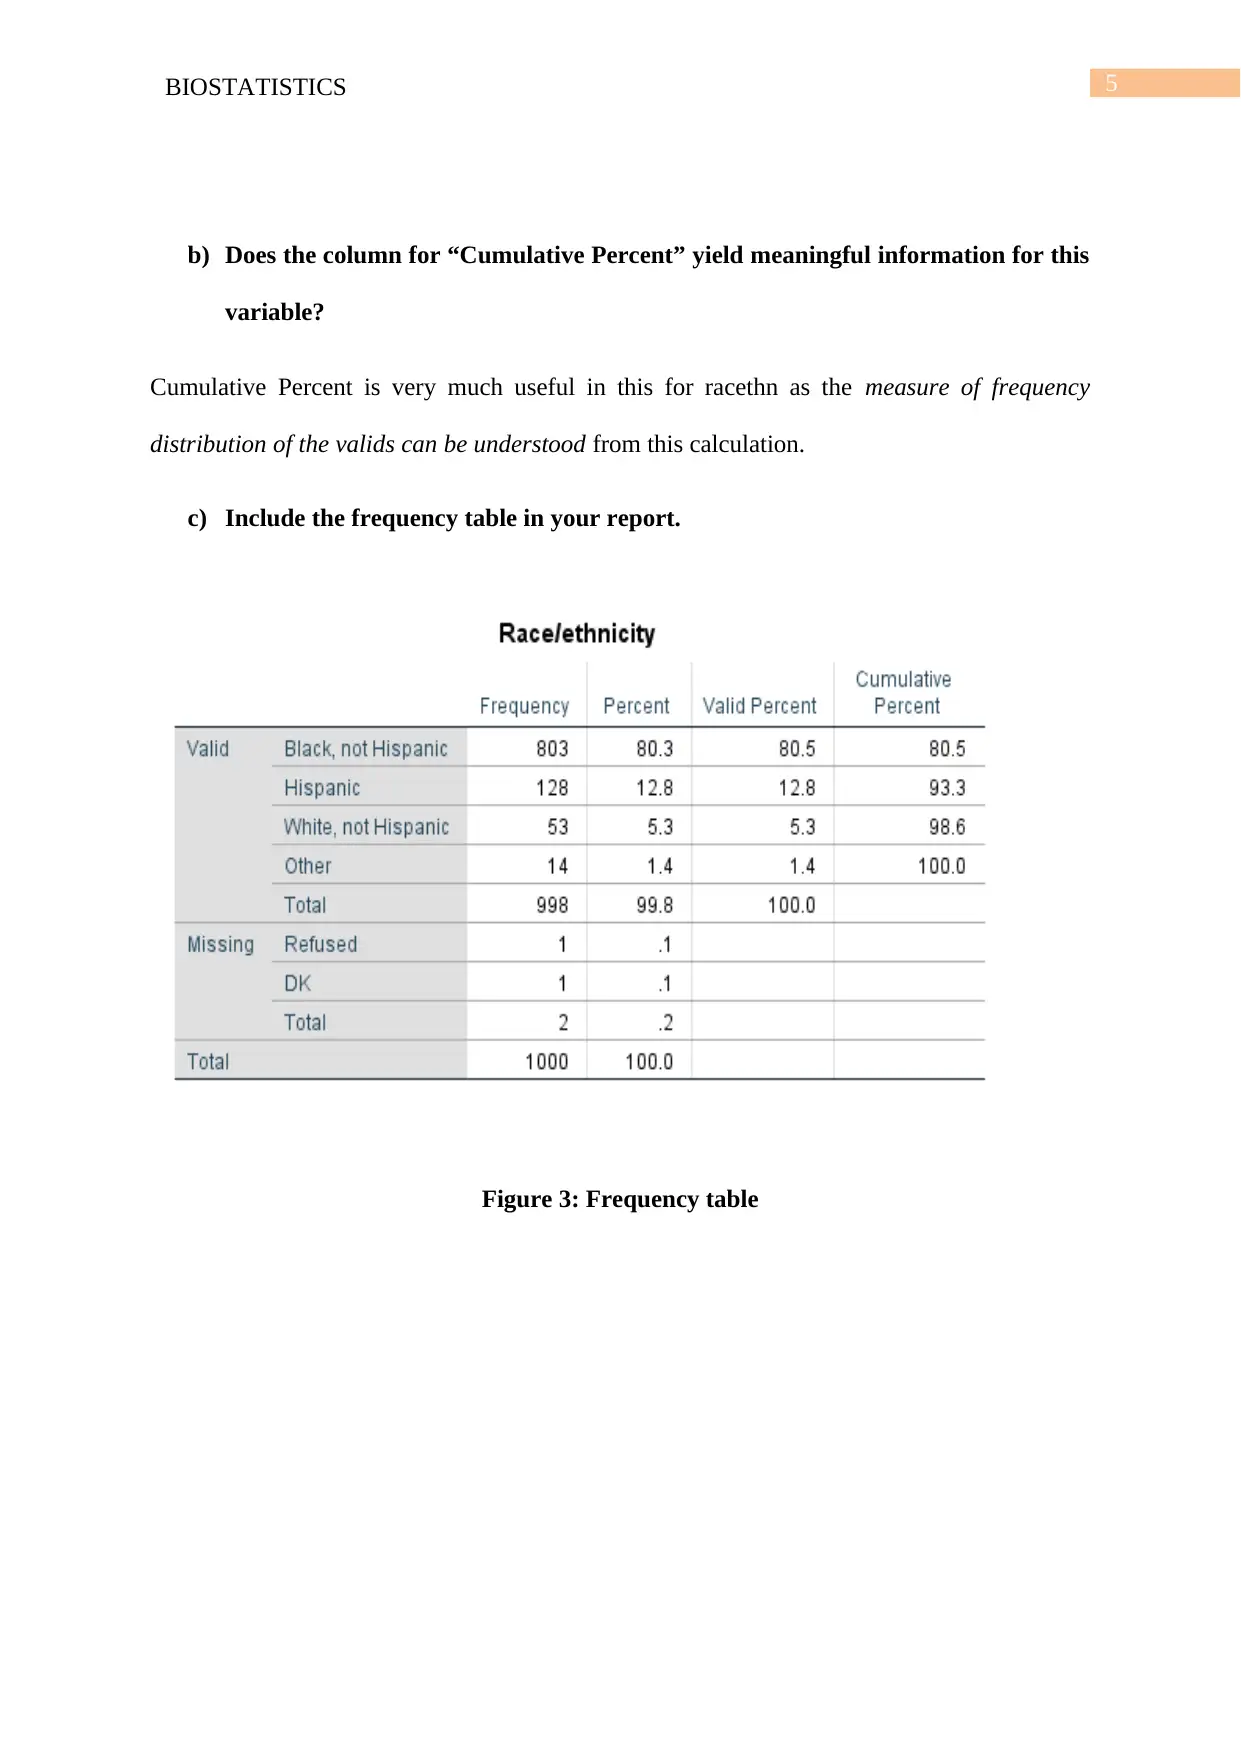
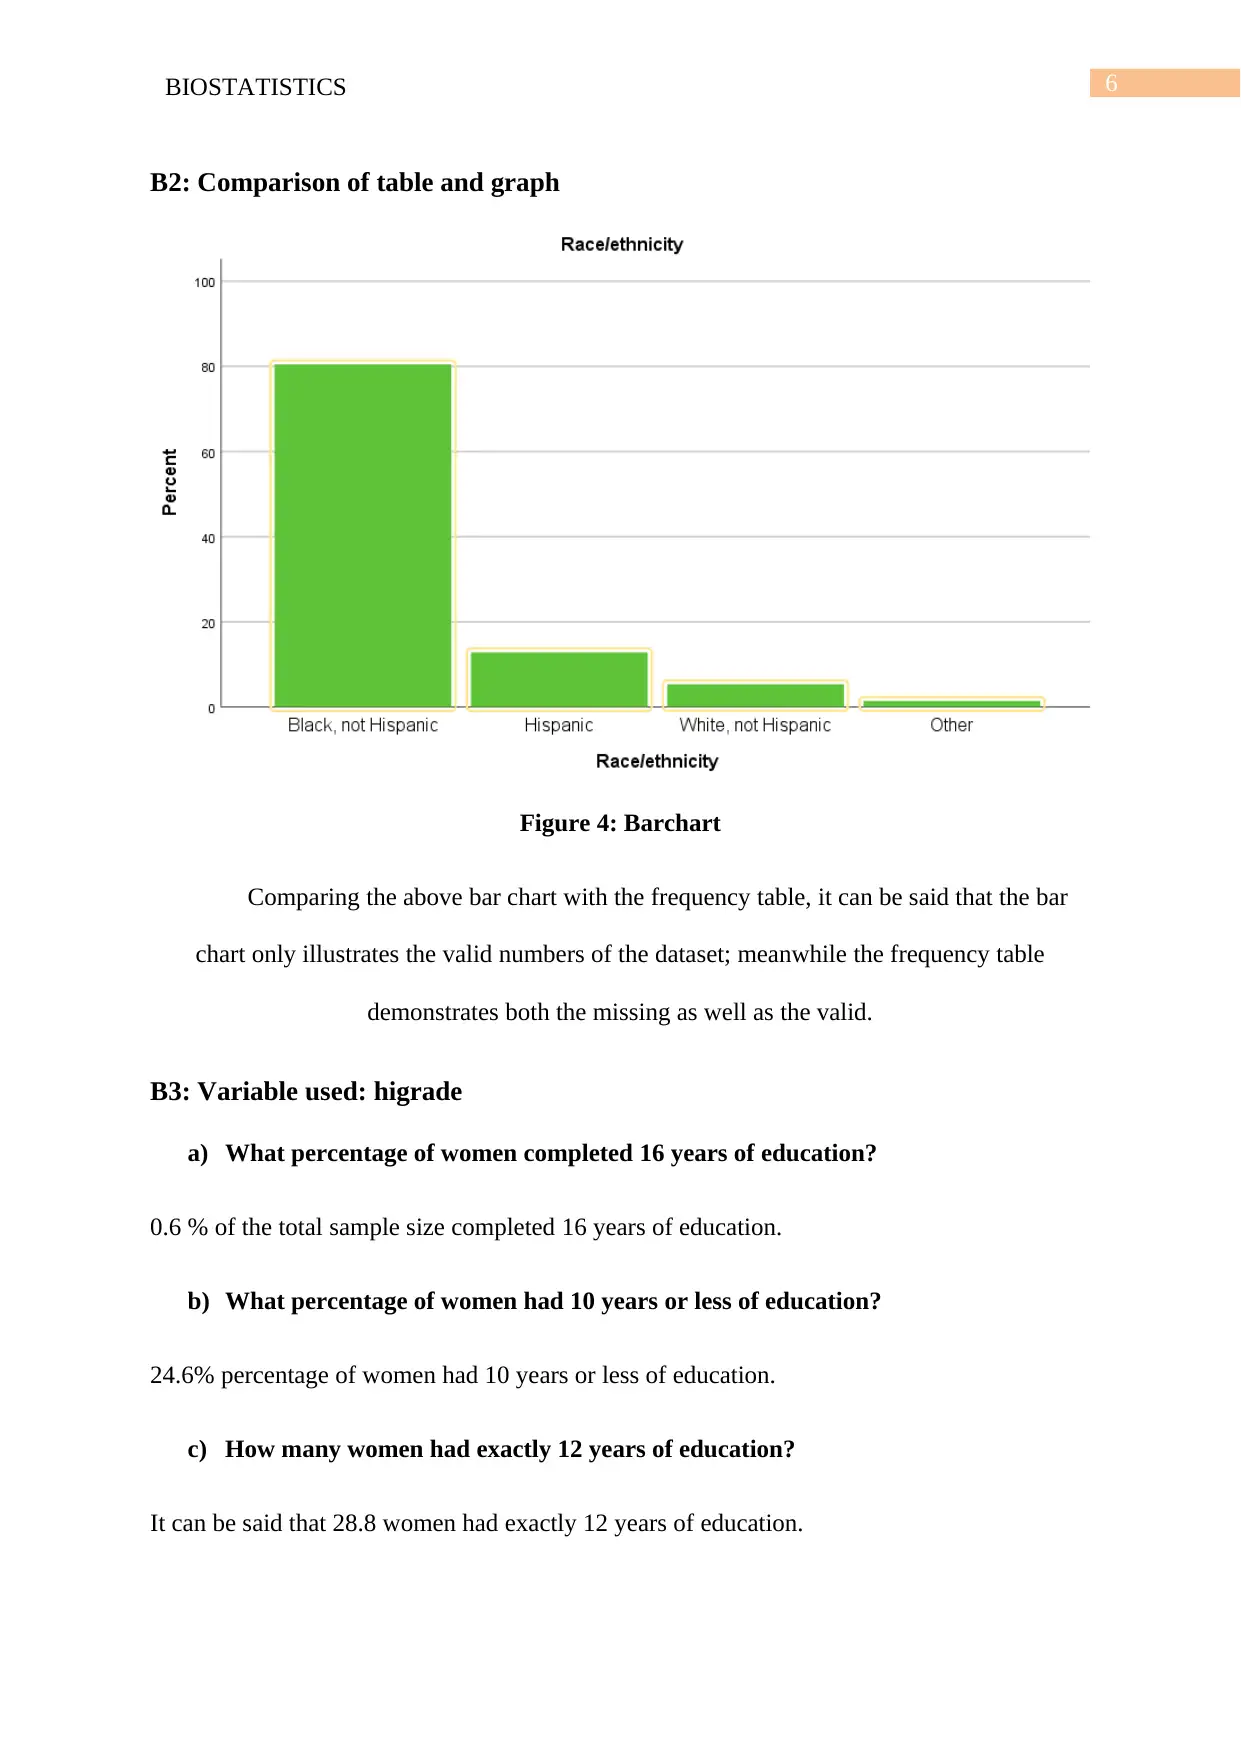
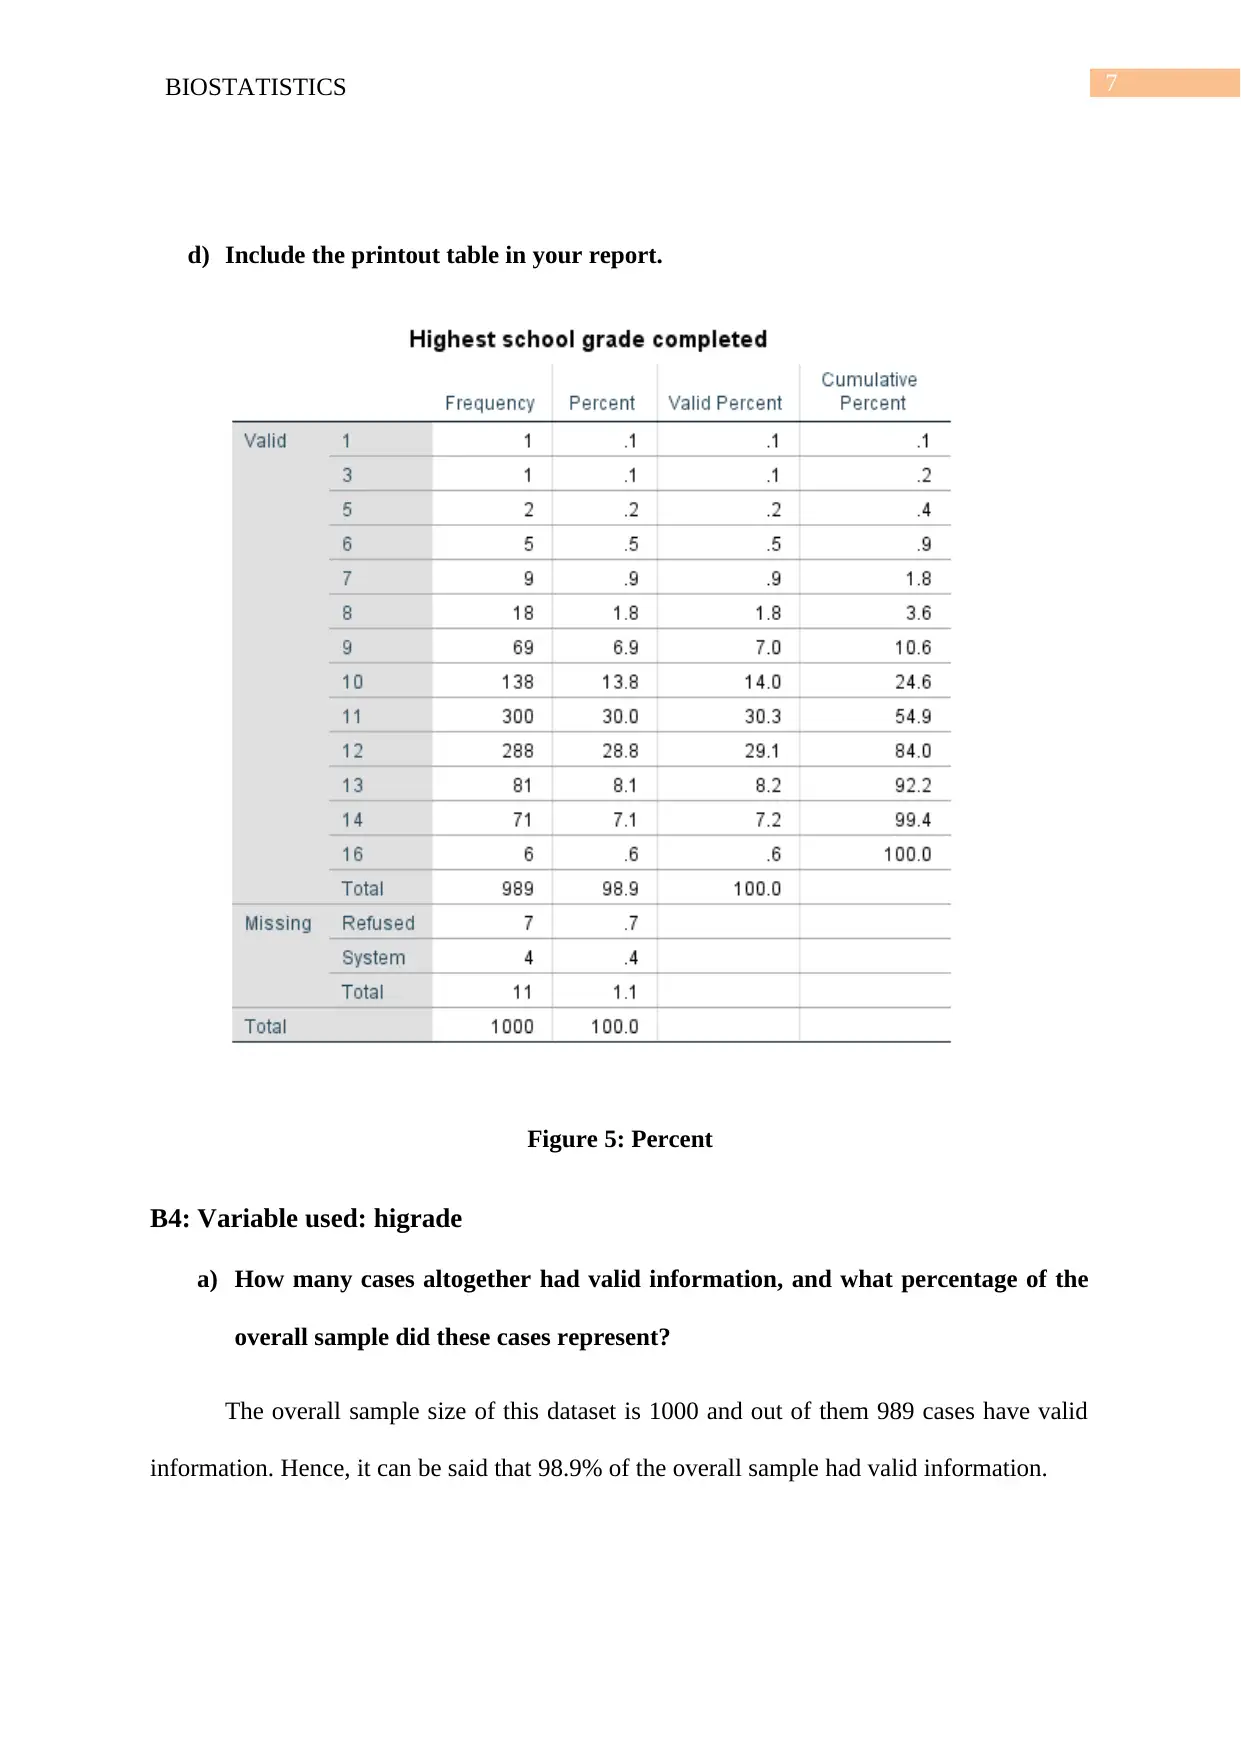
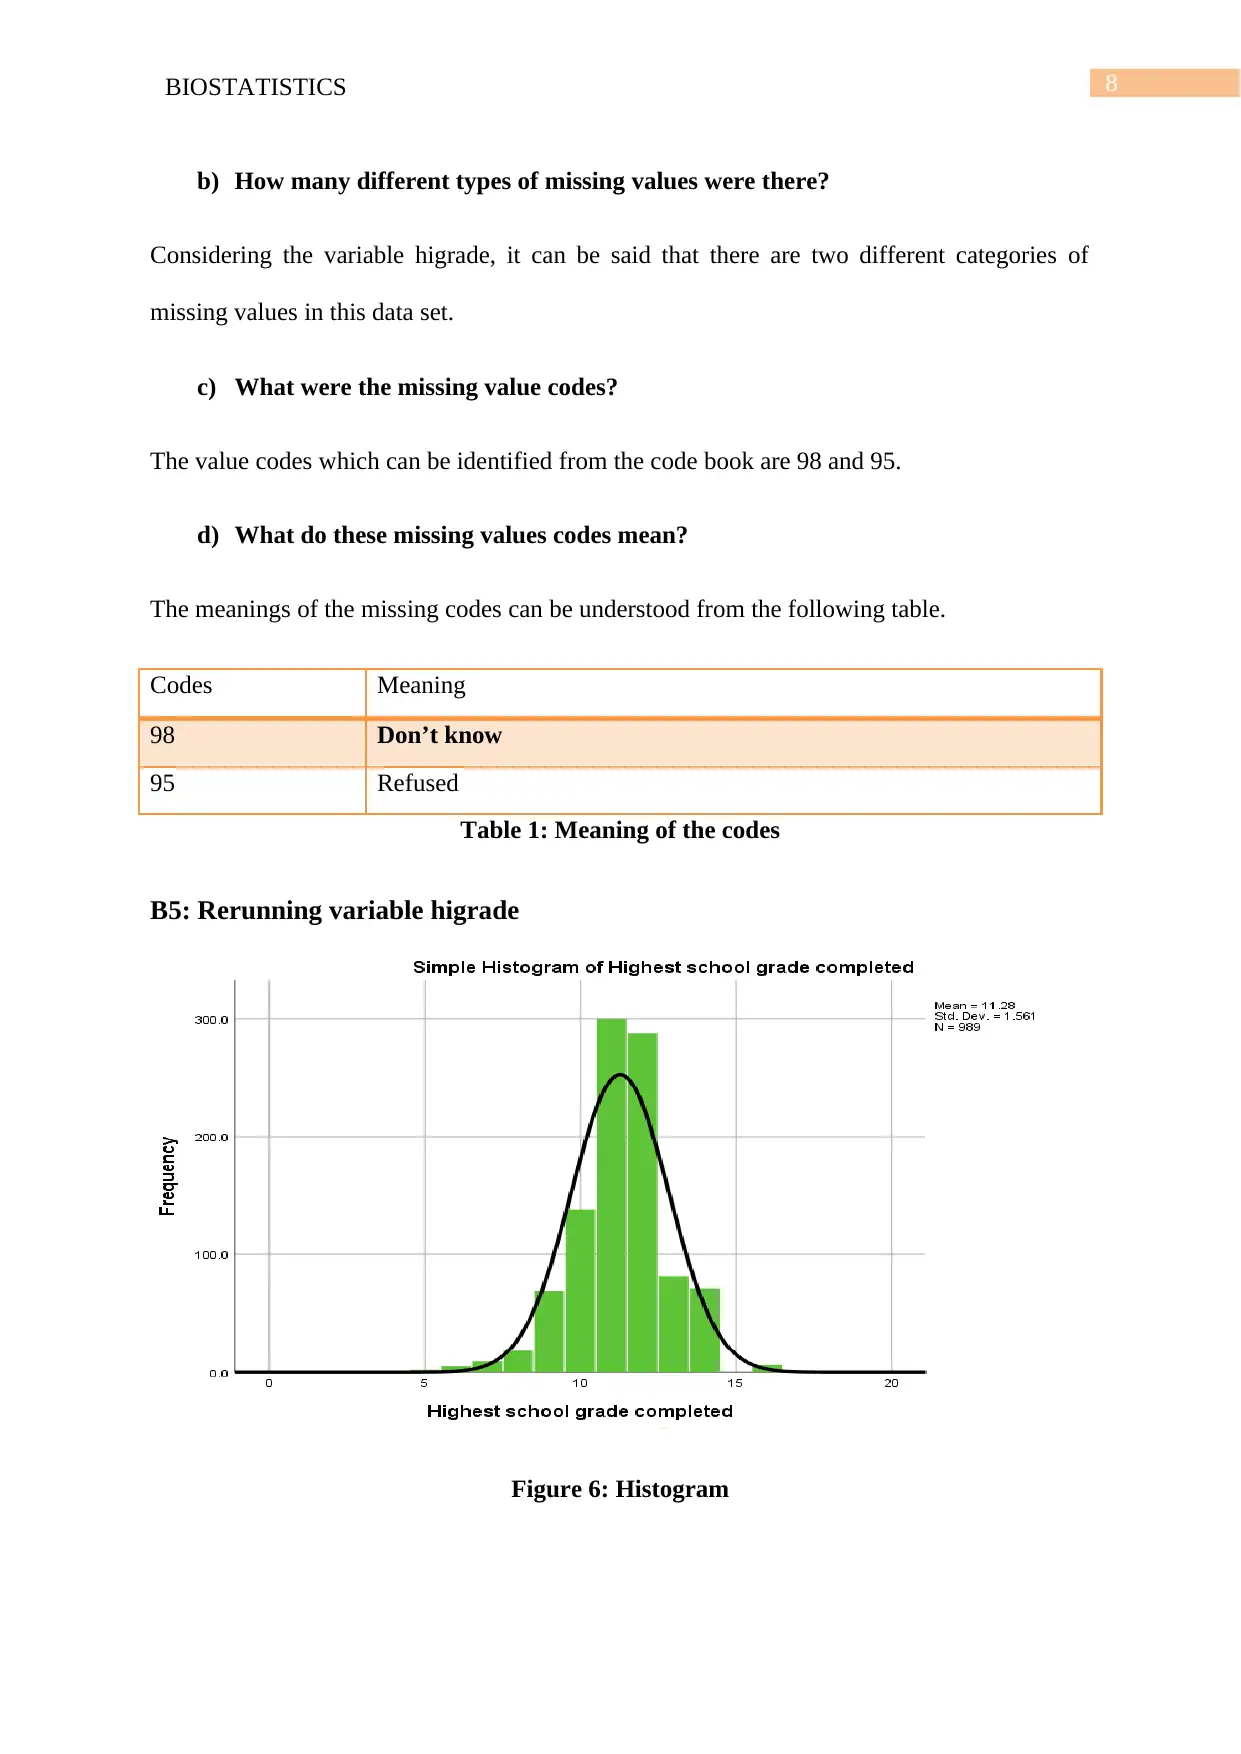
Report
AI Summary
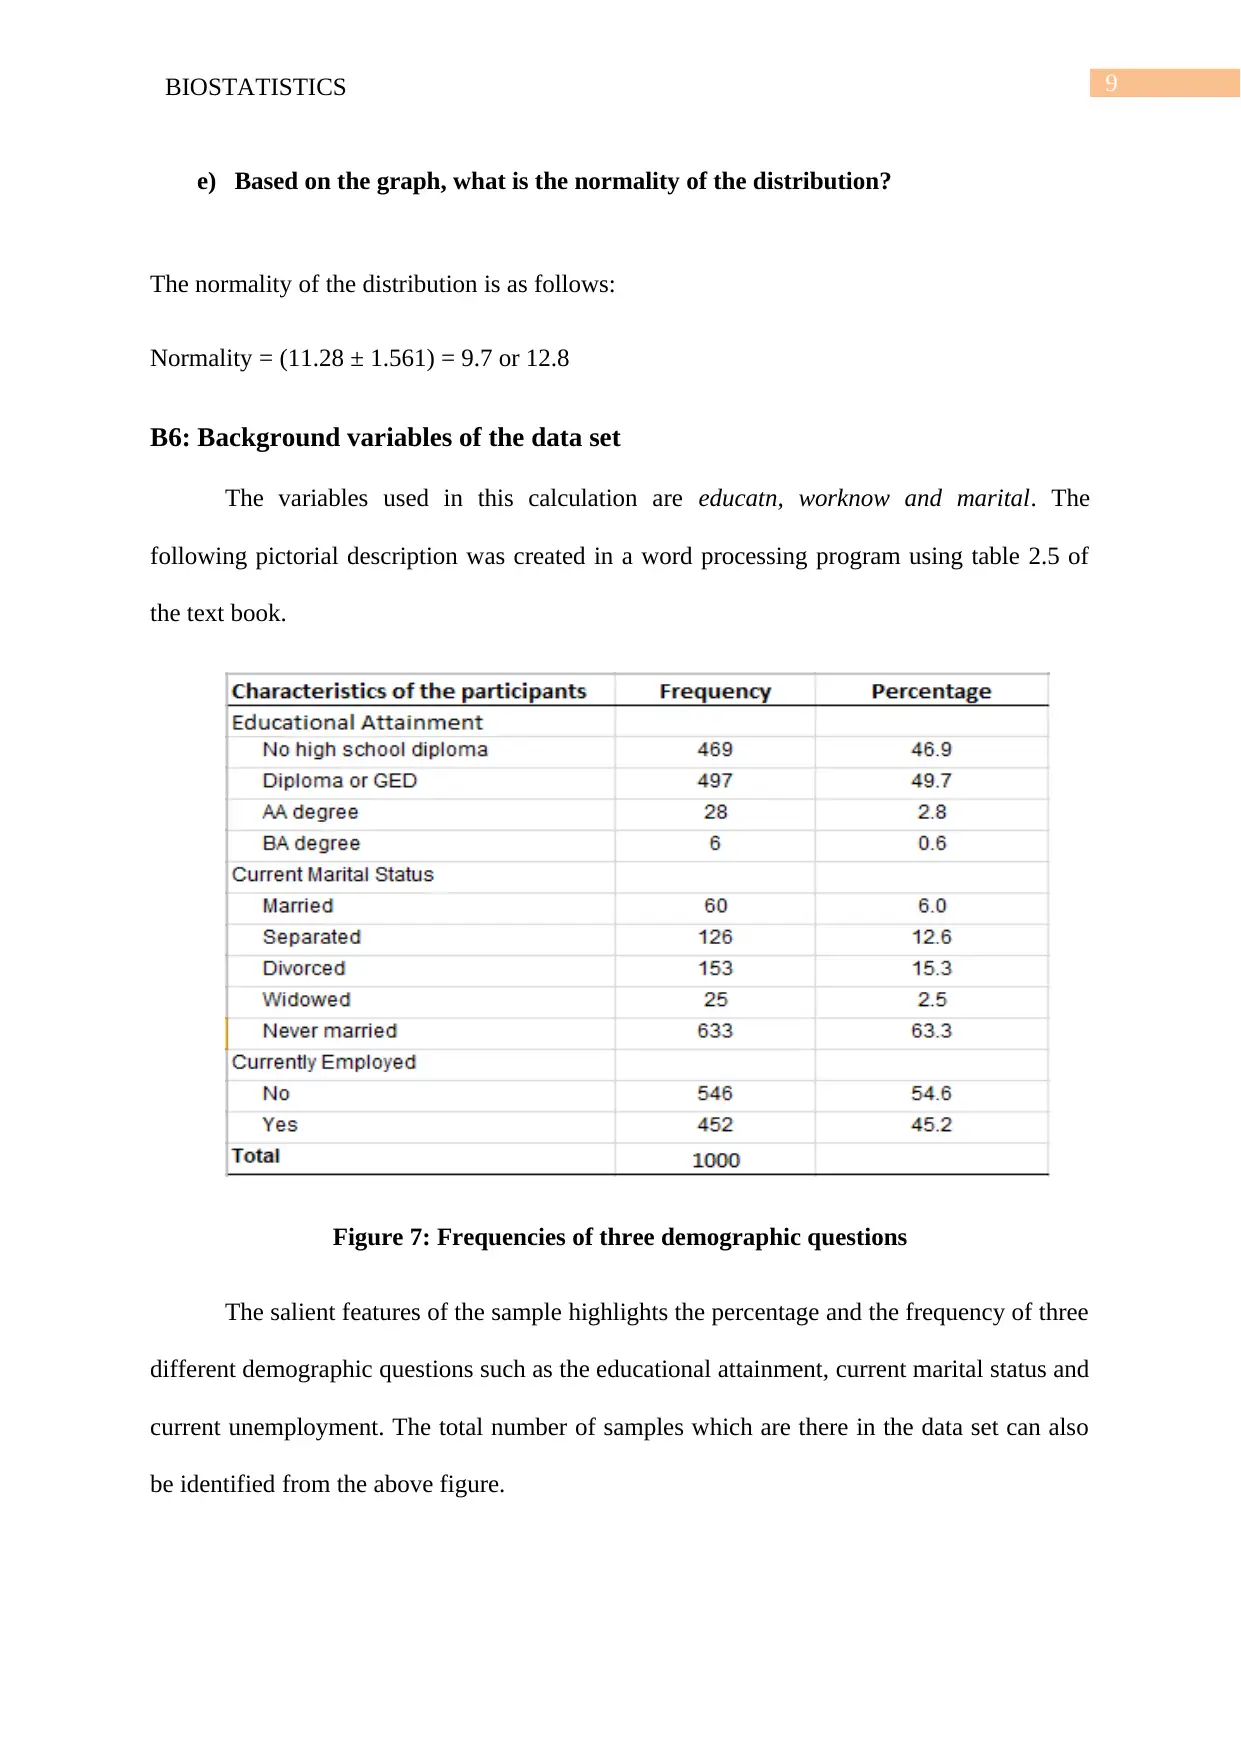
This Biostatistics report presents an analysis of a given dataset, focusing on frequency tables, histograms, and data distributions. The report begins with an examination of a frequency table, calculating the sample size and percentages related to falls in nursing home residents. It then explores the superimposition of a normal distribution on a histogram, describing the shape of the frequency distribution. Part B delves into specific variables, comparing tables and graphs, and analyzing variables like 'racethn' and 'higrade'. The analysis includes calculating percentages, identifying missing values, and interpreting the normality of distributions based on histograms. The report concludes with an examination of background variables, using frequency tables to illustrate demographic information such as education, marital status, and employment. The report also provides a bibliography of relevant sources.

1 out of 12


Your All-in-One AI-Powered Toolkit for Academic Success.
+13062052269
info@desklib.com
Available 24*7 on WhatsApp / Email
![[object Object]](/_next/static/media/star-bottom.7253800d.svg)
Copyright © 2020–2026 A2Z Services. All Rights Reserved. Developed and managed by ZUCOL.