Biostatistics Report: Analysis of US Population Data (1999-2010)
VerifiedAdded on 2022/09/11
|6
|407
|50
Report
AI Summary
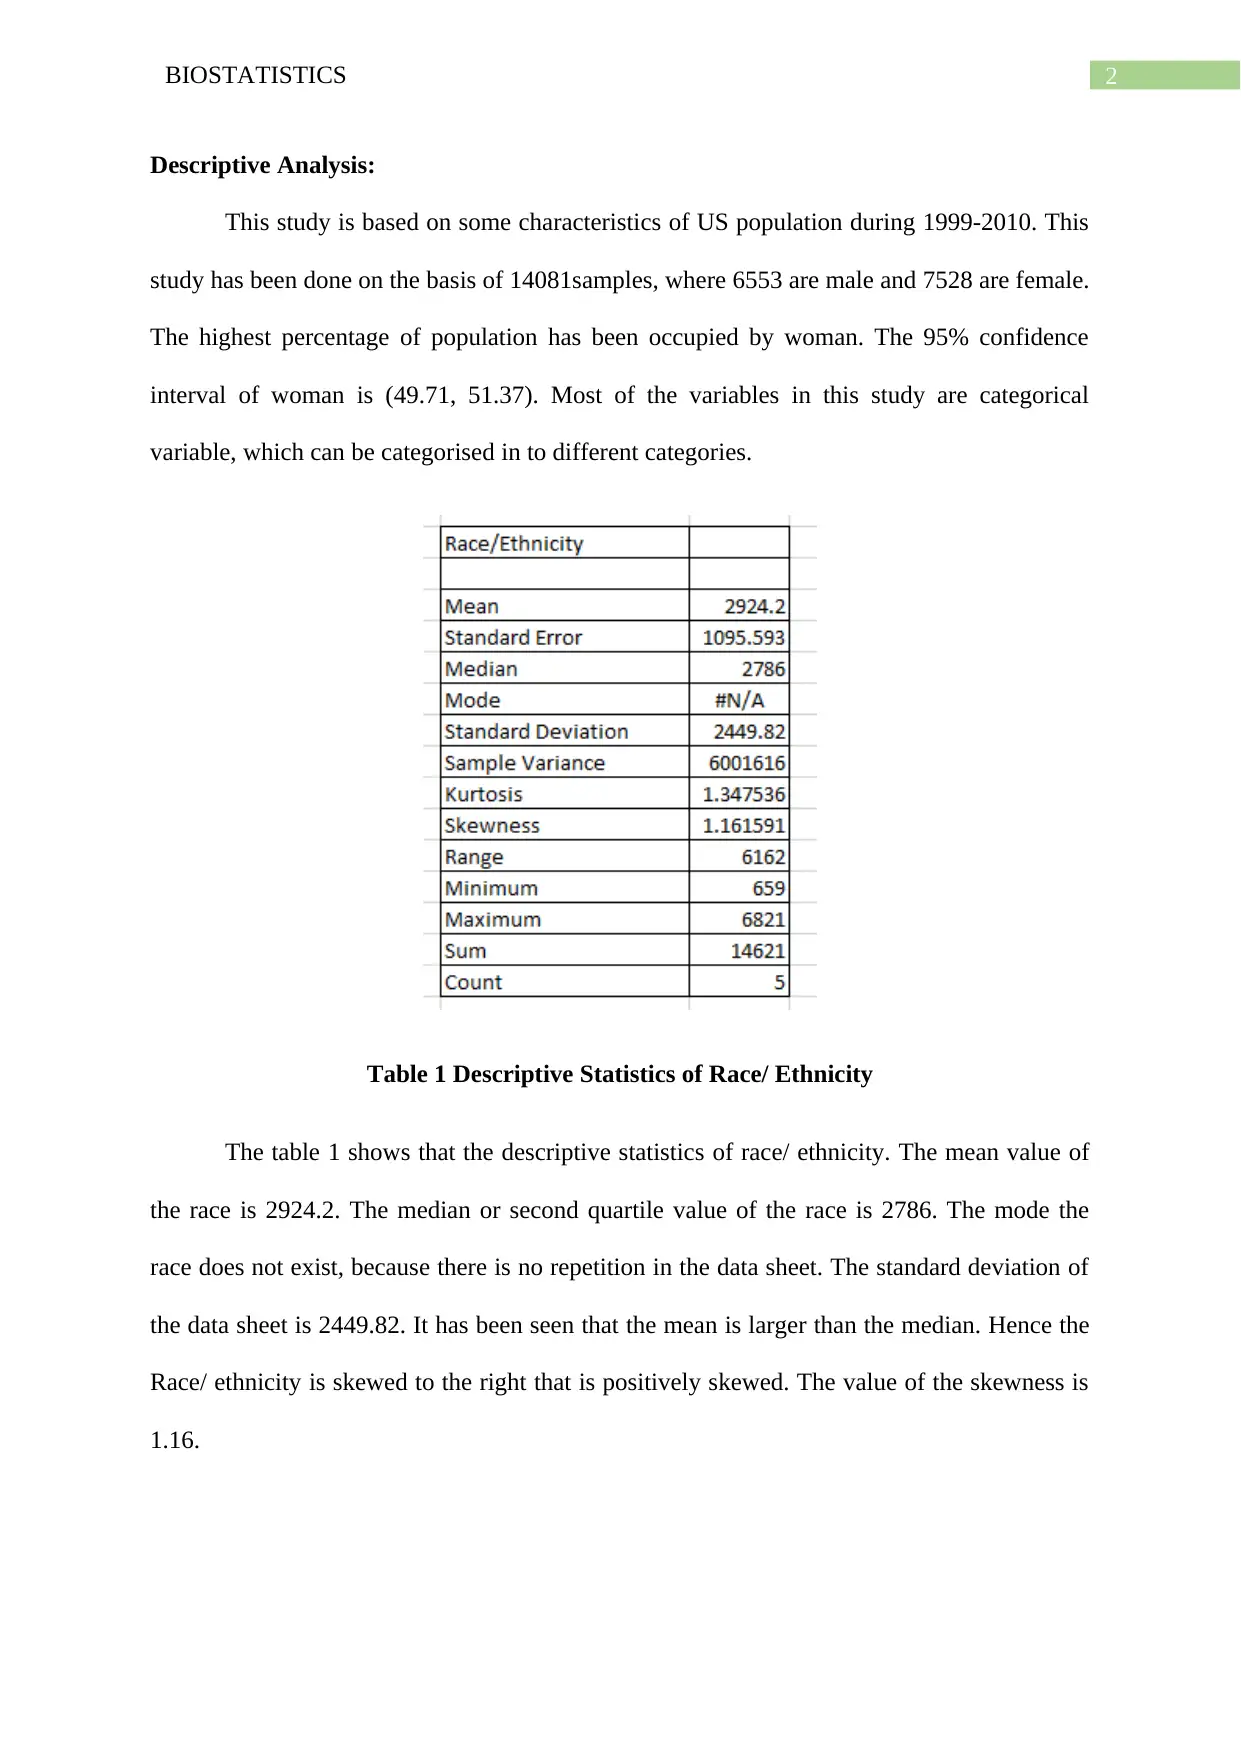
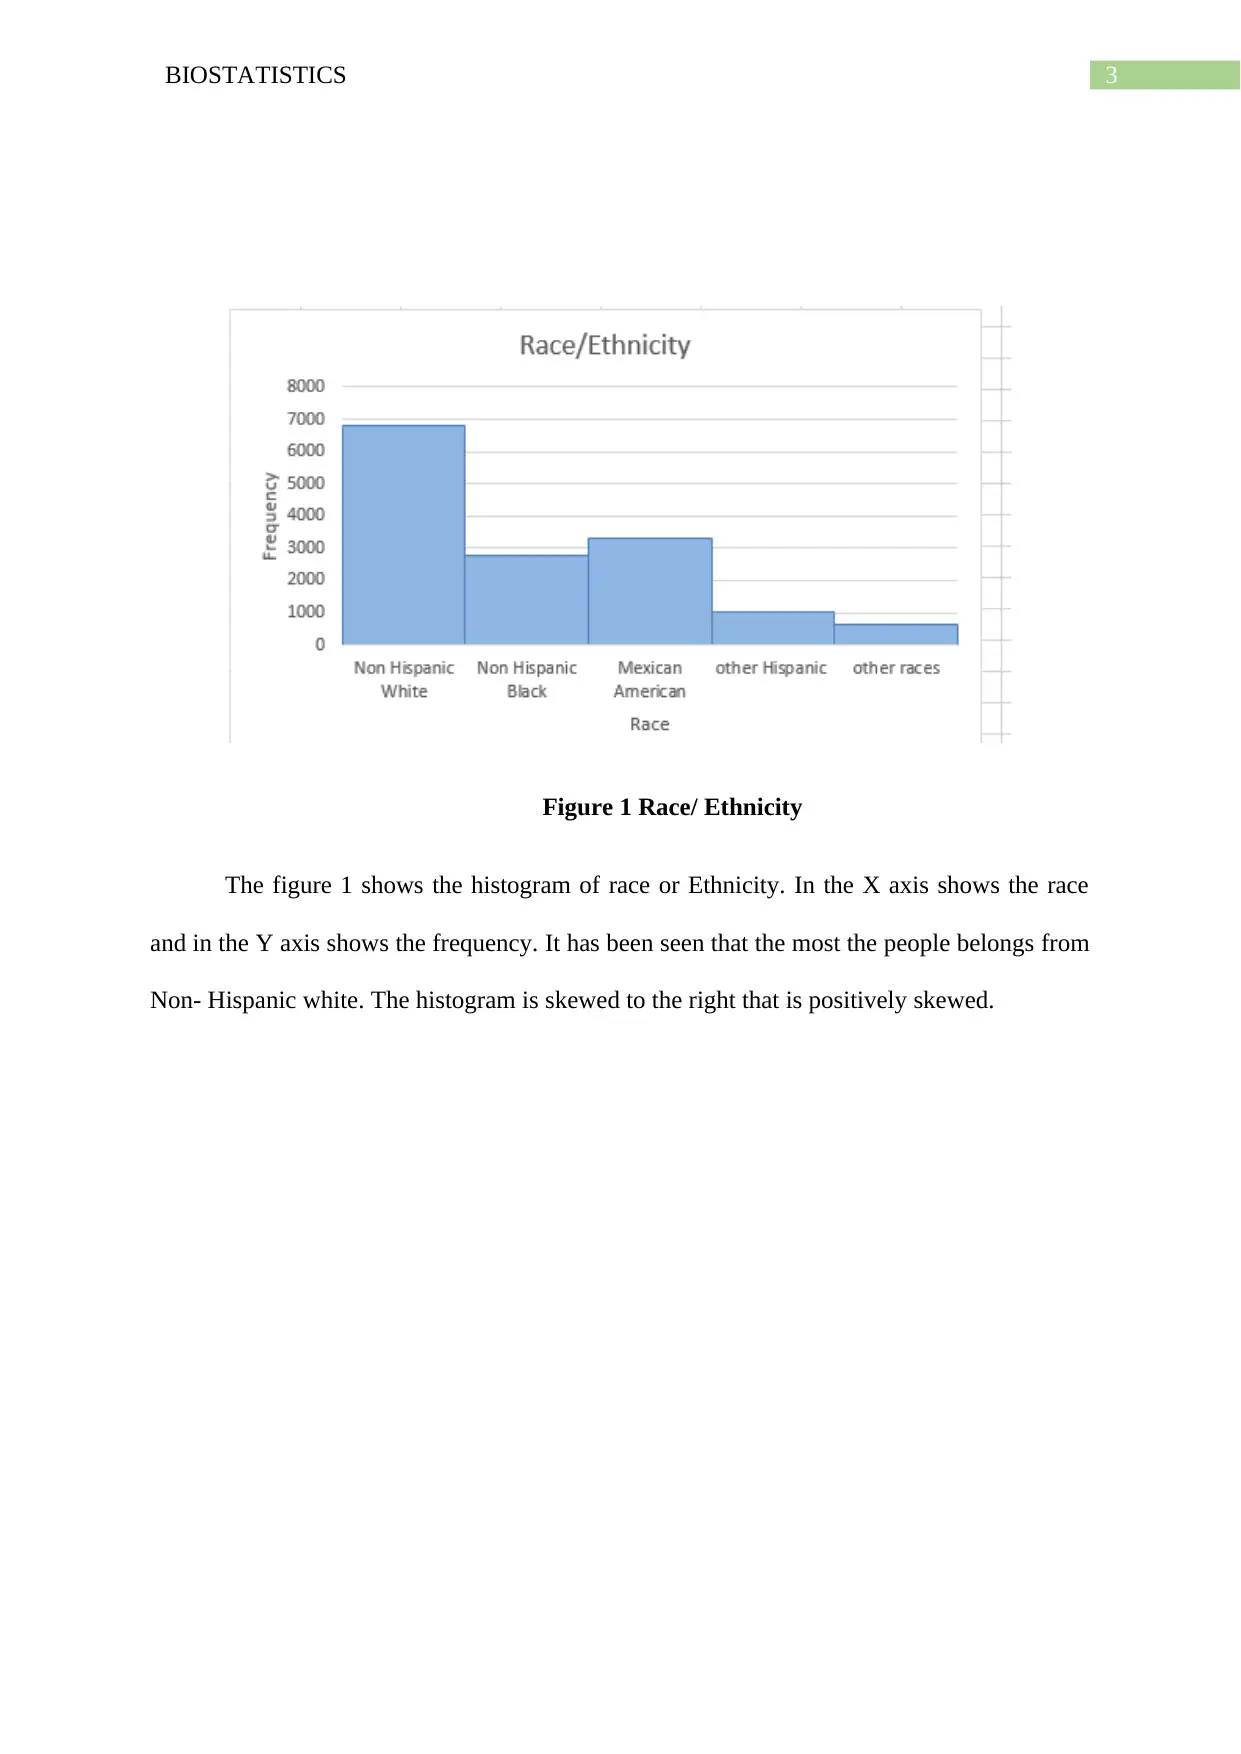
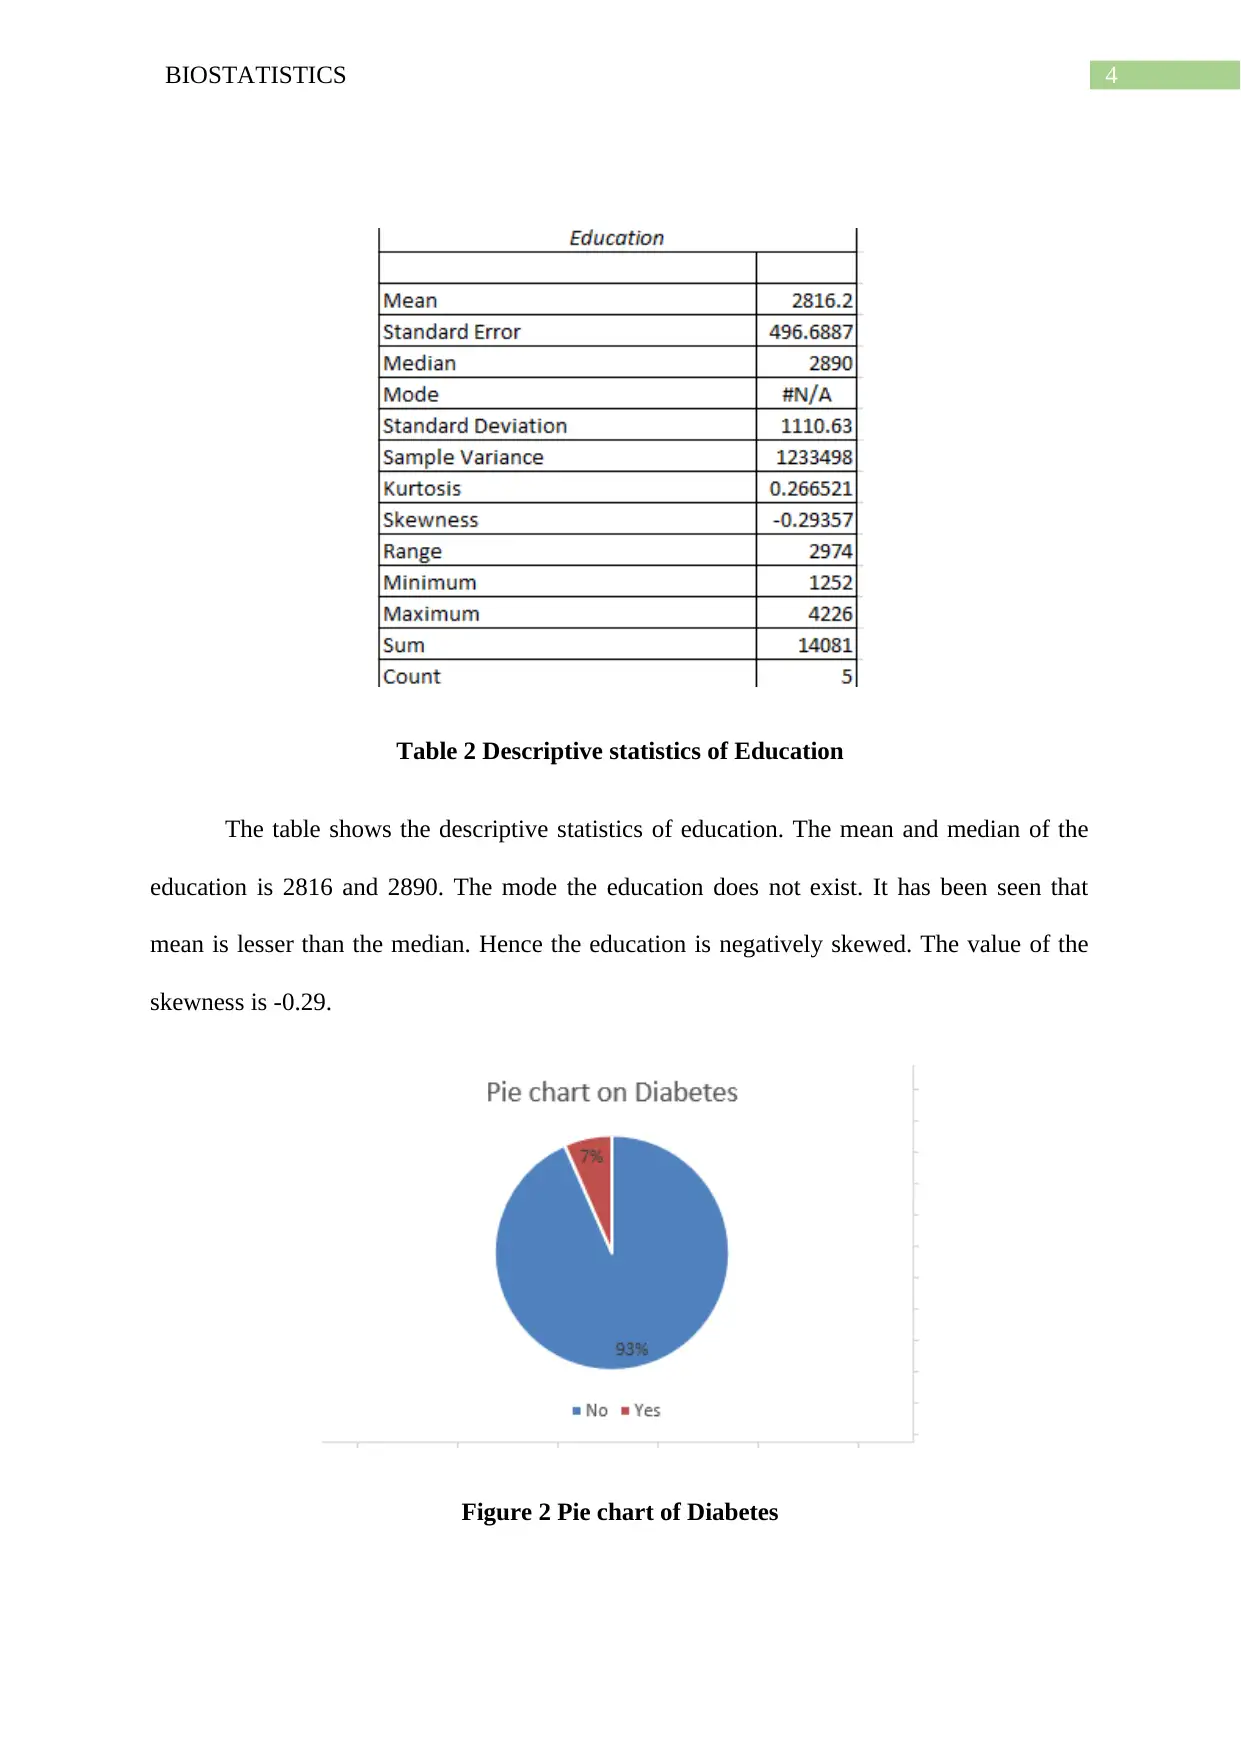
This biostatistics report presents an analysis of US population data from 1999-2010. The study, based on a sample of 14,081 individuals, examines the distribution of various characteristics. The report includes descriptive statistics for race/ethnicity and education, calculating mean, median, and skewness, and visualizing the data with histograms and pie charts. The analysis reveals that the race/ethnicity data is positively skewed, while the education data is negatively skewed. The report also provides an overview of diabetes prevalence within the sample. The report offers valuable insights into the demographic composition and statistical properties of the data.


1 out of 6
Related Documents


Your All-in-One AI-Powered Toolkit for Academic Success.
+13062052269
info@desklib.com
Available 24*7 on WhatsApp / Email
![[object Object]](/_next/static/media/star-bottom.7253800d.svg)
Copyright © 2020–2026 A2Z Services. All Rights Reserved. Developed and managed by ZUCOL.