Introduction to Biostatistics Assignment 2022
Added on 2022-09-29
6 Pages1823 Words29 Views
401077 Introduction to Biostatistics, Spring 2019
Assignment 3
Due Sunday October 27, 2019
“When submitting your assignment to Turnitin you are implicitly ticking these statements:
I retain a backup file of this assignment in case the original file is lost or damaged.
I hereby certify that no part of this assignment or product has been copied from any
other student’s work or from any other source except where due
acknowledgement is made in the assignment.
I hereby certify that no part of this assignment or product has been submitted by me
in another (previous or current) assessment.
I hereby certify that no part of the assignment has been written or produced by any
person.
I hereby certify that no part of this assignment has been made available to any other
student.
I am aware that this work will be reproduced and submitted to plagiarism detection
software for the purpose of detecting possible plagiarism. This software may retain
a copy of this assignment on its database for future plagiarism detection.
I understand that failure to uphold this declaration may result in academic
proceedings in line with the UWS Student Academic Misconduct Policy.”
Your name:
Your student number:
Question 1:
Provide your appraisal of the strengths and weaknesses of the presentation of the statistical
material in Moy et al (2015) against items 10, 12-17 of STROBE (about 400-500 words, 18
marks)
As evident, the study on the predictor of handgrip strength among adults of a rural
community in Malaysia by Moy et al (2015) exhibits both the strengths and weaknesses of
presenting statistical material in reference to STROBE.
STROBE 10: Study size method (pg 173)
The STROBE explains that the method used to determine the number of cases or
respondents in the area of interest should be exhibited in the study. As evident, the study
incorporated 1250 households, which were selected from 5 districts and resulted to 2199
respondents.
STROBE 12: Statistical Methods (pg 174)
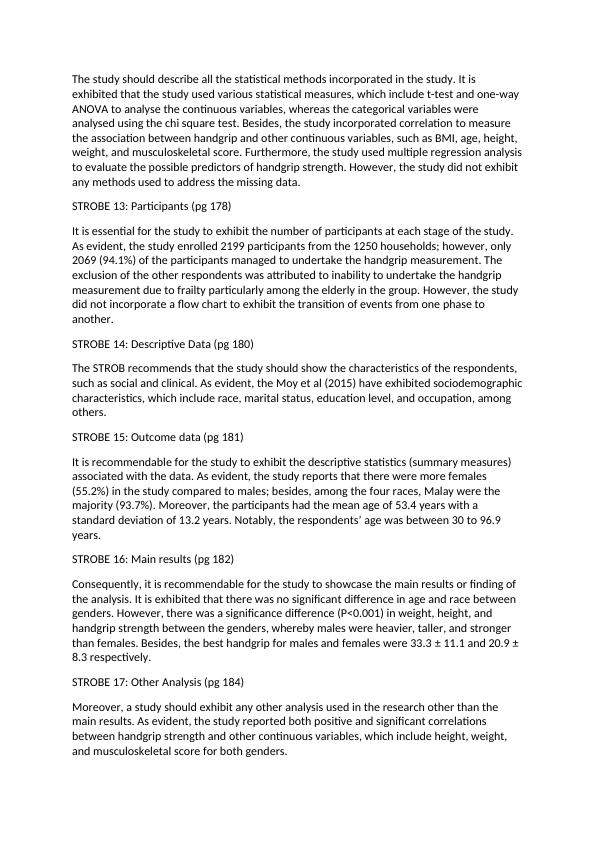
The study should describe all the statistical methods incorporated in the study. It is
exhibited that the study used various statistical measures, which include t-test and one-way
ANOVA to analyse the continuous variables, whereas the categorical variables were
analysed using the chi square test. Besides, the study incorporated correlation to measure
the association between handgrip and other continuous variables, such as BMI, age, height,
weight, and musculoskeletal score. Furthermore, the study used multiple regression analysis
to evaluate the possible predictors of handgrip strength. However, the study did not exhibit
any methods used to address the missing data.
STROBE 13: Participants (pg 178)
It is essential for the study to exhibit the number of participants at each stage of the study.
As evident, the study enrolled 2199 participants from the 1250 households; however, only
2069 (94.1%) of the participants managed to undertake the handgrip measurement. The
exclusion of the other respondents was attributed to inability to undertake the handgrip
measurement due to frailty particularly among the elderly in the group. However, the study
did not incorporate a flow chart to exhibit the transition of events from one phase to
another.
STROBE 14: Descriptive Data (pg 180)
The STROB recommends that the study should show the characteristics of the respondents,
such as social and clinical. As evident, the Moy et al (2015) have exhibited sociodemographic
characteristics, which include race, marital status, education level, and occupation, among
others.
STROBE 15: Outcome data (pg 181)
It is recommendable for the study to exhibit the descriptive statistics (summary measures)
associated with the data. As evident, the study reports that there were more females
(55.2%) in the study compared to males; besides, among the four races, Malay were the
majority (93.7%). Moreover, the participants had the mean age of 53.4 years with a
standard deviation of 13.2 years. Notably, the respondents’ age was between 30 to 96.9
years.
STROBE 16: Main results (pg 182)
Consequently, it is recommendable for the study to showcase the main results or finding of
the analysis. It is exhibited that there was no significant difference in age and race between
genders. However, there was a significance difference (P<0.001) in weight, height, and
handgrip strength between the genders, whereby males were heavier, taller, and stronger
than females. Besides, the best handgrip for males and females were 33.3 ± 11.1 and 20.9 ±
8.3 respectively.
STROBE 17: Other Analysis (pg 184)
Moreover, a study should exhibit any other analysis used in the research other than the
main results. As evident, the study reported both positive and significant correlations
between handgrip strength and other continuous variables, which include height, weight,
and musculoskeletal score for both genders.
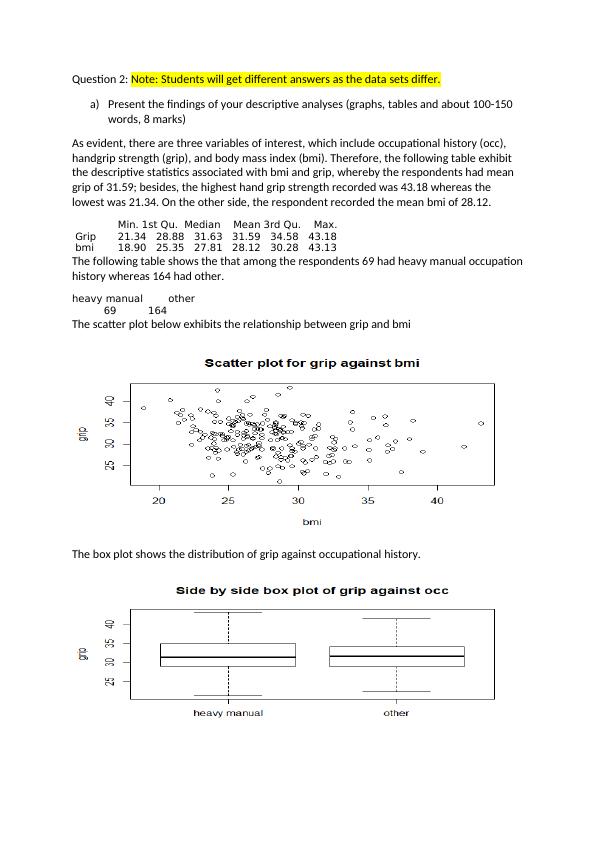
Question 2: Note: Students will get different answers as the data sets differ.
a) Present the findings of your descriptive analyses (graphs, tables and about 100-150
words, 8 marks)
As evident, there are three variables of interest, which include occupational history (occ),
handgrip strength (grip), and body mass index (bmi). Therefore, the following table exhibit
the descriptive statistics associated with bmi and grip, whereby the respondents had mean
grip of 31.59; besides, the highest hand grip strength recorded was 43.18 whereas the
lowest was 21.34. On the other side, the respondent recorded the mean bmi of 28.12.
Min. 1st Qu. Median Mean 3rd Qu. Max.
Grip 21.34 28.88 31.63 31.59 34.58 43.18
bmi 18.90 25.35 27.81 28.12 30.28 43.13
The following table shows the that among the respondents 69 had heavy manual occupation
history whereas 164 had other.
heavy manual other
69 164
The scatter plot below exhibits the relationship between grip and bmi
The box plot shows the distribution of grip against occupational history.
End of preview
Want to access all the pages? Upload your documents or become a member.
Related Documents
Analysis of Hazardous Alcohol Consumption Among University Students in Irelandlg...
|9
|1651
|446
401077 Introduction to Biostatistics, Autumn Assignment 1lg...
|10
|1229
|15
Explanation of Command Verbs in Assessment Criterialg...
|3
|543
|81