Business Innovative and Skills Data Analysis Report: Findings
VerifiedAdded on 2023/01/11
|24
|3599
|86
Report
AI Summary
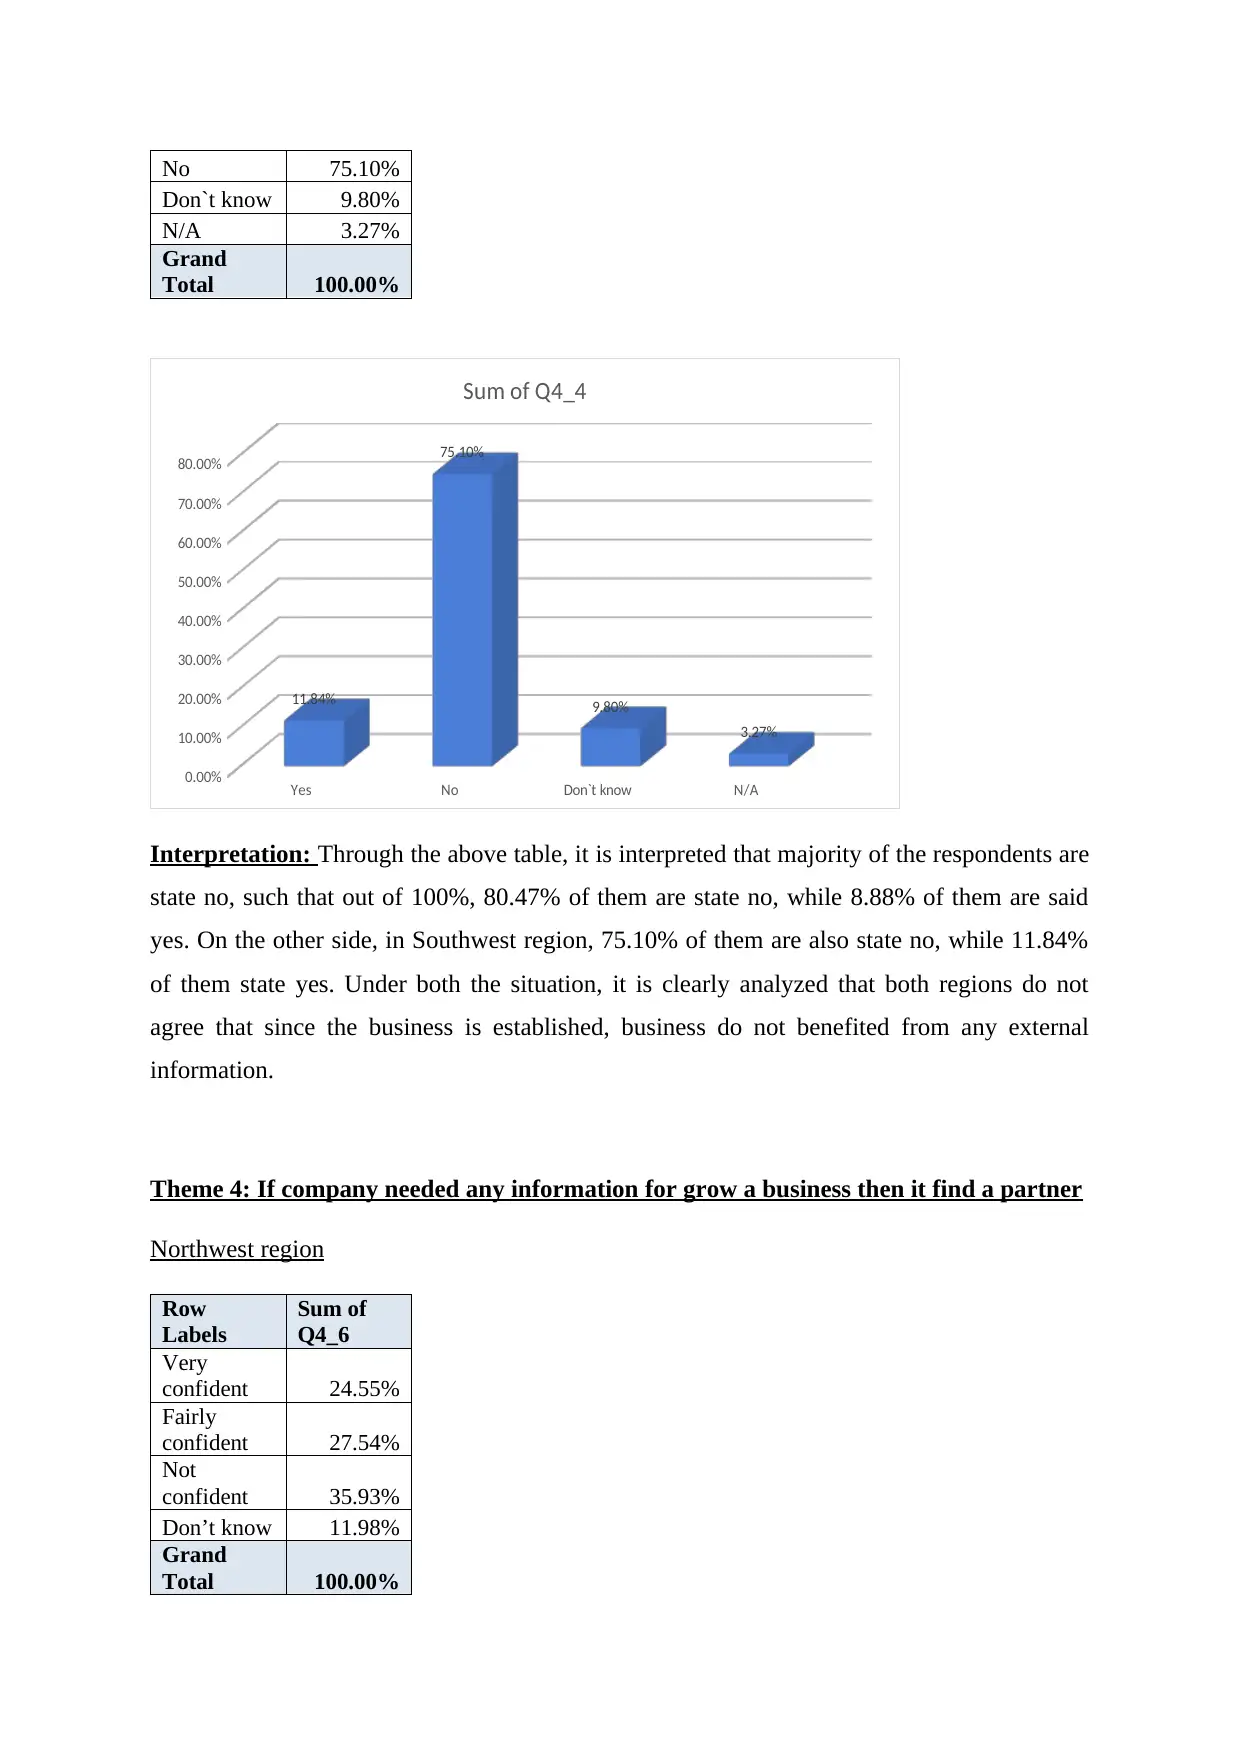
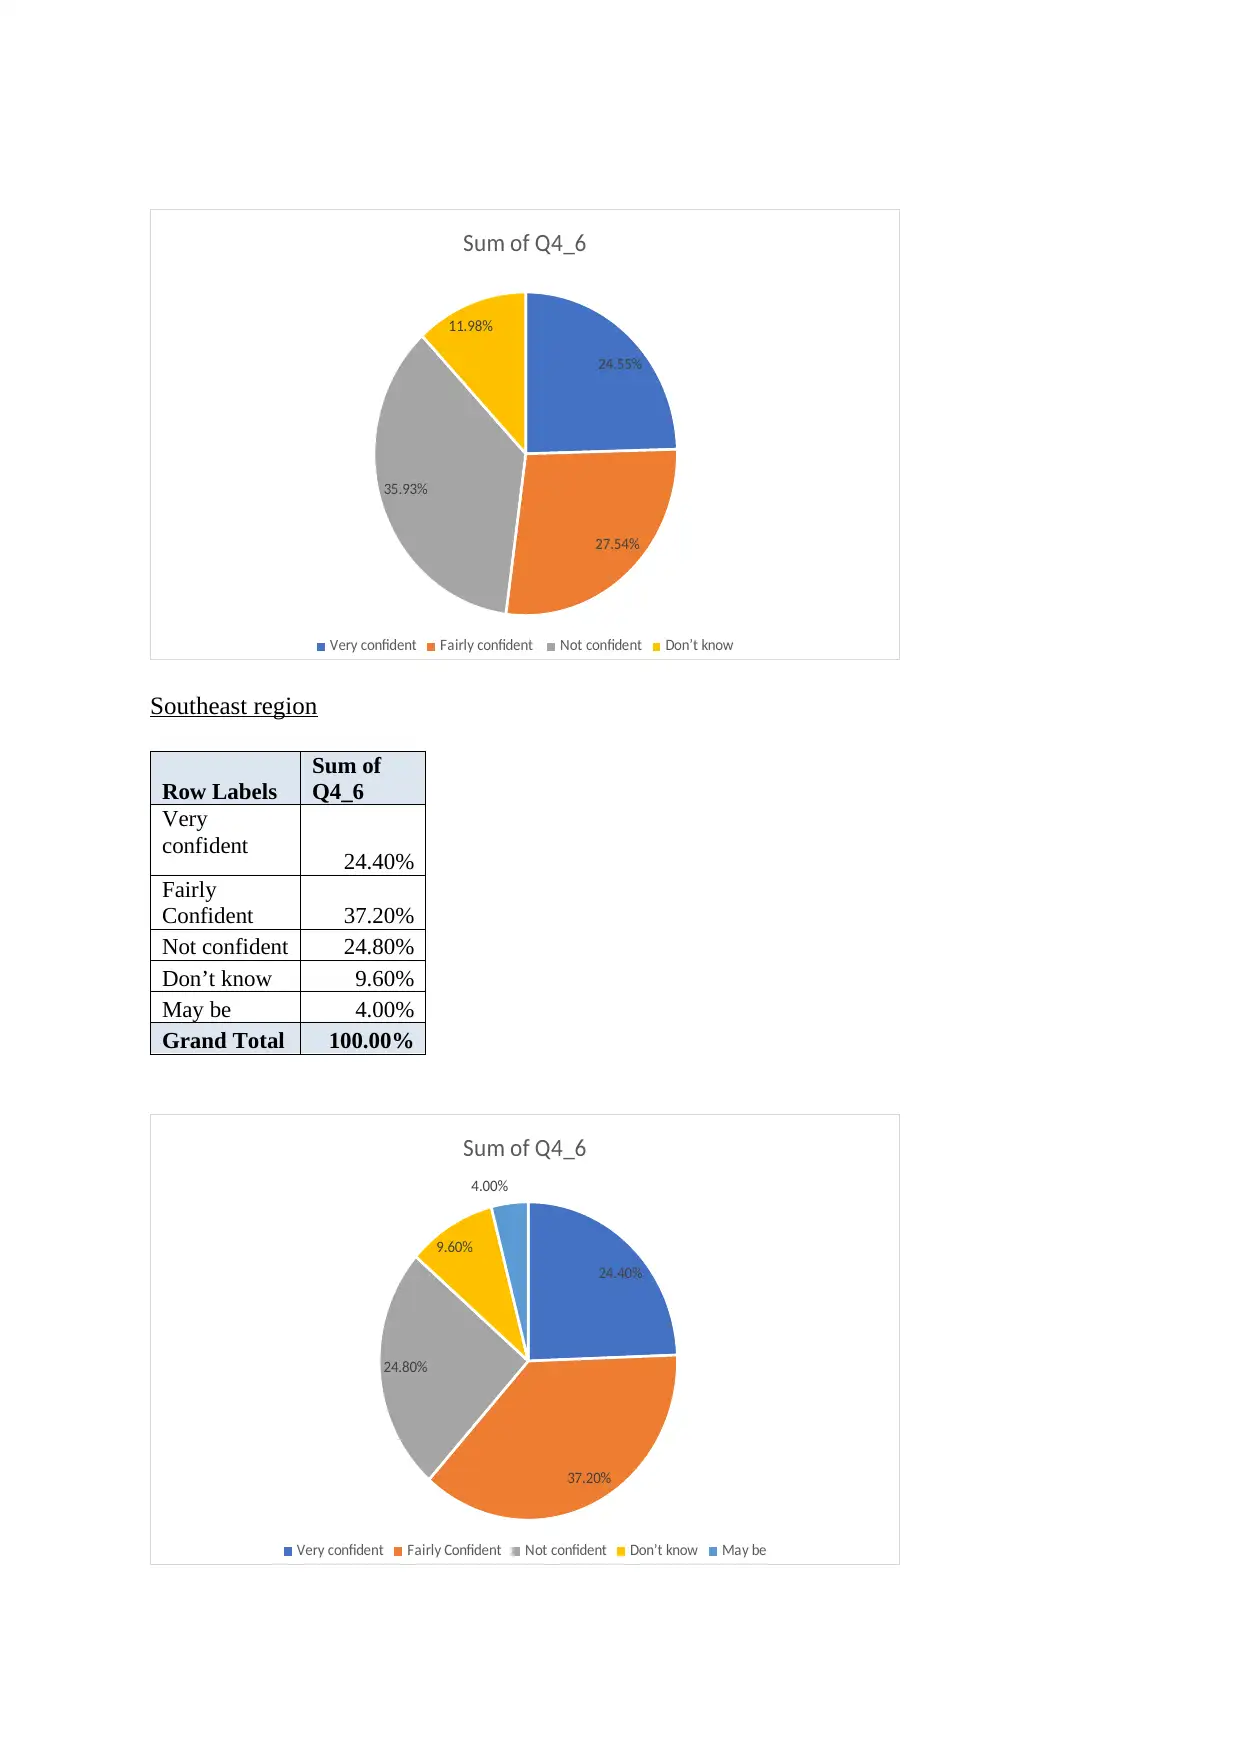
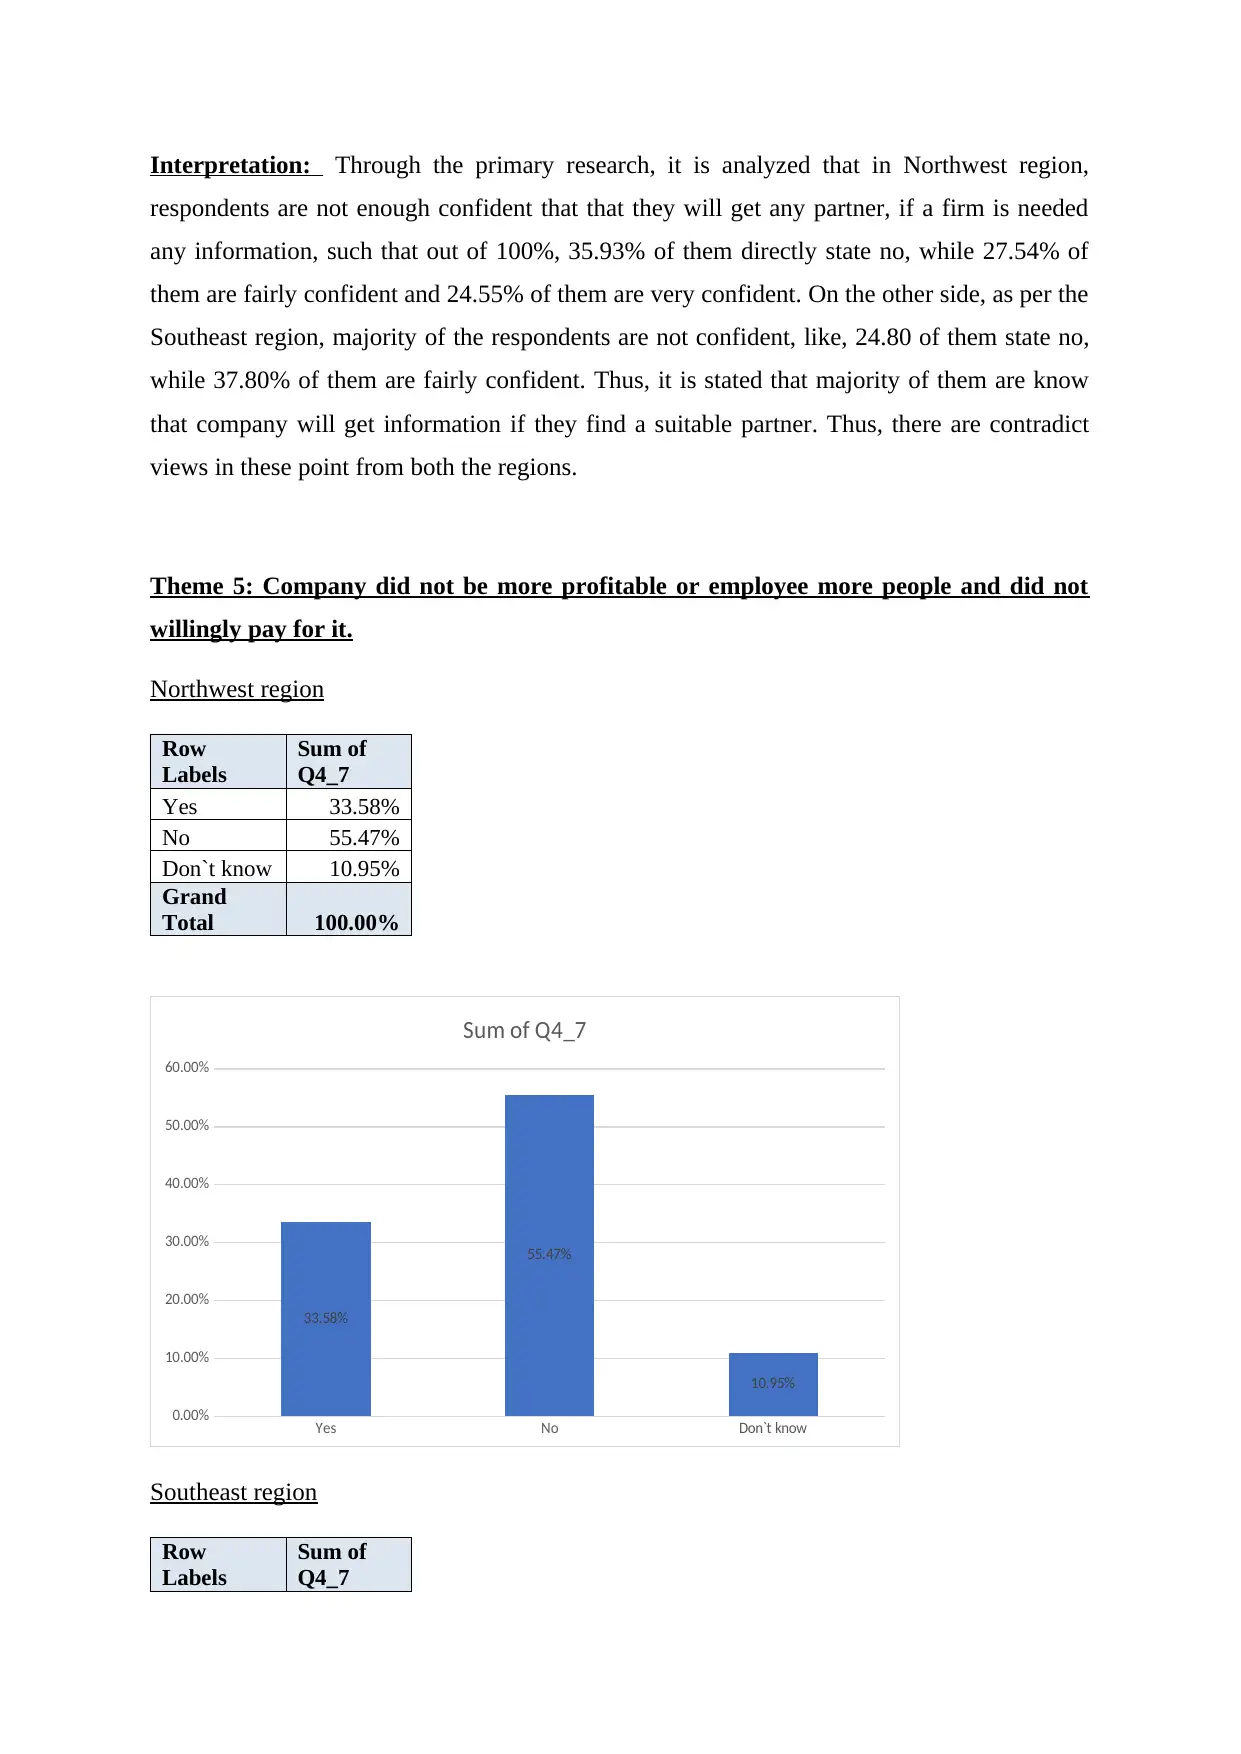
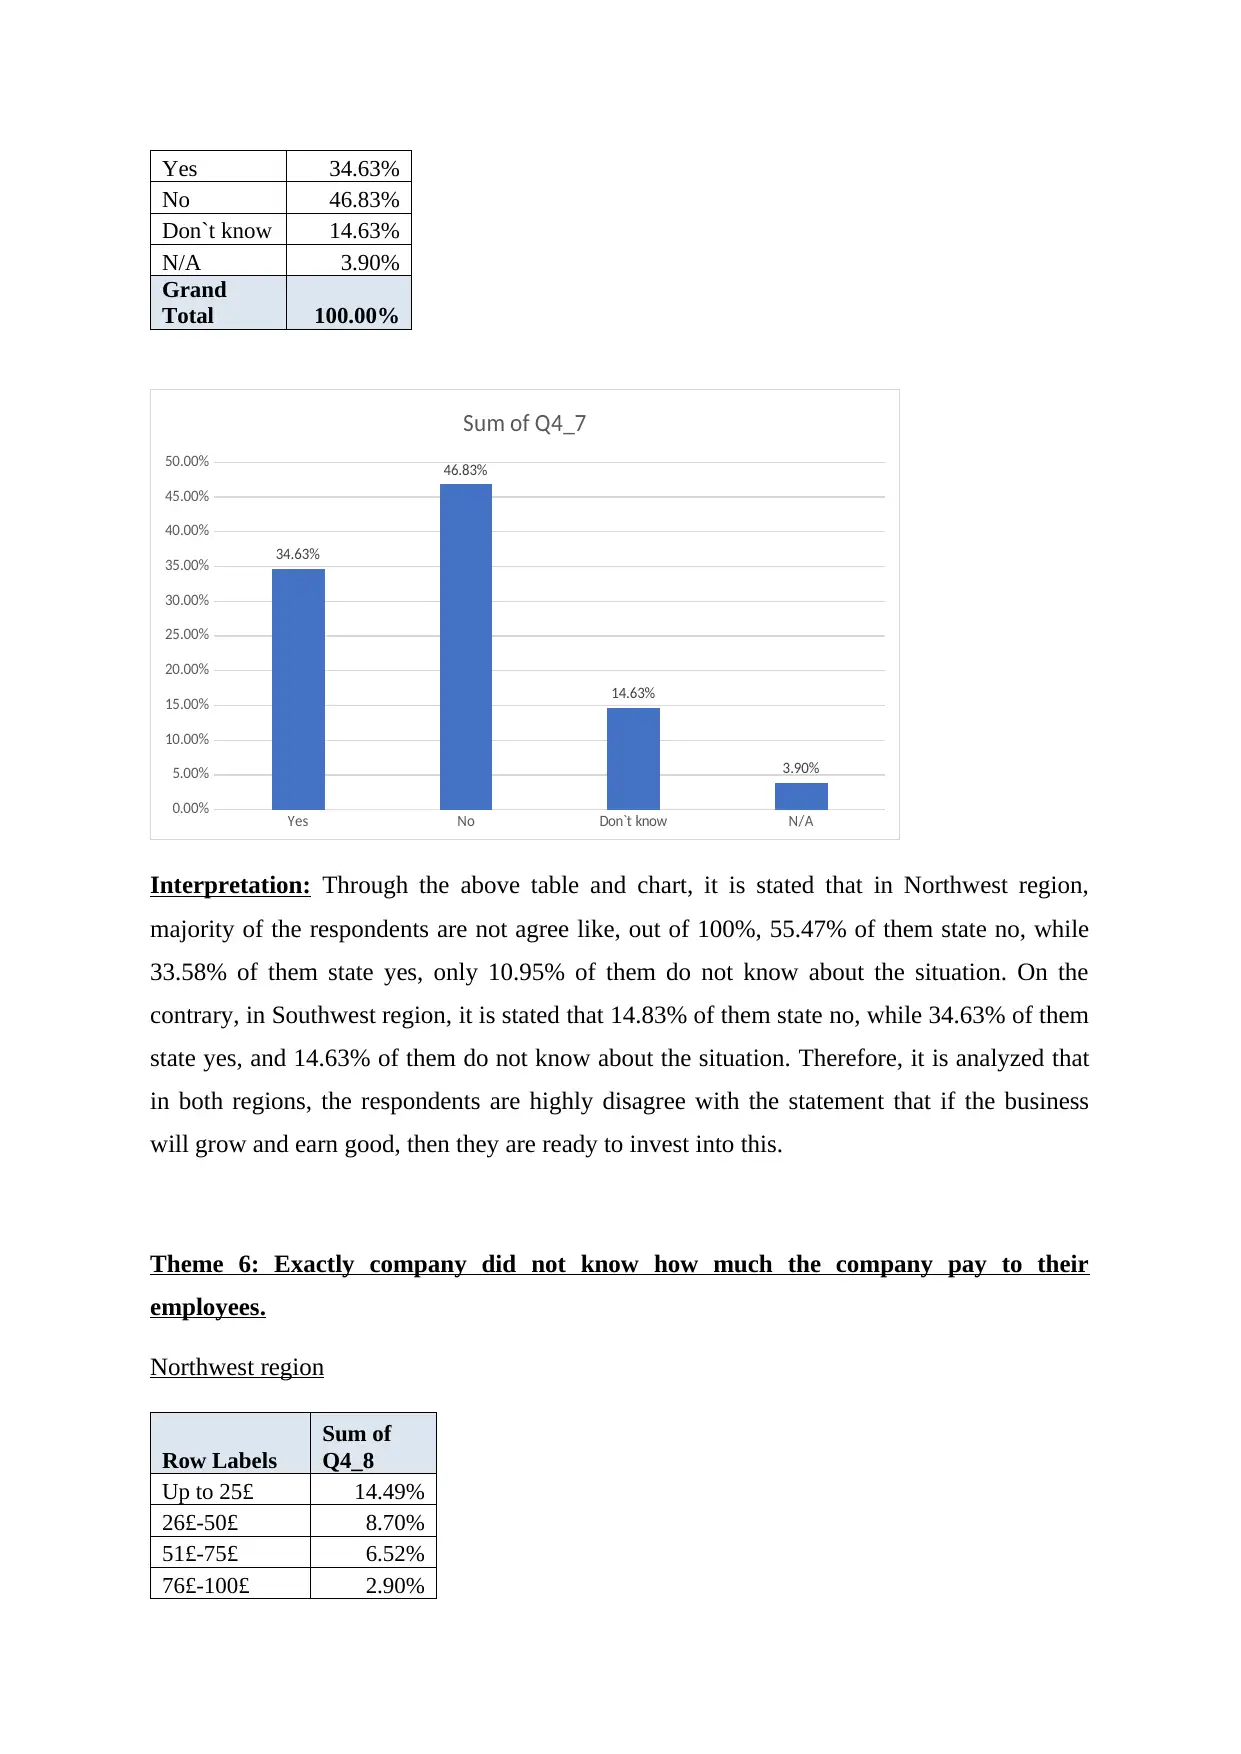
This report presents an analysis of Business Innovative and Skills (BIS) data, focusing on the fintech sector and business growth across two regions: Northwest and Southeast. The analysis explores themes such as the need for external assistance, strategic advice, and the impact of external information on business success. The report utilizes tables and charts to interpret respondent views on various aspects, including the confidence in finding business partners, employee salaries, and the benefits of independent business reviews. Key findings indicate that respondents often do not see value in external assistance or strategic advice, and there are differing views on company growth and employee compensation. The report examines the main objectives of businesses and assesses growth over the past three years, highlighting regional variations in business performance. The analysis offers crucial insights into the challenges and opportunities facing businesses in the fintech landscape.


1 out of 24
Your All-in-One AI-Powered Toolkit for Academic Success.
+13062052269
info@desklib.com
Available 24*7 on WhatsApp / Email
![[object Object]](/_next/static/media/star-bottom.7253800d.svg)
Copyright © 2020–2026 A2Z Services. All Rights Reserved. Developed and managed by ZUCOL.