BIS Data Analysis Report: Regional Business Insights
VerifiedAdded on 2023/01/11
|21
|3534
|83
Report
AI Summary
This report presents an analysis of business data collected through a BIS survey, focusing on regional trends and insights. The analysis covers various aspects, including the utilization of external assistance for day-to-day operations and strategic advice, the primary objectives of businesses over the next three years, and the actual growth experienced over the past three years. The report also examines business turnover rates and provides interpretations of the data, comparing results from the South East and North West regions. Key findings include the reluctance of businesses to seek external help for daily operations, the varying levels of interest in external strategic advice, and the primary focus on business growth as a key objective. The report offers a comprehensive overview of the current business landscape, offering valuable insights into the challenges and opportunities faced by businesses in different regions.
BIS data analysis
Secure Best Marks with AI Grader
Need help grading? Try our AI Grader for instant feedback on your assignments.
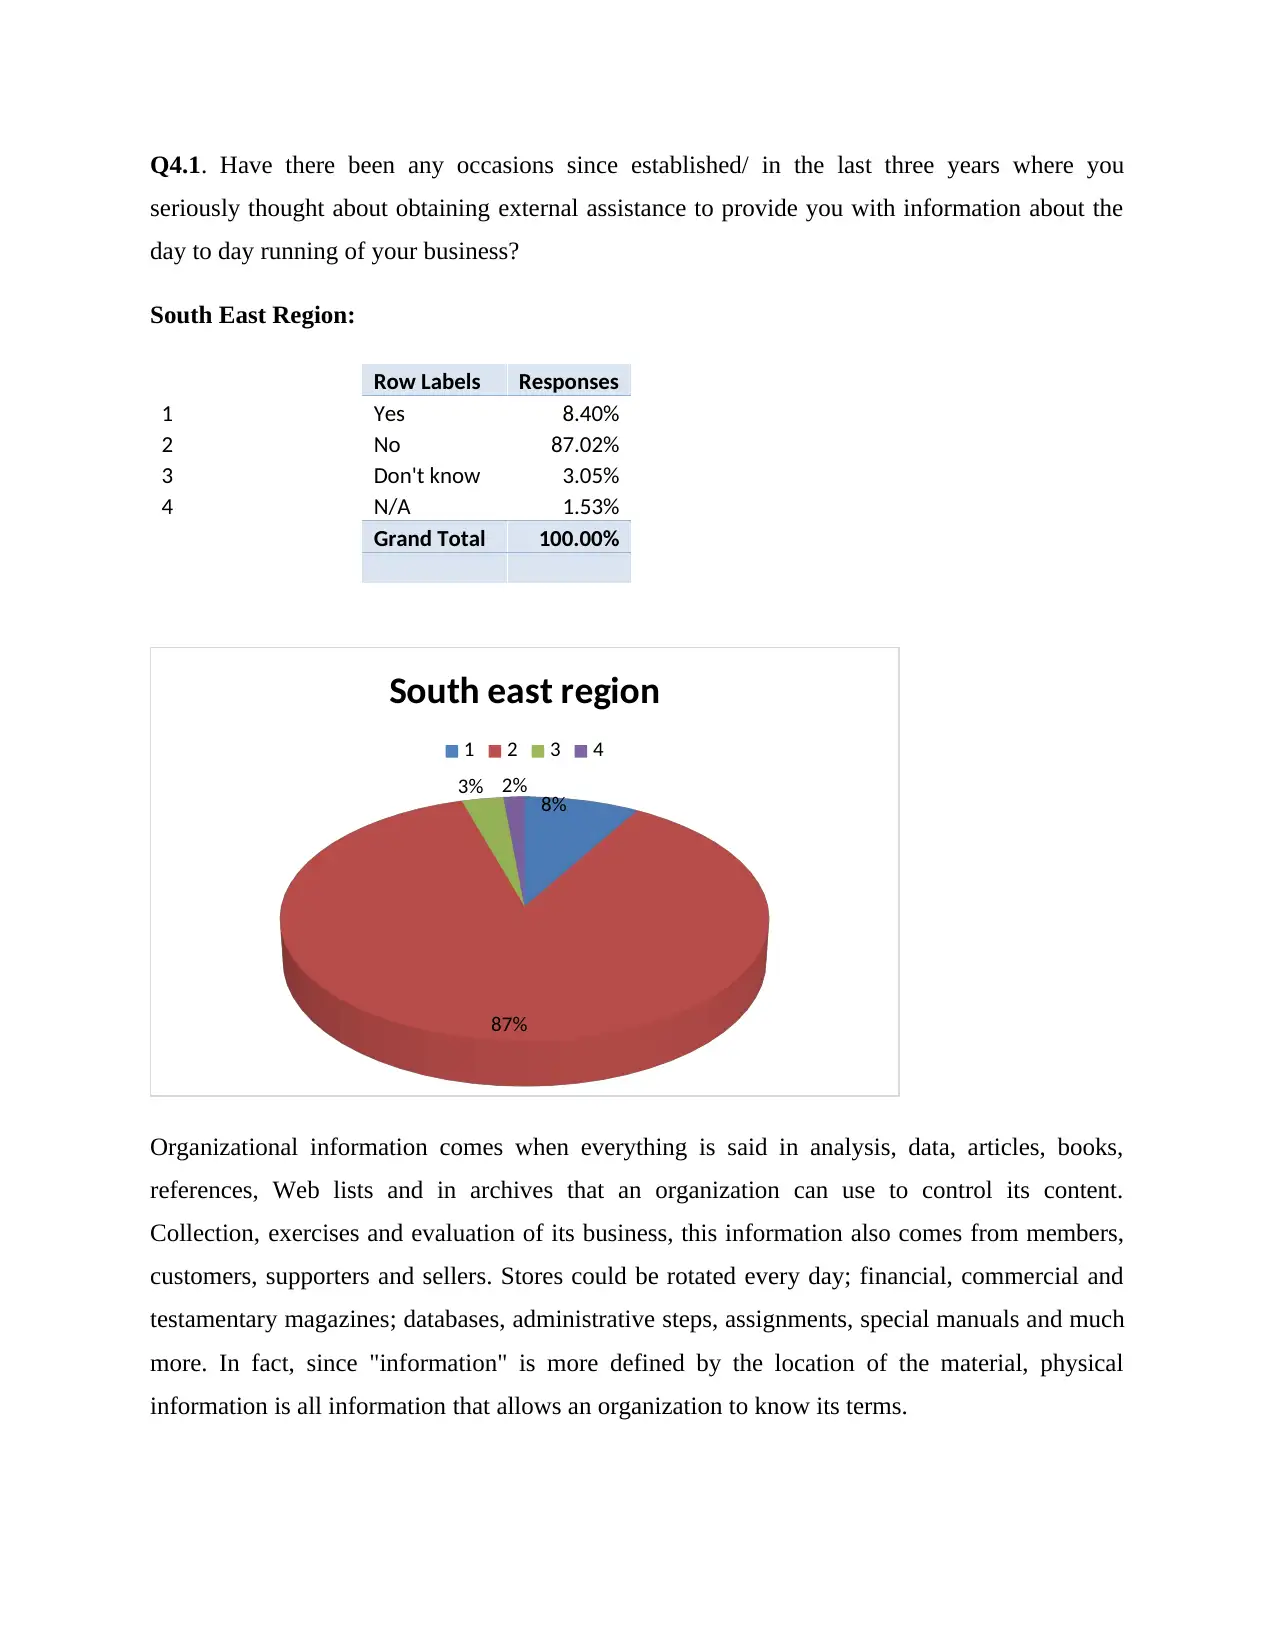
Q4.1. Have there been any occasions since established/ in the last three years where you
seriously thought about obtaining external assistance to provide you with information about the
day to day running of your business?
South East Region:
Row Labels Responses
1 Yes 8.40%
2 No 87.02%
3 Don't know 3.05%
4 N/A 1.53%
Grand Total 100.00%
8%
87%
3% 2%
South east region
1 2 3 4
Organizational information comes when everything is said in analysis, data, articles, books,
references, Web lists and in archives that an organization can use to control its content.
Collection, exercises and evaluation of its business, this information also comes from members,
customers, supporters and sellers. Stores could be rotated every day; financial, commercial and
testamentary magazines; databases, administrative steps, assignments, special manuals and much
more. In fact, since "information" is more defined by the location of the material, physical
information is all information that allows an organization to know its terms.
Interpretation: The study is linked to the use of external or external assistance to collect the
organization’s operational data. The above result shows that 87.02% of businessmen were not
taken care of to get outside help to provide them with data on the day-to-day management of
their business. Only 8.40% of business people are keen to gather data from outside or from
organizations. Almost any businessman would prefer not to share their ideas.
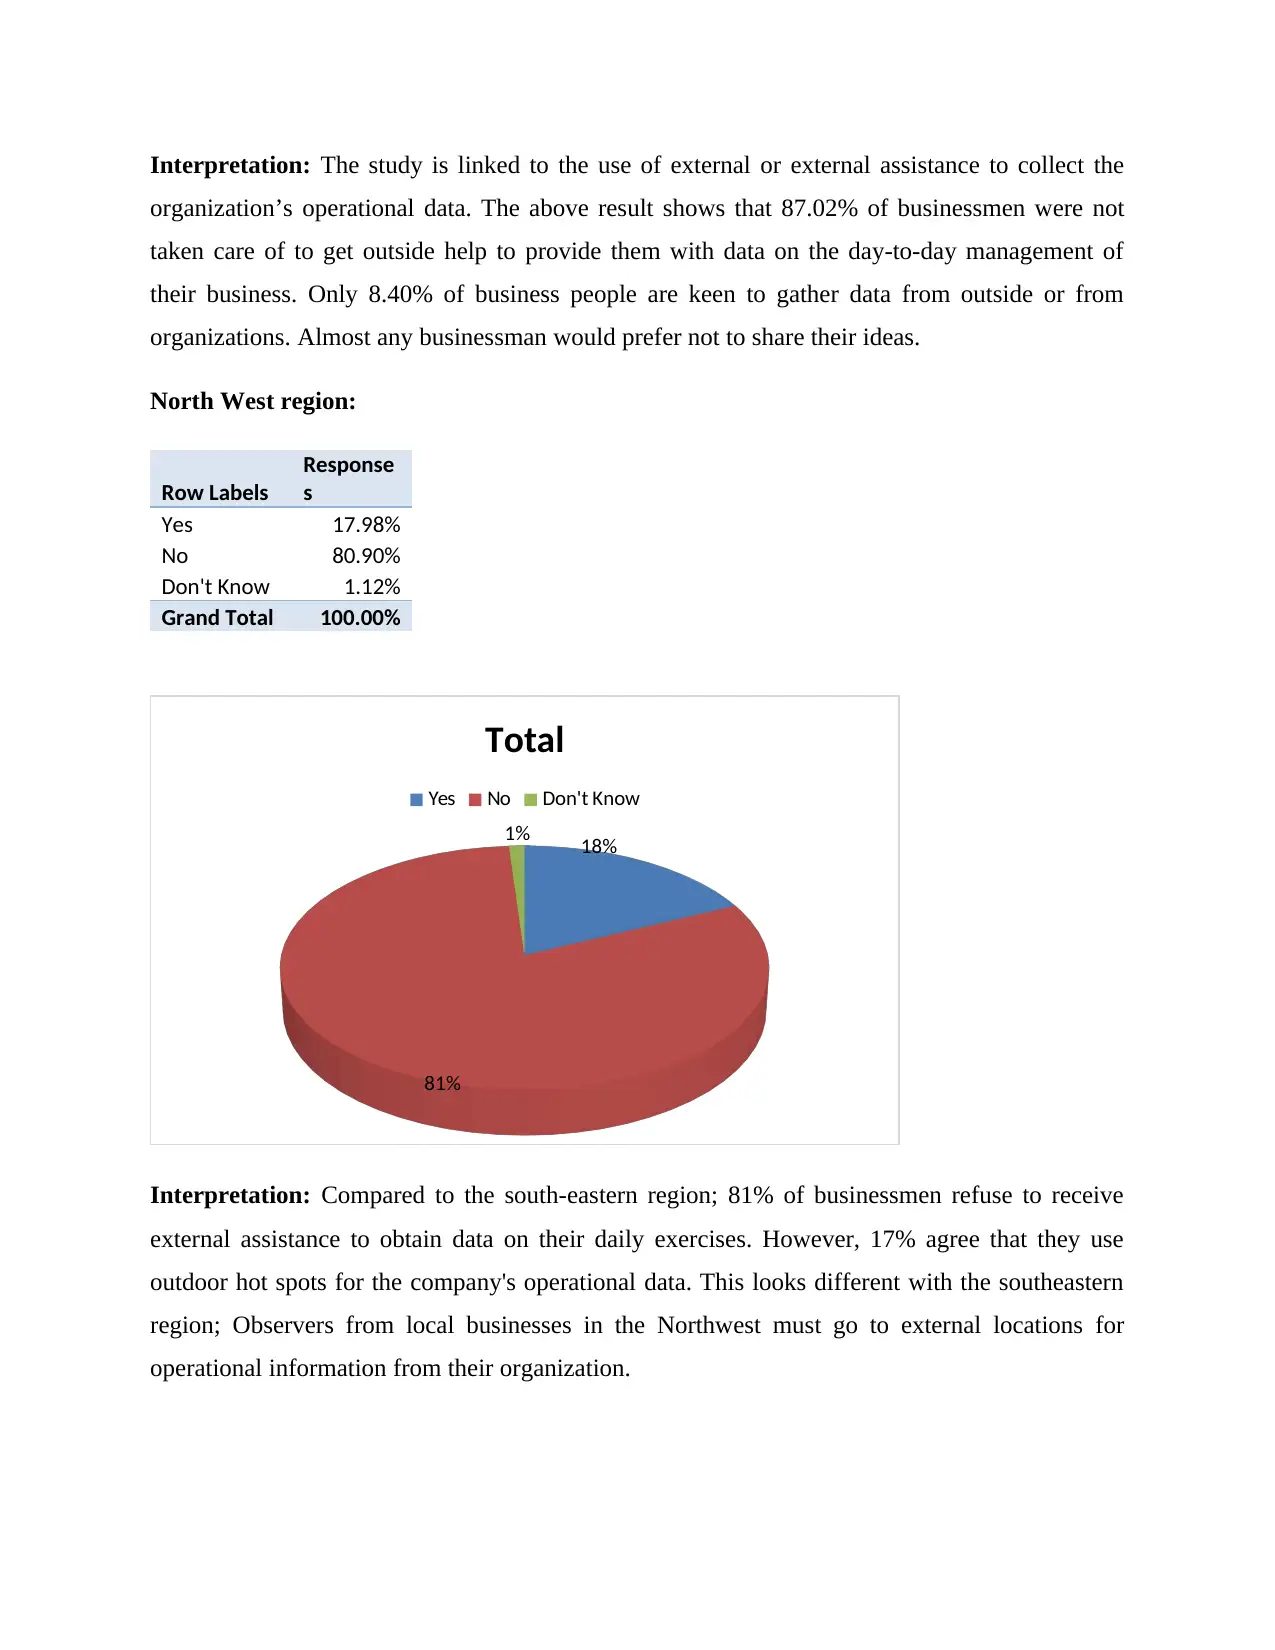
North West region:
Row Labels
Response
s
Yes 17.98%
No 80.90%
Don't Know 1.12%
Grand Total 100.00%
18%
81%
1%
Total
Yes No Don't Know
Interpretation: Compared to the south-eastern region; 81% of businessmen refuse to receive
external assistance to obtain data on their daily exercises. However, 17% agree that they use
outdoor hot spots for the company's operational data. This looks different with the southeastern
region; Observers from local businesses in the Northwest must go to external locations for
operational information from their organization.
organization’s operational data. The above result shows that 87.02% of businessmen were not
taken care of to get outside help to provide them with data on the day-to-day management of
their business. Only 8.40% of business people are keen to gather data from outside or from
organizations. Almost any businessman would prefer not to share their ideas.
North West region:
Row Labels
Response
s
Yes 17.98%
No 80.90%
Don't Know 1.12%
Grand Total 100.00%
18%
81%
1%
Total
Yes No Don't Know
Interpretation: Compared to the south-eastern region; 81% of businessmen refuse to receive
external assistance to obtain data on their daily exercises. However, 17% agree that they use
outdoor hot spots for the company's operational data. This looks different with the southeastern
region; Observers from local businesses in the Northwest must go to external locations for
operational information from their organization.
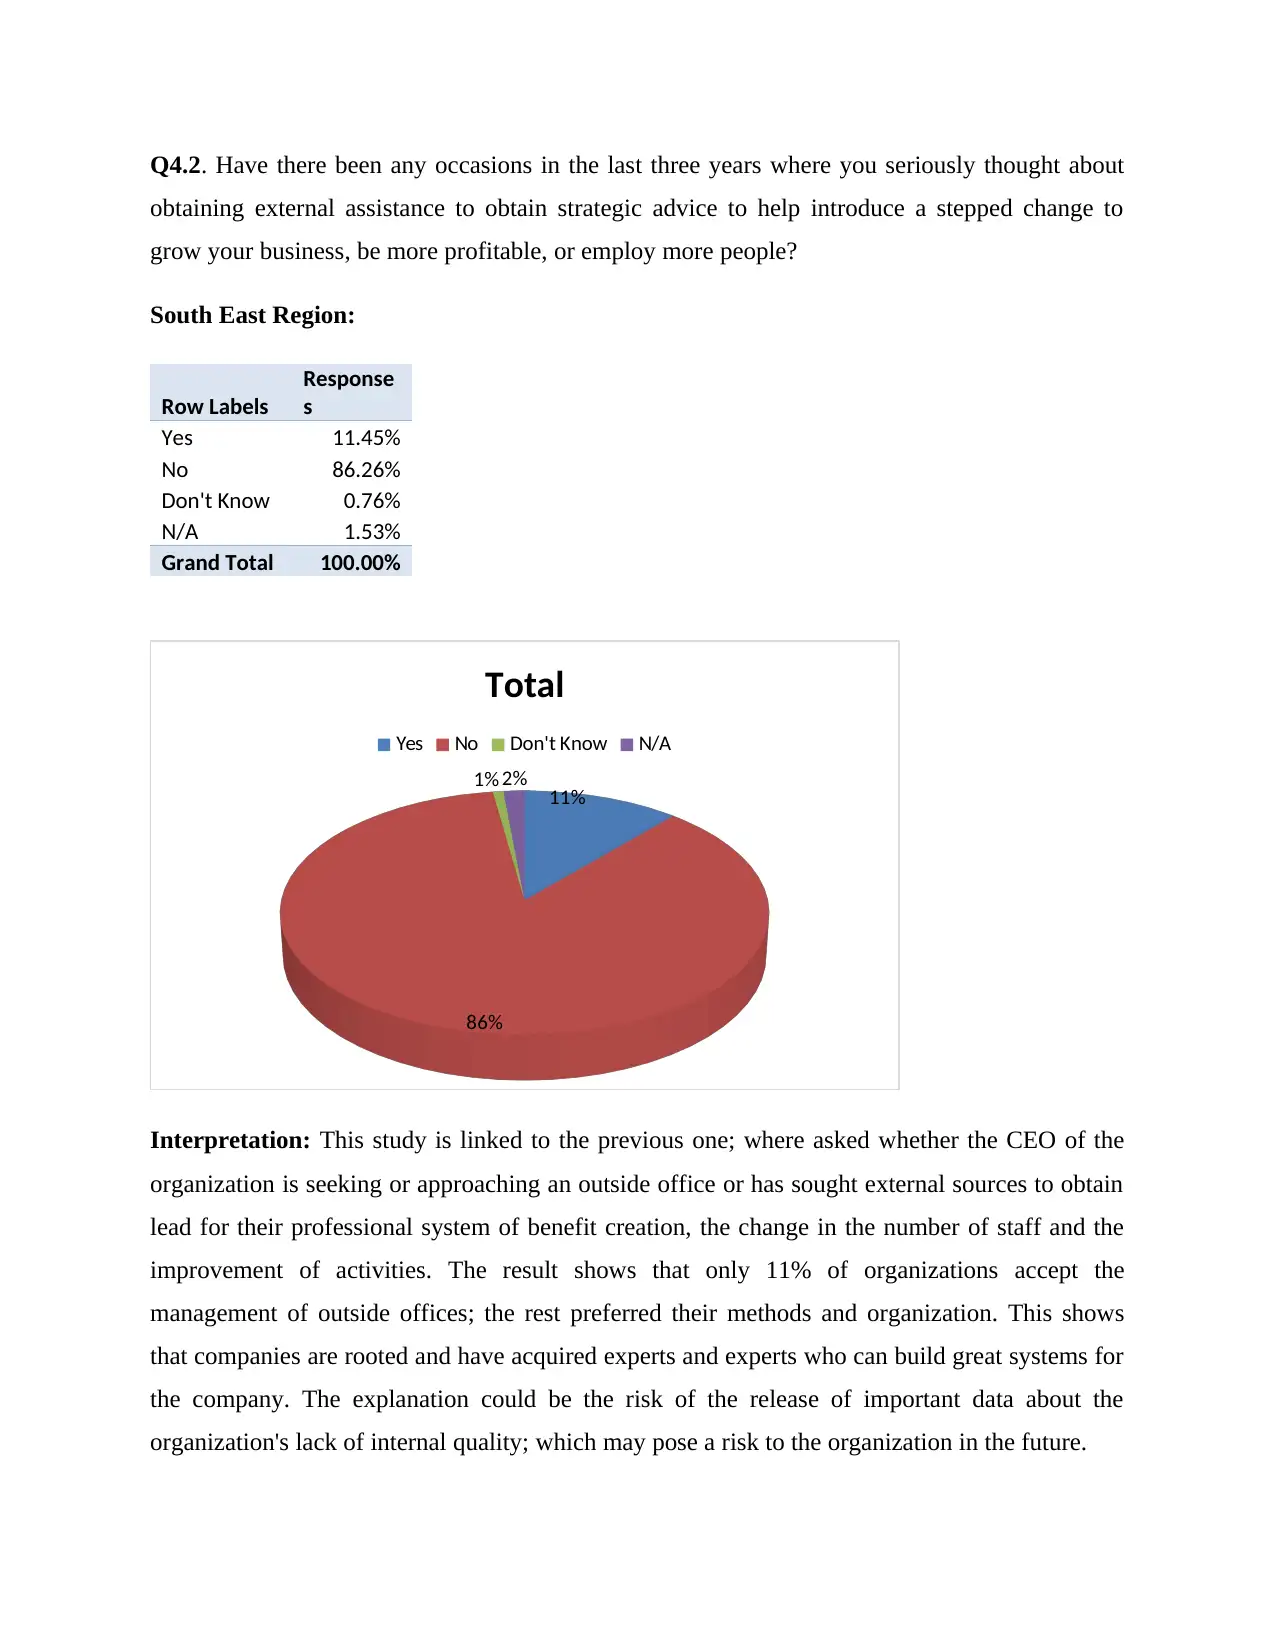
Q4.2. Have there been any occasions in the last three years where you seriously thought about
obtaining external assistance to obtain strategic advice to help introduce a stepped change to
grow your business, be more profitable, or employ more people?
South East Region:
Row Labels
Response
s
Yes 11.45%
No 86.26%
Don't Know 0.76%
N/A 1.53%
Grand Total 100.00%
11%
86%
1% 2%
Total
Yes No Don't Know N/A
Interpretation: This study is linked to the previous one; where asked whether the CEO of the
organization is seeking or approaching an outside office or has sought external sources to obtain
lead for their professional system of benefit creation, the change in the number of staff and the
improvement of activities. The result shows that only 11% of organizations accept the
management of outside offices; the rest preferred their methods and organization. This shows
that companies are rooted and have acquired experts and experts who can build great systems for
the company. The explanation could be the risk of the release of important data about the
organization's lack of internal quality; which may pose a risk to the organization in the future.
Secure Best Marks with AI Grader
Need help grading? Try our AI Grader for instant feedback on your assignments.
North West region:
Row Labels
Response
s
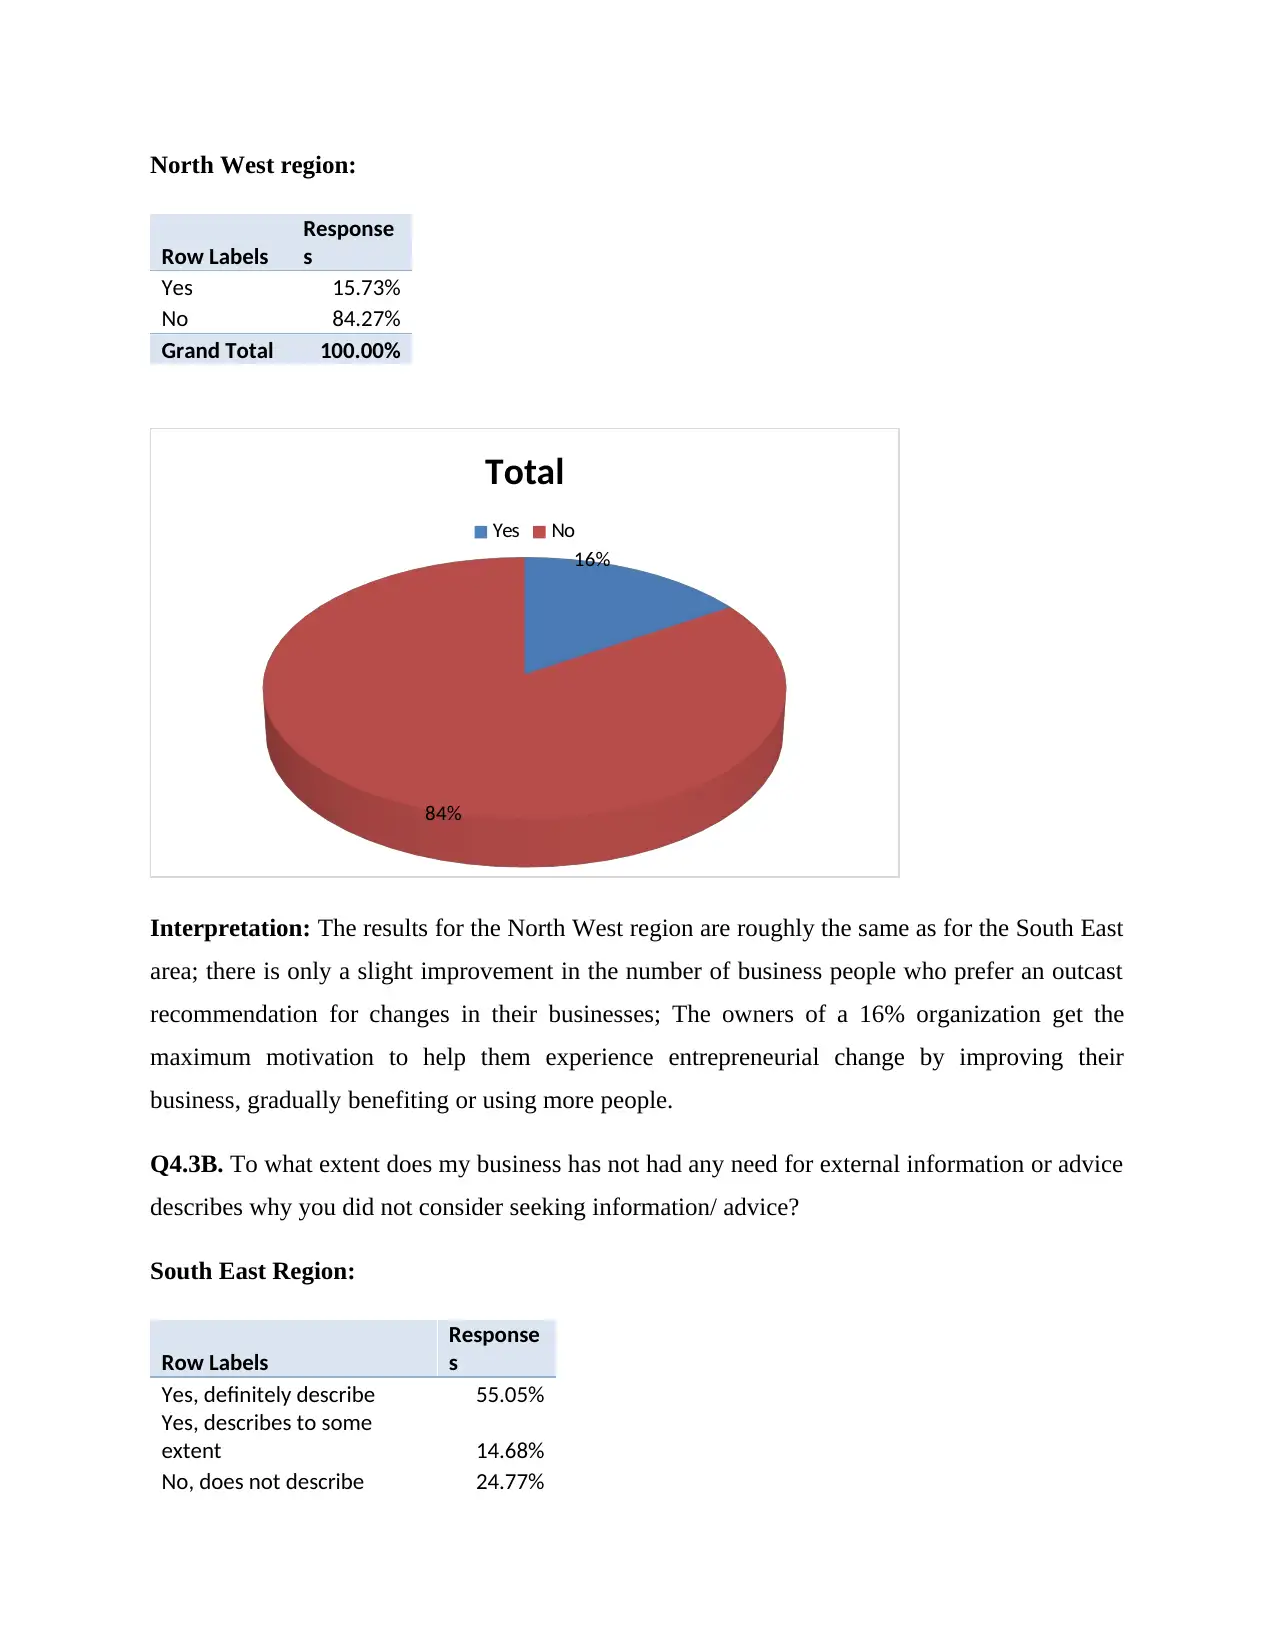
Yes 15.73%
No 84.27%
Grand Total 100.00%
16%
84%
Total
Yes No
Interpretation: The results for the North West region are roughly the same as for the South East
area; there is only a slight improvement in the number of business people who prefer an outcast
recommendation for changes in their businesses; The owners of a 16% organization get the
maximum motivation to help them experience entrepreneurial change by improving their
business, gradually benefiting or using more people.
Q4.3B. To what extent does my business has not had any need for external information or advice
describes why you did not consider seeking information/ advice?
South East Region:
Row Labels
Response
s
Yes, definitely describe 55.05%
Yes, describes to some
extent 14.68%
No, does not describe 24.77%
Row Labels
Response
s
Yes 15.73%
No 84.27%
Grand Total 100.00%
16%
84%
Total
Yes No
Interpretation: The results for the North West region are roughly the same as for the South East
area; there is only a slight improvement in the number of business people who prefer an outcast
recommendation for changes in their businesses; The owners of a 16% organization get the
maximum motivation to help them experience entrepreneurial change by improving their
business, gradually benefiting or using more people.
Q4.3B. To what extent does my business has not had any need for external information or advice
describes why you did not consider seeking information/ advice?
South East Region:
Row Labels
Response
s
Yes, definitely describe 55.05%
Yes, describes to some
extent 14.68%
No, does not describe 24.77%
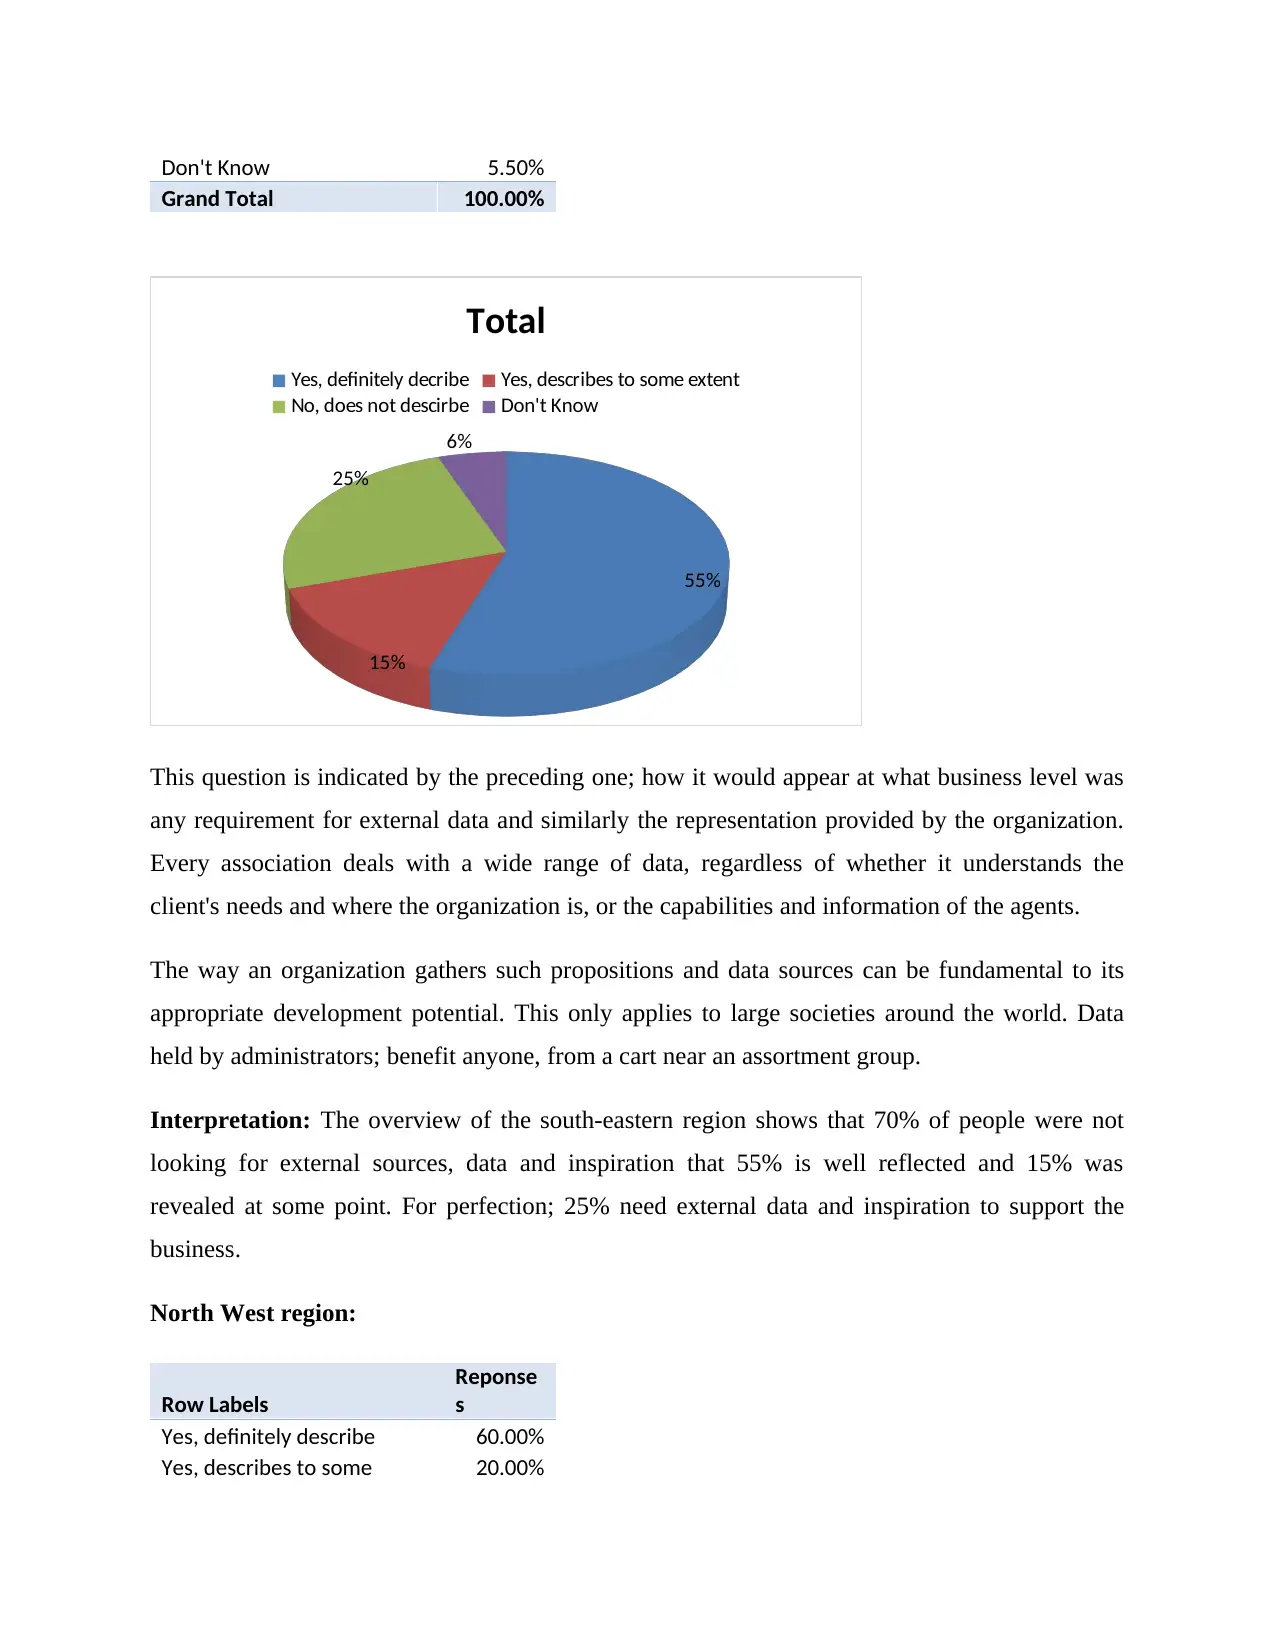
Don't Know 5.50%
Grand Total 100.00%
55%
15%
25%
6%
Total
Yes, definitely decribe Yes, describes to some extent
No, does not descirbe Don't Know
This question is indicated by the preceding one; how it would appear at what business level was
any requirement for external data and similarly the representation provided by the organization.
Every association deals with a wide range of data, regardless of whether it understands the
client's needs and where the organization is, or the capabilities and information of the agents.
The way an organization gathers such propositions and data sources can be fundamental to its
appropriate development potential. This only applies to large societies around the world. Data
held by administrators; benefit anyone, from a cart near an assortment group.
Interpretation: The overview of the south-eastern region shows that 70% of people were not
looking for external sources, data and inspiration that 55% is well reflected and 15% was
revealed at some point. For perfection; 25% need external data and inspiration to support the
business.
North West region:
Row Labels
Reponse
s
Yes, definitely describe 60.00%
Yes, describes to some 20.00%
extent
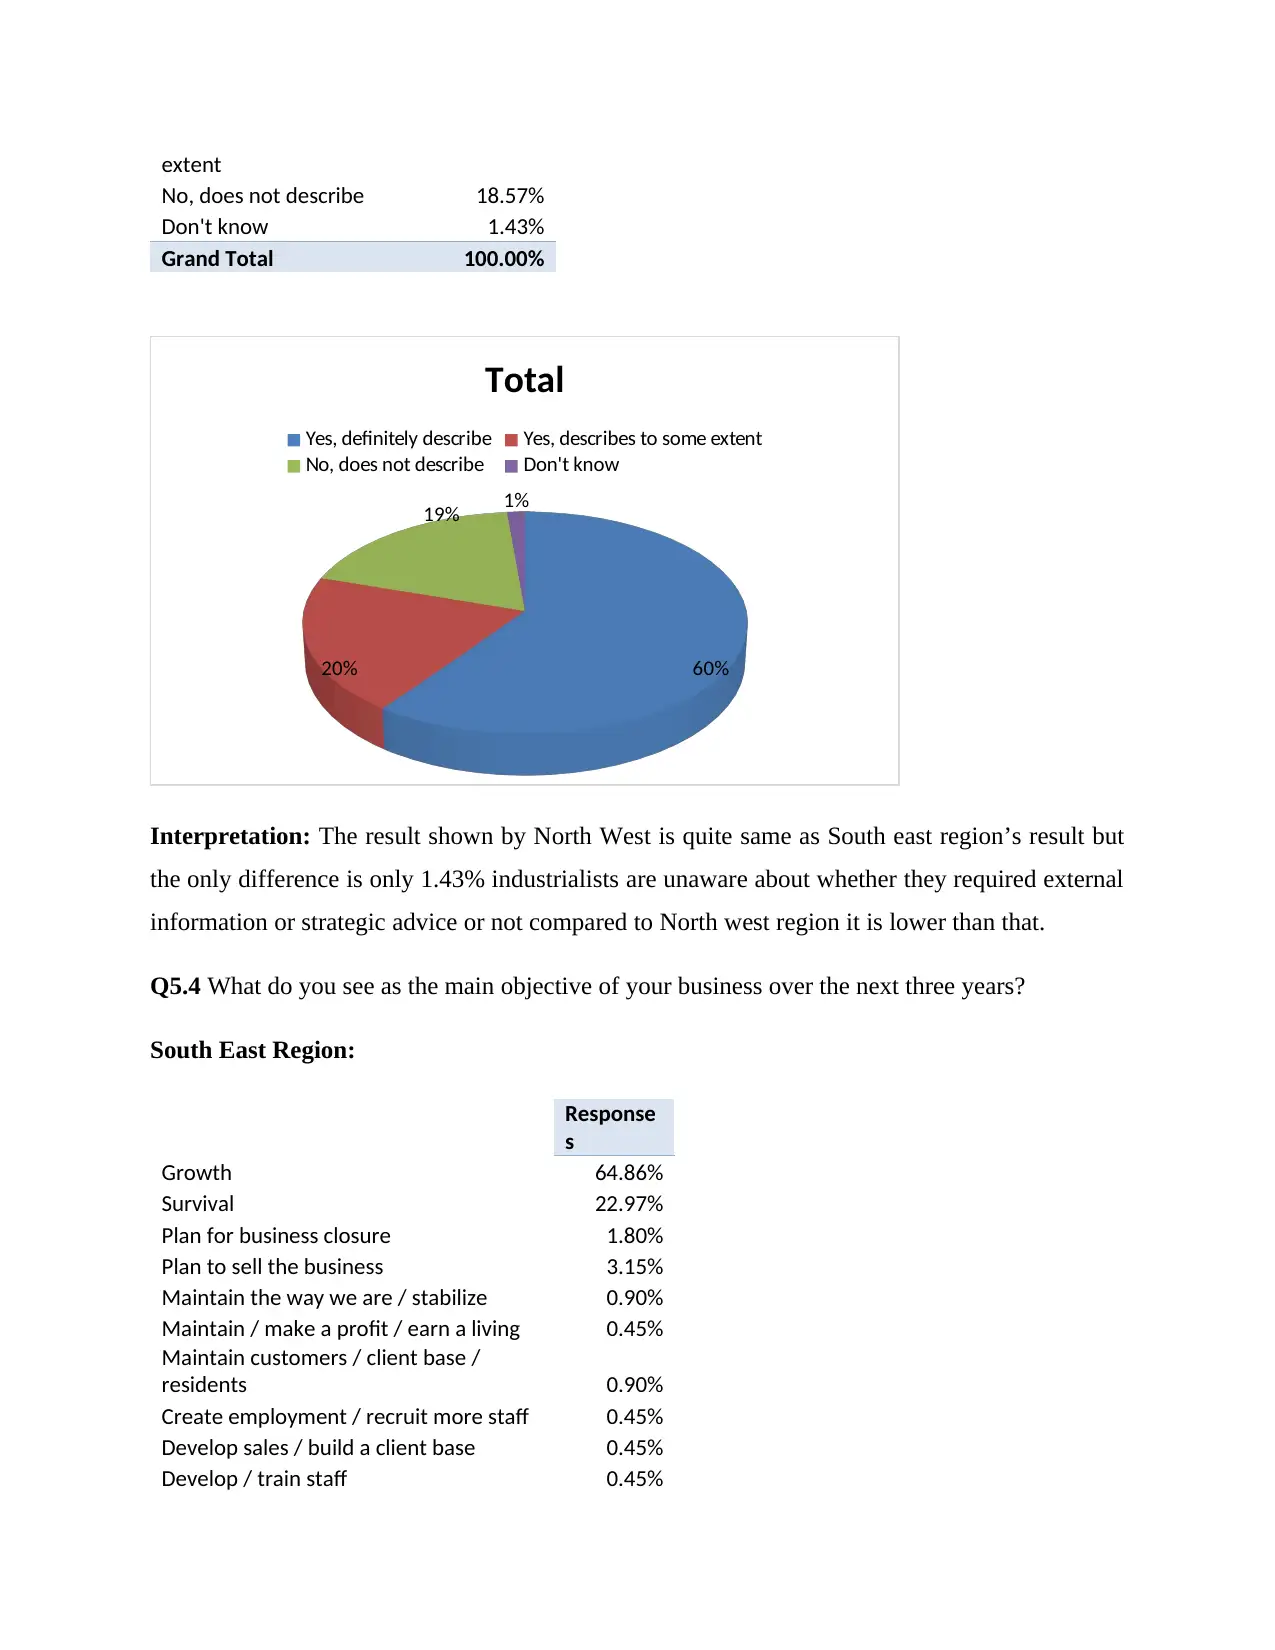
No, does not describe 18.57%
Don't know 1.43%
Grand Total 100.00%
60%20%
19% 1%
Total
Yes, definitely describe Yes, describes to some extent
No, does not describe Don't know
Interpretation: The result shown by North West is quite same as South east region’s result but
the only difference is only 1.43% industrialists are unaware about whether they required external
information or strategic advice or not compared to North west region it is lower than that.
Q5.4 What do you see as the main objective of your business over the next three years?
South East Region:
Response
s
Growth 64.86%
Survival 22.97%
Plan for business closure 1.80%
Plan to sell the business 3.15%
Maintain the way we are / stabilize 0.90%
Maintain / make a profit / earn a living 0.45%
Maintain customers / client base /
residents 0.90%
Create employment / recruit more staff 0.45%
Develop sales / build a client base 0.45%
Develop / train staff 0.45%
Paraphrase This Document
Need a fresh take? Get an instant paraphrase of this document with our AI Paraphraser
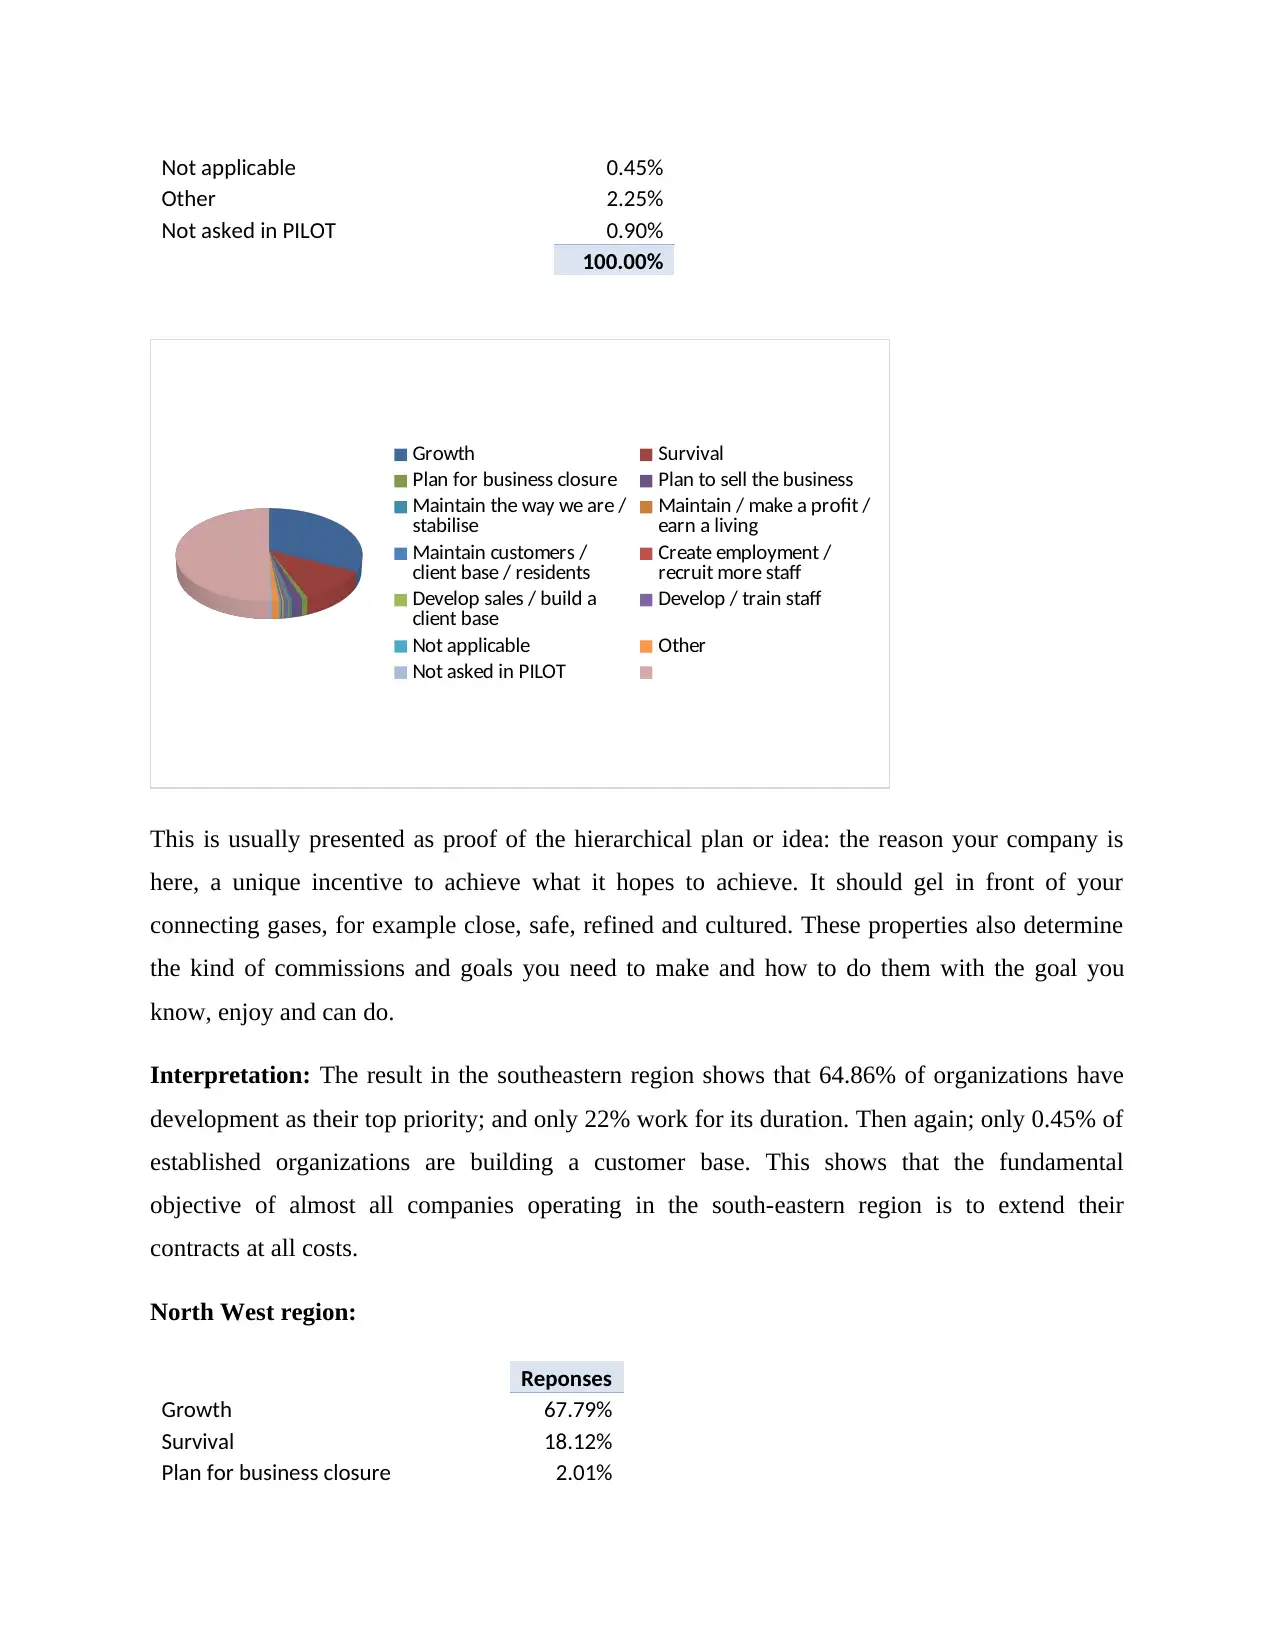
Not applicable 0.45%
Other 2.25%
Not asked in PILOT 0.90%
100.00%
Growth Survival
Plan for business closure Plan to sell the business
Maintain the way we are /
stabilise Maintain / make a profit /
earn a living
Maintain customers /
client base / residents Create employment /
recruit more staff
Develop sales / build a
client base Develop / train staff
Not applicable Other
Not asked in PILOT
This is usually presented as proof of the hierarchical plan or idea: the reason your company is
here, a unique incentive to achieve what it hopes to achieve. It should gel in front of your
connecting gases, for example close, safe, refined and cultured. These properties also determine
the kind of commissions and goals you need to make and how to do them with the goal you
know, enjoy and can do.
Interpretation: The result in the southeastern region shows that 64.86% of organizations have
development as their top priority; and only 22% work for its duration. Then again; only 0.45% of
established organizations are building a customer base. This shows that the fundamental
objective of almost all companies operating in the south-eastern region is to extend their
contracts at all costs.
North West region:
Reponses
Growth 67.79%
Survival 18.12%
Plan for business closure 2.01%
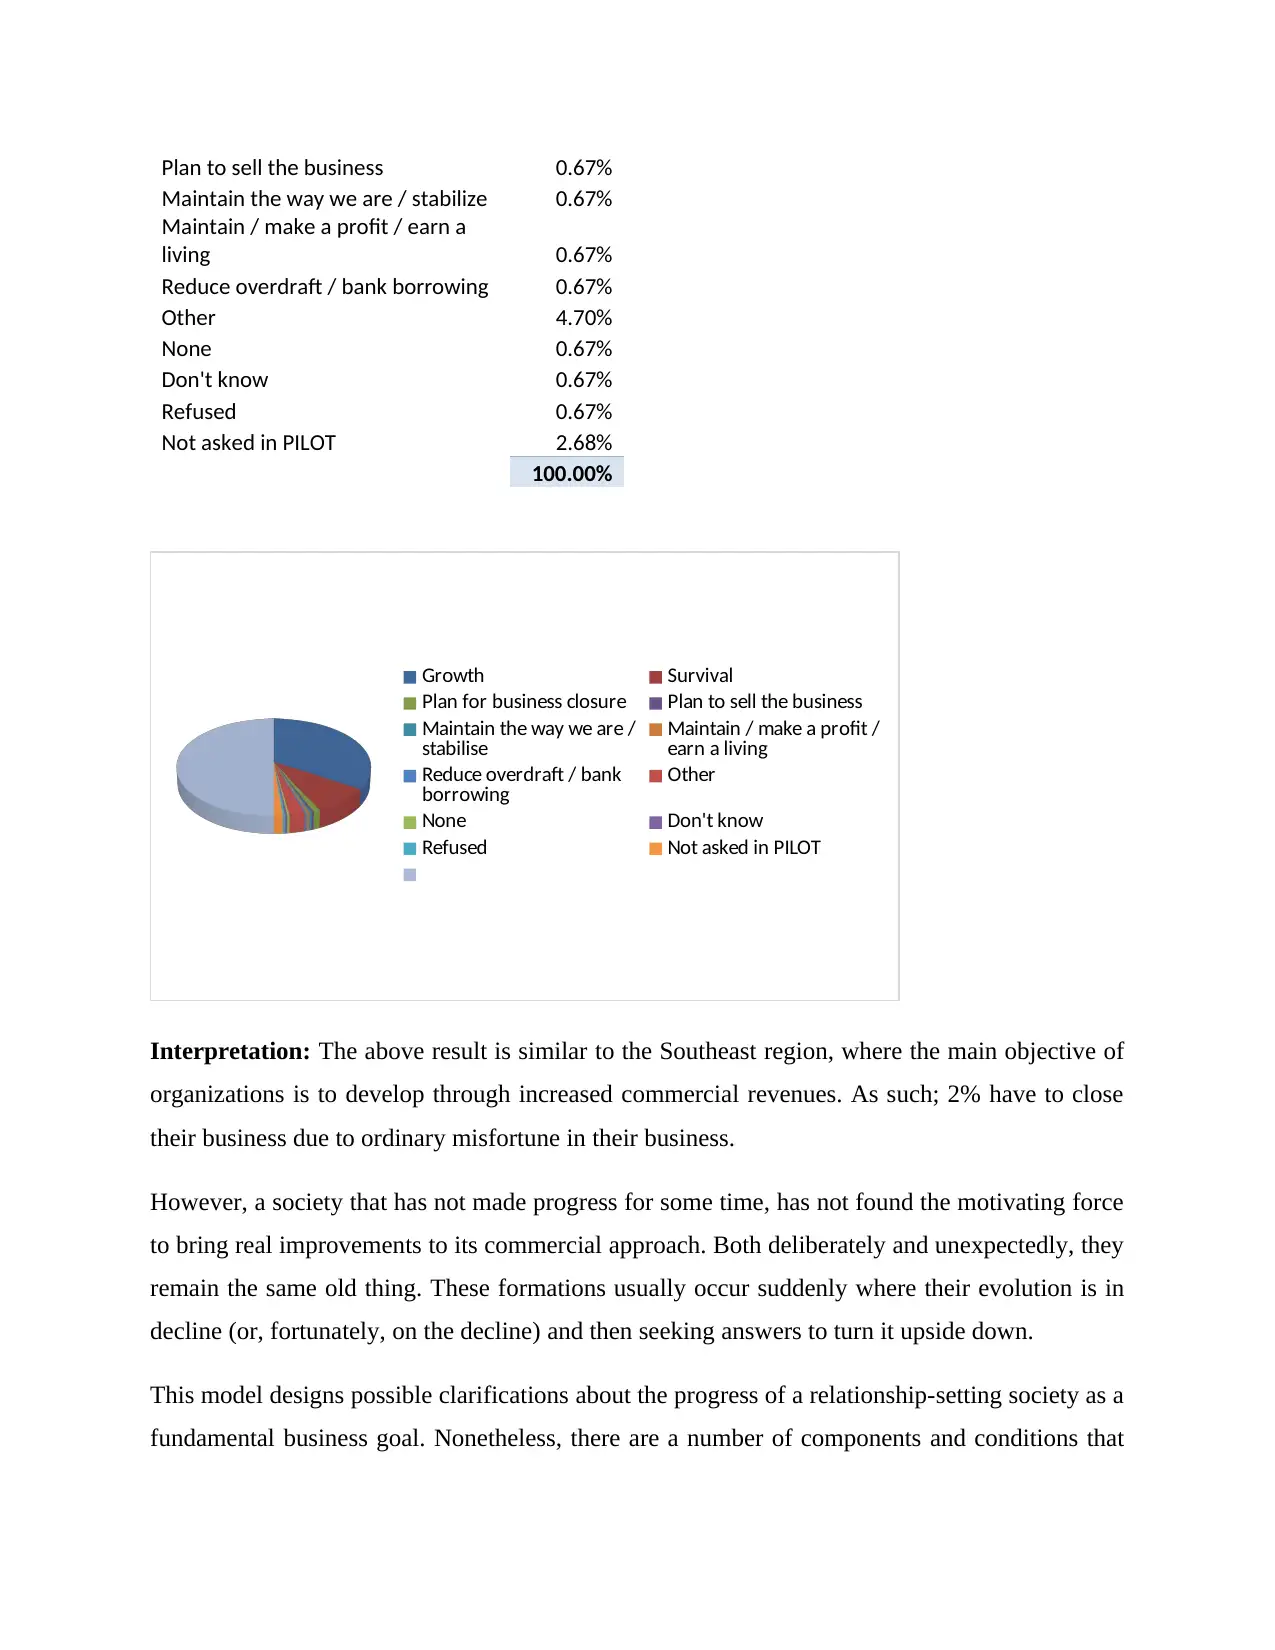
Plan to sell the business 0.67%
Maintain the way we are / stabilize 0.67%
Maintain / make a profit / earn a
living 0.67%
Reduce overdraft / bank borrowing 0.67%
Other 4.70%
None 0.67%
Don't know 0.67%
Refused 0.67%
Not asked in PILOT 2.68%
100.00%
Growth Survival
Plan for business closure Plan to sell the business
Maintain the way we are /
stabilise Maintain / make a profit /
earn a living
Reduce overdraft / bank
borrowing Other
None Don't know
Refused Not asked in PILOT
Interpretation: The above result is similar to the Southeast region, where the main objective of
organizations is to develop through increased commercial revenues. As such; 2% have to close
their business due to ordinary misfortune in their business.
However, a society that has not made progress for some time, has not found the motivating force
to bring real improvements to its commercial approach. Both deliberately and unexpectedly, they
remain the same old thing. These formations usually occur suddenly where their evolution is in
decline (or, fortunately, on the decline) and then seeking answers to turn it upside down.
This model designs possible clarifications about the progress of a relationship-setting society as a
fundamental business goal. Nonetheless, there are a number of components and conditions that
compel a society to set a development goal. These reasons can be based on the authoritative
conditions, objective position, predisposition and mind of the buyer.
Q5.5. Has your business actually grown over the past three years/ since established?
South East Region:
Row Labels
Response
s
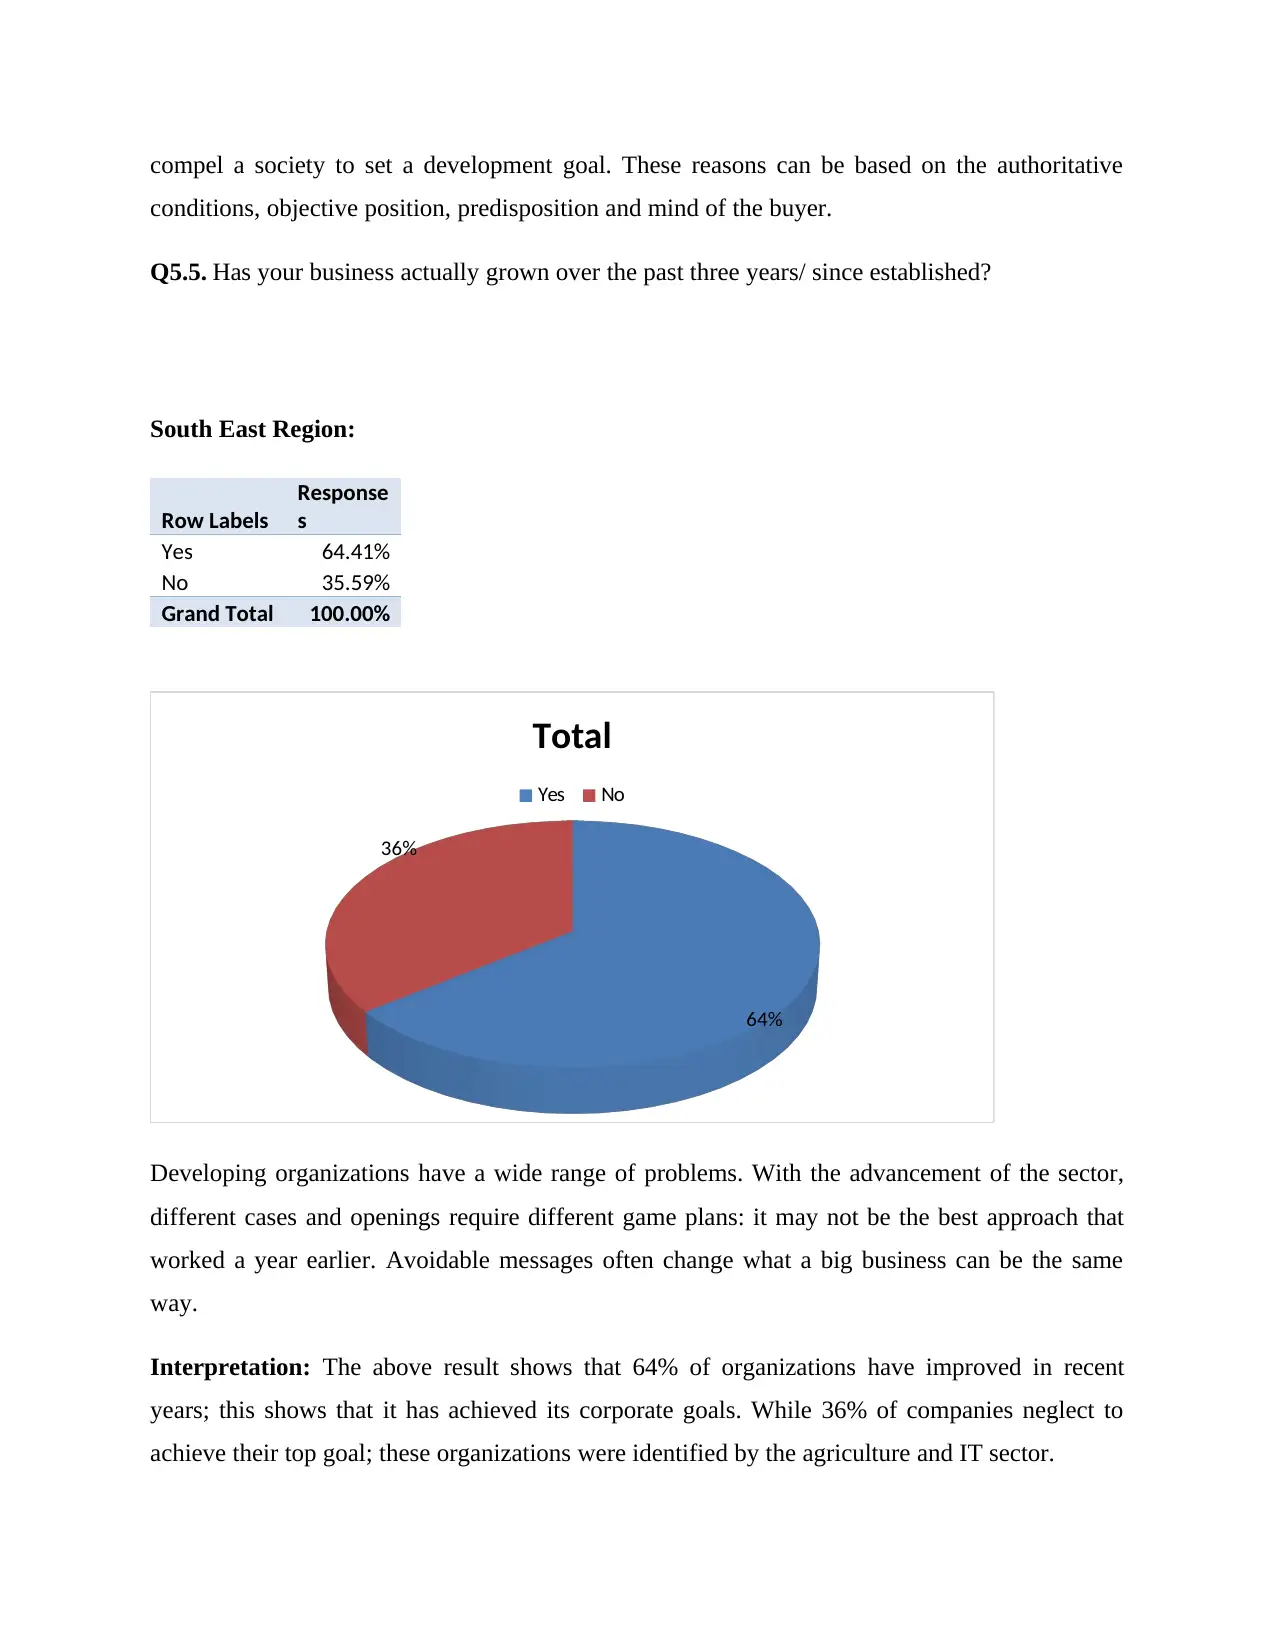
Yes 64.41%
No 35.59%
Grand Total 100.00%
64%
36%
Total
Yes No
Developing organizations have a wide range of problems. With the advancement of the sector,
different cases and openings require different game plans: it may not be the best approach that
worked a year earlier. Avoidable messages often change what a big business can be the same
way.
Interpretation: The above result shows that 64% of organizations have improved in recent
years; this shows that it has achieved its corporate goals. While 36% of companies neglect to
achieve their top goal; these organizations were identified by the agriculture and IT sector.
conditions, objective position, predisposition and mind of the buyer.
Q5.5. Has your business actually grown over the past three years/ since established?
South East Region:
Row Labels
Response
s
Yes 64.41%
No 35.59%
Grand Total 100.00%
64%
36%
Total
Yes No
Developing organizations have a wide range of problems. With the advancement of the sector,
different cases and openings require different game plans: it may not be the best approach that
worked a year earlier. Avoidable messages often change what a big business can be the same
way.
Interpretation: The above result shows that 64% of organizations have improved in recent
years; this shows that it has achieved its corporate goals. While 36% of companies neglect to
achieve their top goal; these organizations were identified by the agriculture and IT sector.
Secure Best Marks with AI Grader
Need help grading? Try our AI Grader for instant feedback on your assignments.
North West region:
Row Labels
Response
s
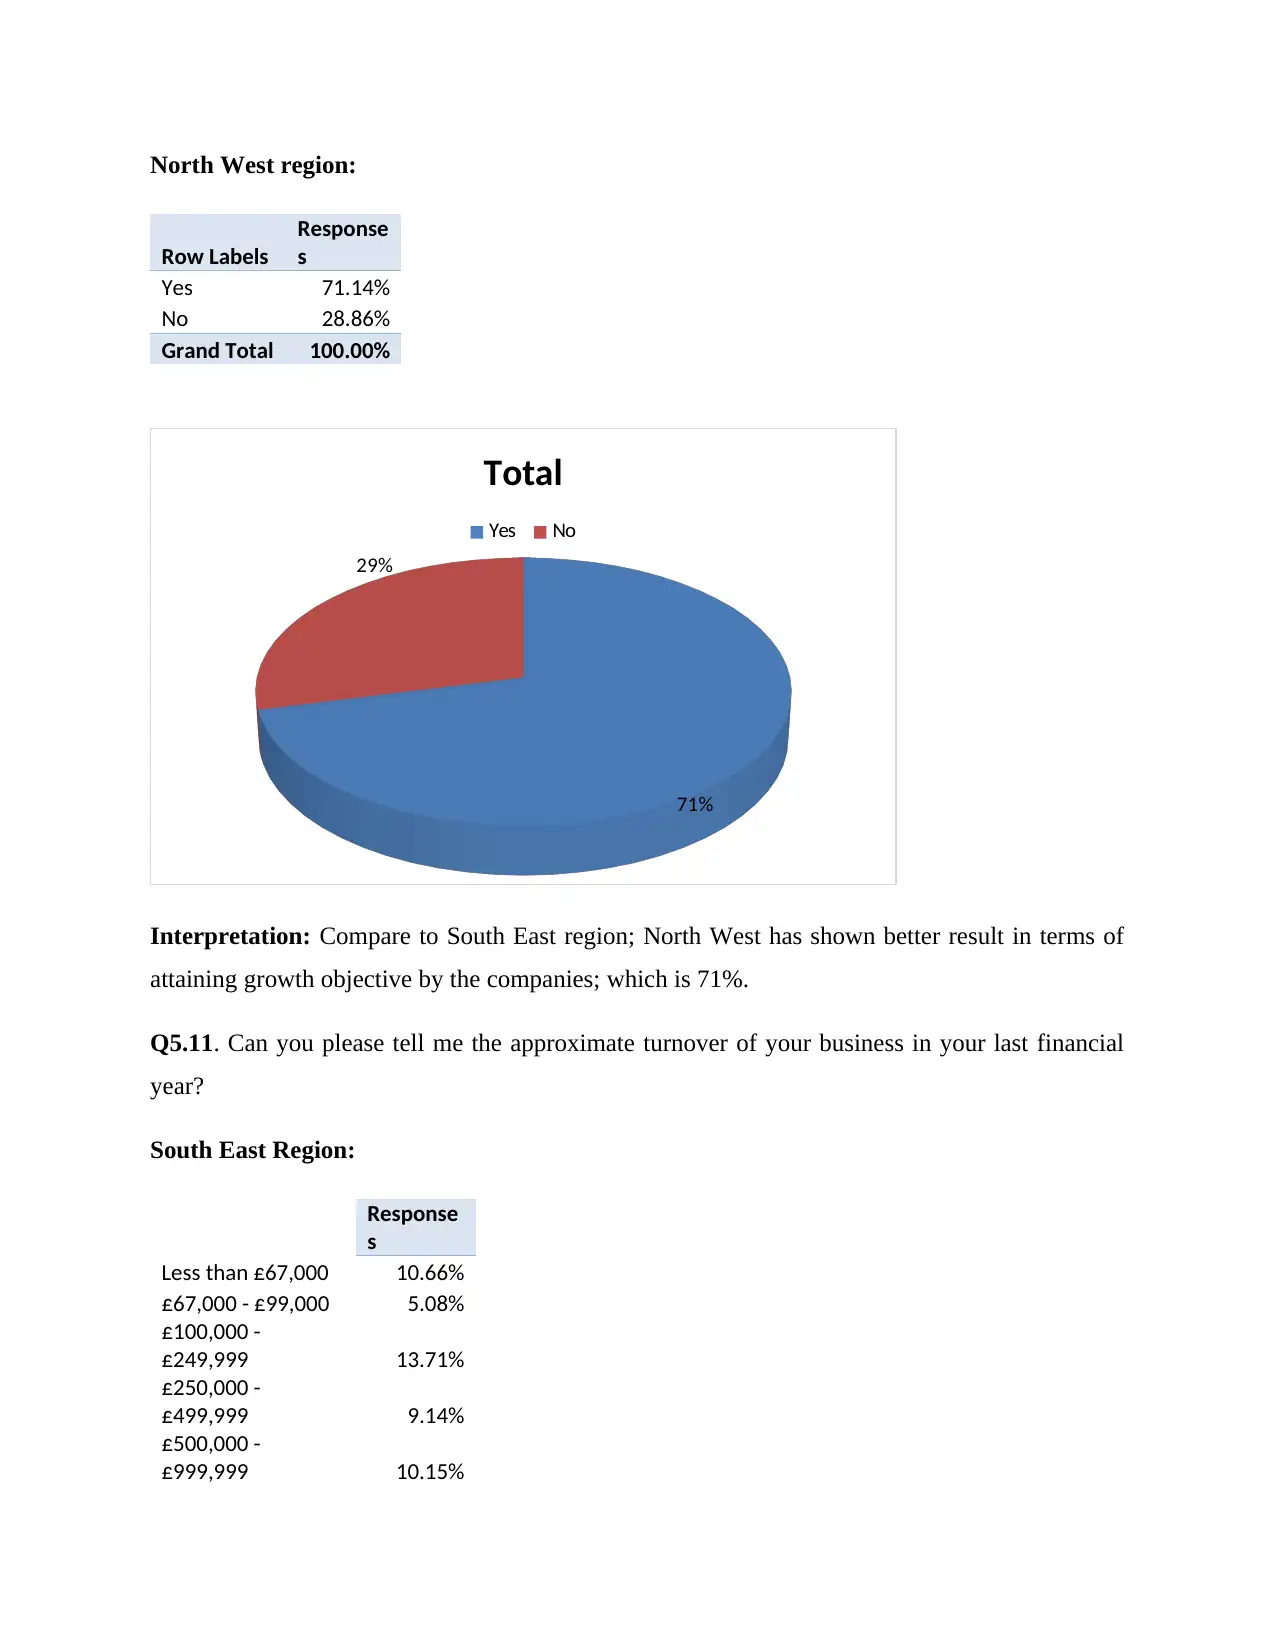
Yes 71.14%
No 28.86%
Grand Total 100.00%
71%
29%
Total
Yes No
Interpretation: Compare to South East region; North West has shown better result in terms of
attaining growth objective by the companies; which is 71%.
Q5.11. Can you please tell me the approximate turnover of your business in your last financial
year?
South East Region:
Response
s
Less than £67,000 10.66%
£67,000 - £99,000 5.08%
£100,000 -
£249,999 13.71%
£250,000 -
£499,999 9.14%
£500,000 -
£999,999 10.15%
Row Labels
Response
s
Yes 71.14%
No 28.86%
Grand Total 100.00%
71%
29%
Total
Yes No
Interpretation: Compare to South East region; North West has shown better result in terms of
attaining growth objective by the companies; which is 71%.
Q5.11. Can you please tell me the approximate turnover of your business in your last financial
year?
South East Region:
Response
s
Less than £67,000 10.66%
£67,000 - £99,000 5.08%
£100,000 -
£249,999 13.71%
£250,000 -
£499,999 9.14%
£500,000 -
£999,999 10.15%
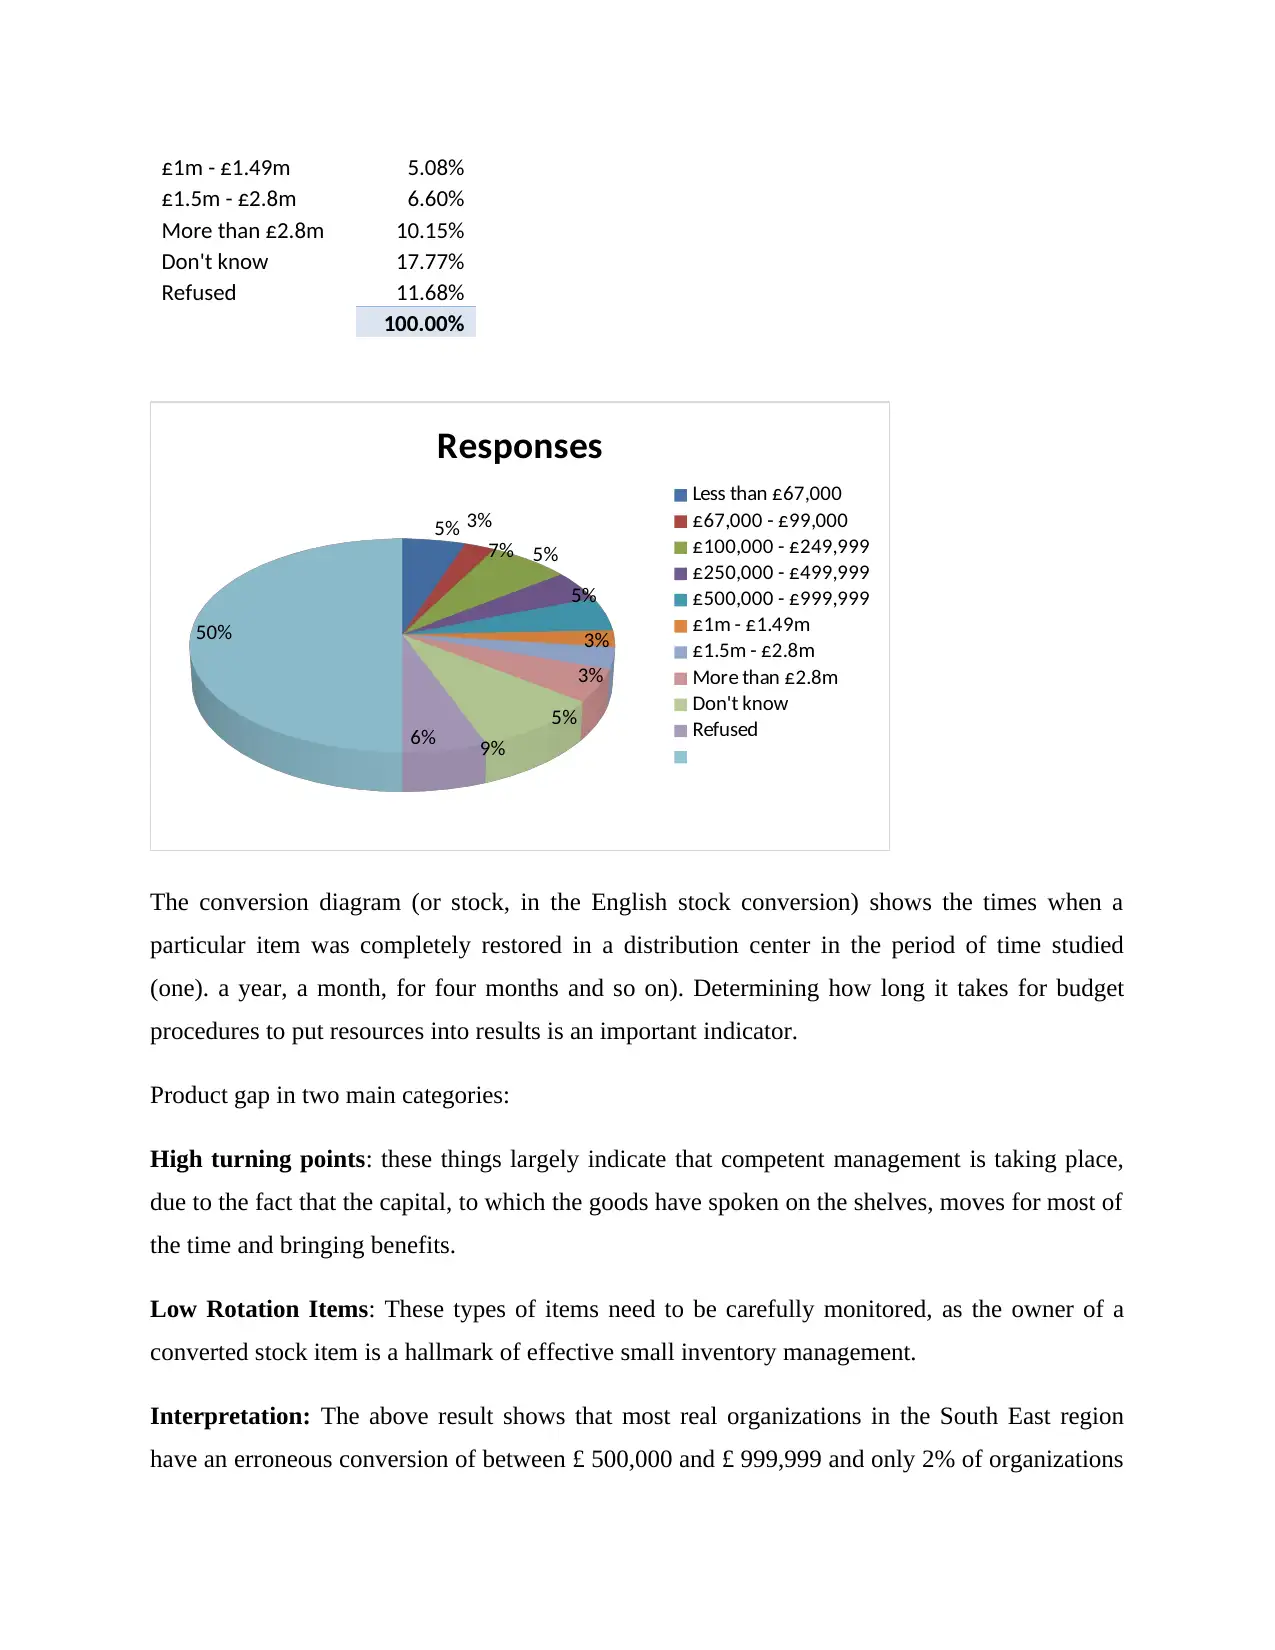
£1m - £1.49m 5.08%
£1.5m - £2.8m 6.60%
More than £2.8m 10.15%
Don't know 17.77%
Refused 11.68%
100.00%
5% 3%
7% 5%
5%
3%
3%
5%
9%
6%
50%
Responses
Less than £67,000
£67,000 - £99,000
£100,000 - £249,999
£250,000 - £499,999
£500,000 - £999,999
£1m - £1.49m
£1.5m - £2.8m
More than £2.8m
Don't know
Refused
The conversion diagram (or stock, in the English stock conversion) shows the times when a
particular item was completely restored in a distribution center in the period of time studied
(one). a year, a month, for four months and so on). Determining how long it takes for budget
procedures to put resources into results is an important indicator.
Product gap in two main categories:
High turning points: these things largely indicate that competent management is taking place,
due to the fact that the capital, to which the goods have spoken on the shelves, moves for most of
the time and bringing benefits.
Low Rotation Items: These types of items need to be carefully monitored, as the owner of a
converted stock item is a hallmark of effective small inventory management.
Interpretation: The above result shows that most real organizations in the South East region
have an erroneous conversion of between £ 500,000 and £ 999,999 and only 2% of organizations
are ready to cross the turnover of £ 2.8 million. This shows the standard version of the physical
range somewhere in the range of £ 500,000 and £ 999,999.
North West region:
Response
s
Less than £67,000 13.85%
£67,000 - £99,000 6.92%
£100,000 -
£249,999 18.46%
£250,000 -
£499,999 10.77%
£500,000 -
£999,999 5.38%
£1m - £1.49m 9.23%
£1.5m - £2.8m 3.85%
More than £2.8m 8.46%
Don't know 12.31%
Refused 10.77%
100.00%
7%
3%
9%
5%
3%
5%
2%4%6%
5%
50%
Responses
Less than £67,000
£67,000 - £99,000
£100,000 - £249,999
£250,000 - £499,999
£500,000 - £999,999
£1m - £1.49m
£1.5m - £2.8m
More than £2.8m
Don't know
Refused
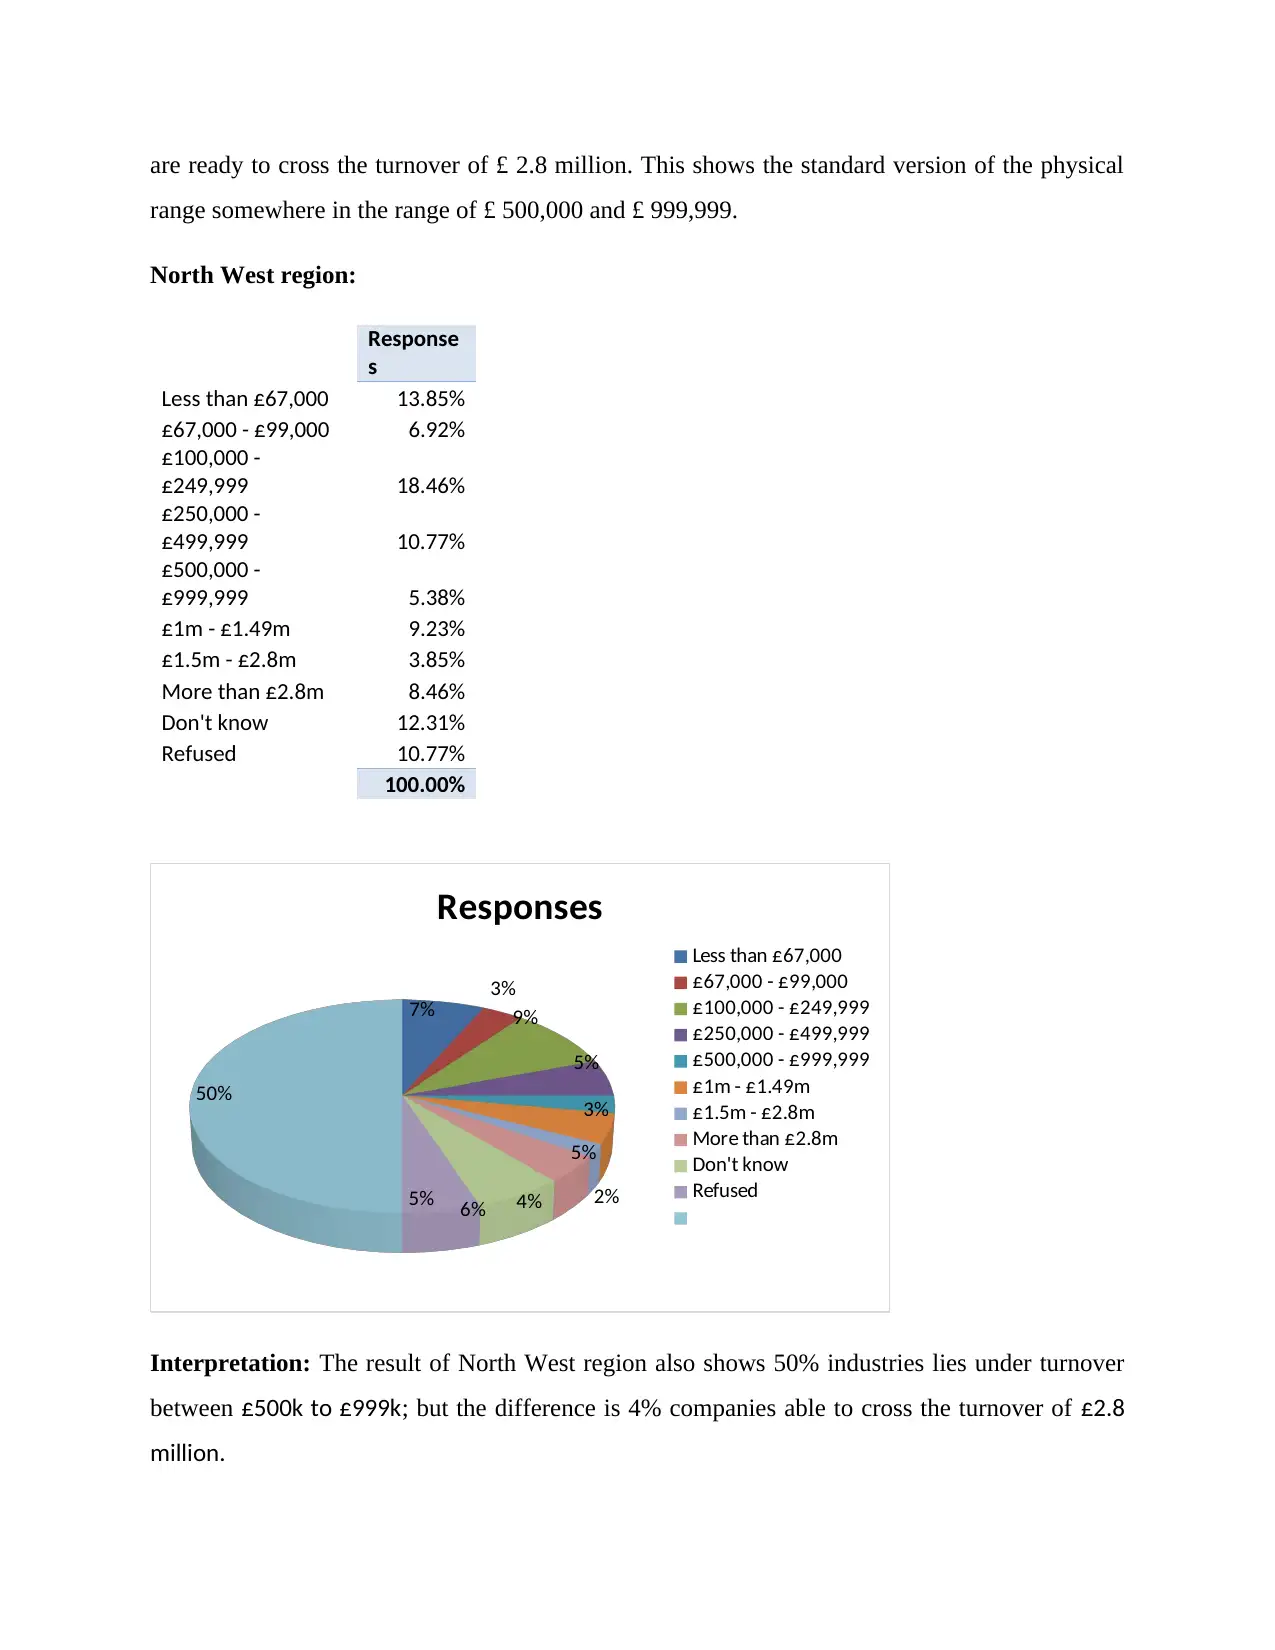
Interpretation: The result of North West region also shows 50% industries lies under turnover
between £500k to £999k; but the difference is 4% companies able to cross the turnover of £2.8
million.
range somewhere in the range of £ 500,000 and £ 999,999.
North West region:
Response
s
Less than £67,000 13.85%
£67,000 - £99,000 6.92%
£100,000 -
£249,999 18.46%
£250,000 -
£499,999 10.77%
£500,000 -
£999,999 5.38%
£1m - £1.49m 9.23%
£1.5m - £2.8m 3.85%
More than £2.8m 8.46%
Don't know 12.31%
Refused 10.77%
100.00%
7%
3%
9%
5%
3%
5%
2%4%6%
5%
50%
Responses
Less than £67,000
£67,000 - £99,000
£100,000 - £249,999
£250,000 - £499,999
£500,000 - £999,999
£1m - £1.49m
£1.5m - £2.8m
More than £2.8m
Don't know
Refused
Interpretation: The result of North West region also shows 50% industries lies under turnover
between £500k to £999k; but the difference is 4% companies able to cross the turnover of £2.8
million.
Paraphrase This Document
Need a fresh take? Get an instant paraphrase of this document with our AI Paraphraser
Q5.12. Compared with the previous year, has your turnover increased, decreased or stayed
roughly the same?
South East Region:
Response
s
Increased 31.47%
Decreased 18.27%
Stayed the same 37.56%
Don't know 10.15%
Refused 2.54%
100.00%
31%
18%
38%
10% 3%
Responses
Increased
Decreased
Stayed the same
Don't know
Refused
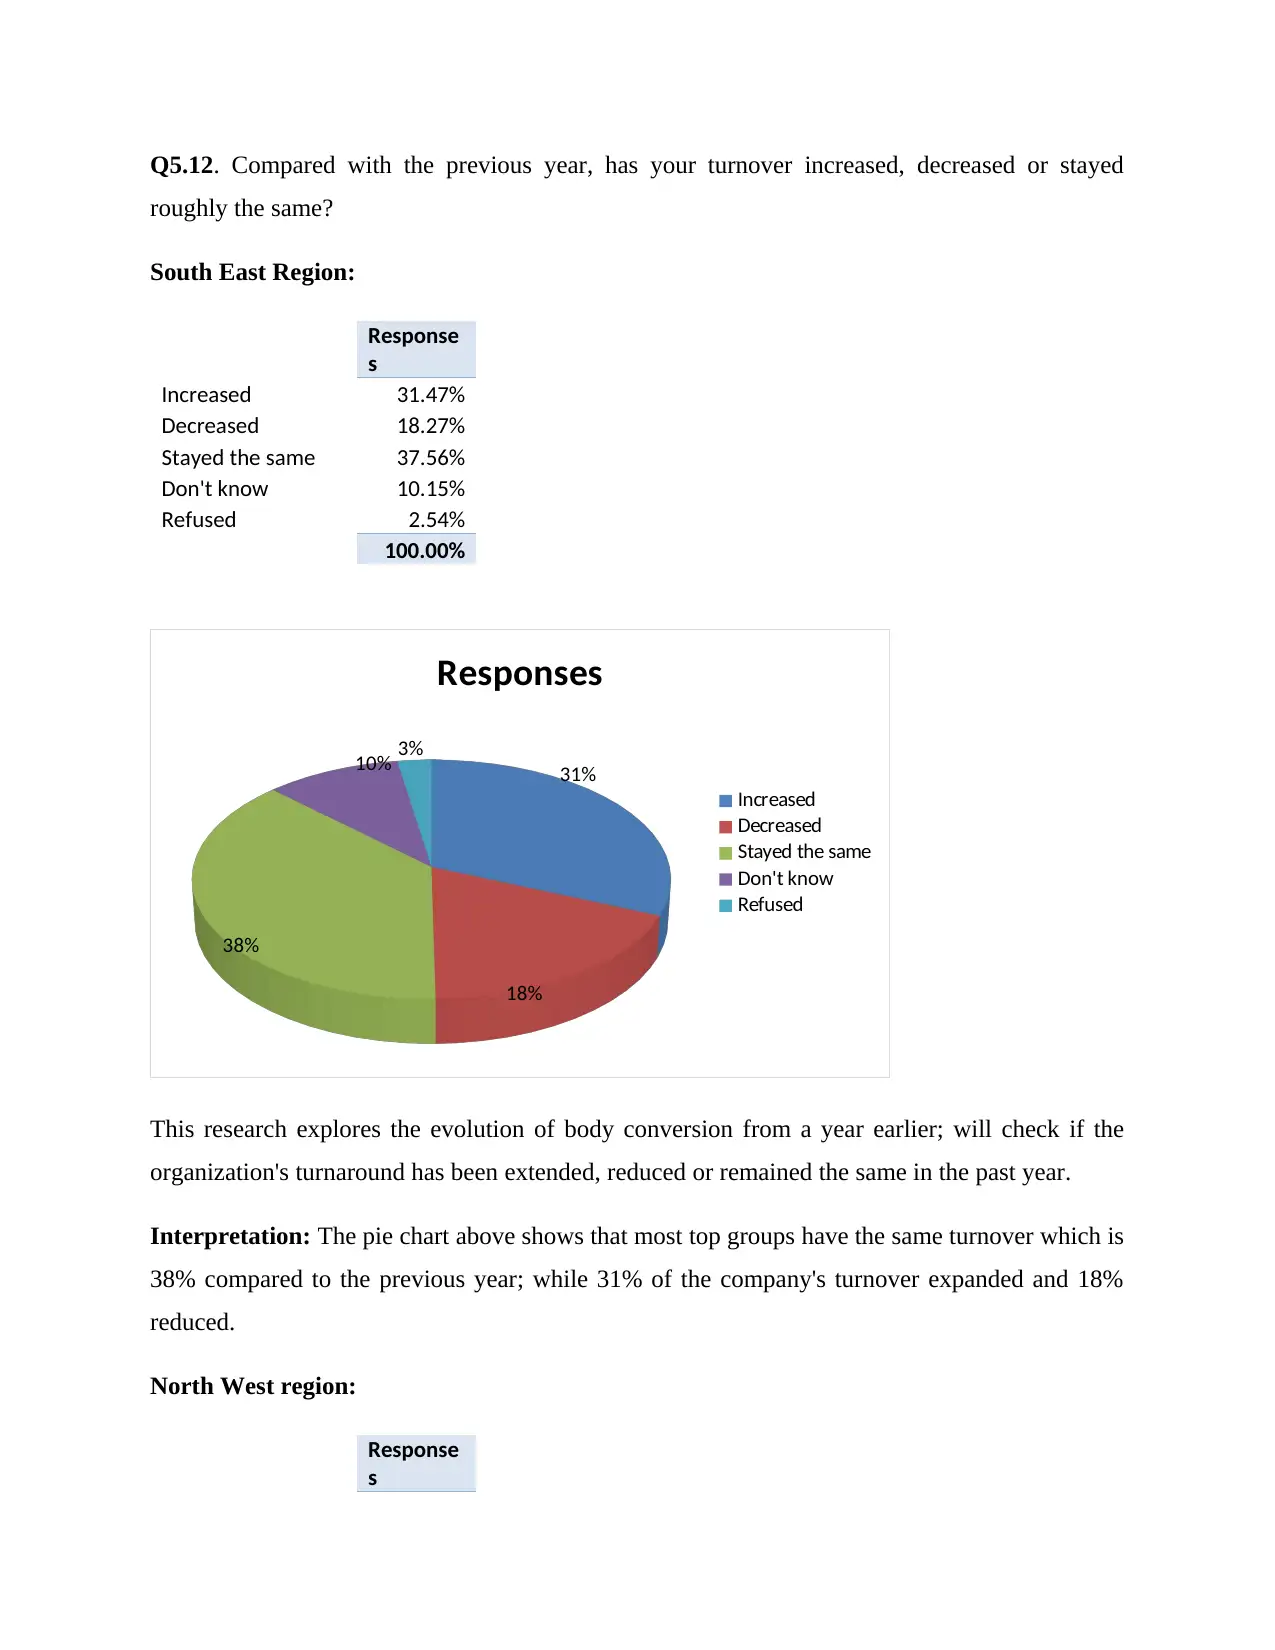
This research explores the evolution of body conversion from a year earlier; will check if the
organization's turnaround has been extended, reduced or remained the same in the past year.
Interpretation: The pie chart above shows that most top groups have the same turnover which is
38% compared to the previous year; while 31% of the company's turnover expanded and 18%
reduced.
North West region:
Response
s
roughly the same?
South East Region:
Response
s
Increased 31.47%
Decreased 18.27%
Stayed the same 37.56%
Don't know 10.15%
Refused 2.54%
100.00%
31%
18%
38%
10% 3%
Responses
Increased
Decreased
Stayed the same
Don't know
Refused
This research explores the evolution of body conversion from a year earlier; will check if the
organization's turnaround has been extended, reduced or remained the same in the past year.
Interpretation: The pie chart above shows that most top groups have the same turnover which is
38% compared to the previous year; while 31% of the company's turnover expanded and 18%
reduced.
North West region:
Response
s
Increased 49.23%
Decreased 12.31%
Stayed the same 27.69%
Don't know 8.46%
Refused 2.31%
49%
12%
28%
8% 2%
Responses
Increased
Decreased
Stayed the same
Don't know
Refused
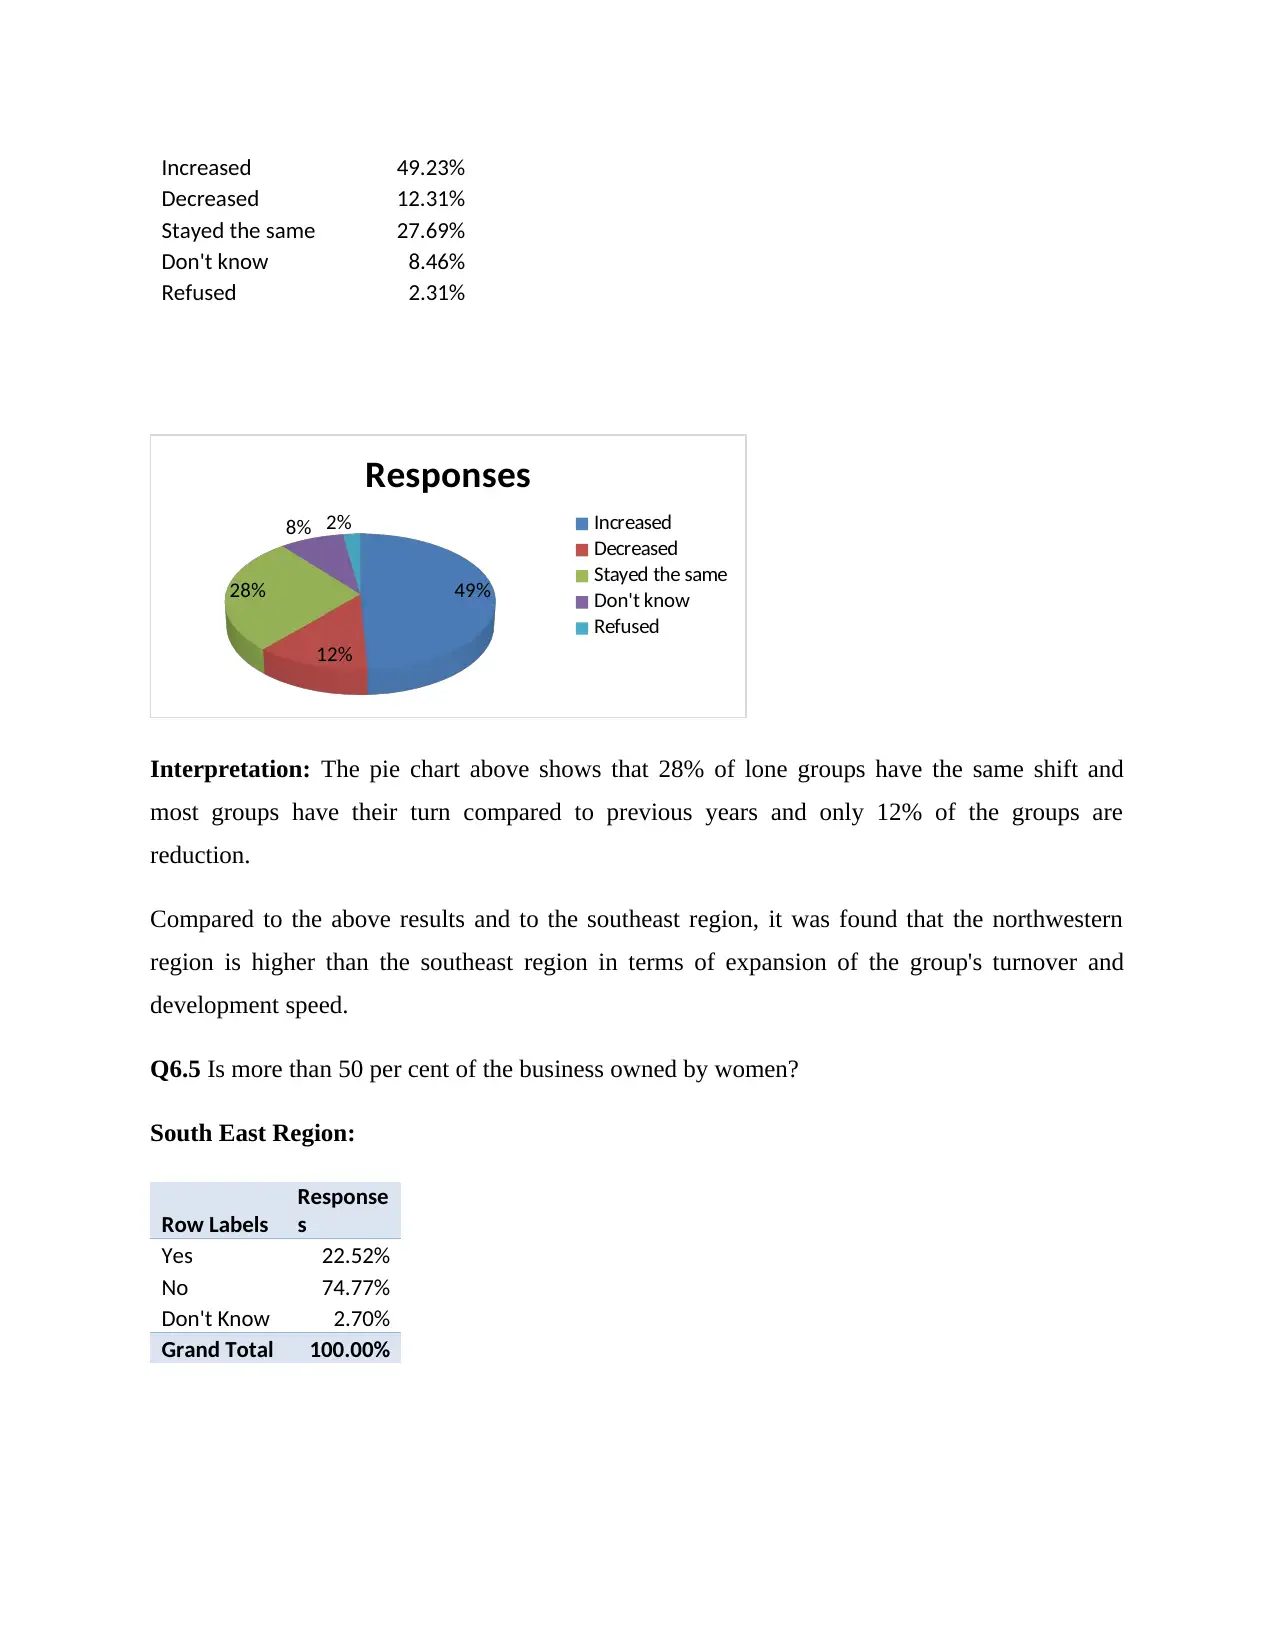
Interpretation: The pie chart above shows that 28% of lone groups have the same shift and
most groups have their turn compared to previous years and only 12% of the groups are
reduction.
Compared to the above results and to the southeast region, it was found that the northwestern
region is higher than the southeast region in terms of expansion of the group's turnover and
development speed.
Q6.5 Is more than 50 per cent of the business owned by women?
South East Region:
Row Labels
Response
s
Yes 22.52%
No 74.77%
Don't Know 2.70%
Grand Total 100.00%
Decreased 12.31%
Stayed the same 27.69%
Don't know 8.46%
Refused 2.31%
49%
12%
28%
8% 2%
Responses
Increased
Decreased
Stayed the same
Don't know
Refused
Interpretation: The pie chart above shows that 28% of lone groups have the same shift and
most groups have their turn compared to previous years and only 12% of the groups are
reduction.
Compared to the above results and to the southeast region, it was found that the northwestern
region is higher than the southeast region in terms of expansion of the group's turnover and
development speed.
Q6.5 Is more than 50 per cent of the business owned by women?
South East Region:
Row Labels
Response
s
Yes 22.52%
No 74.77%
Don't Know 2.70%
Grand Total 100.00%
23%
75%
3%
Total
Yes
No
Don't Know
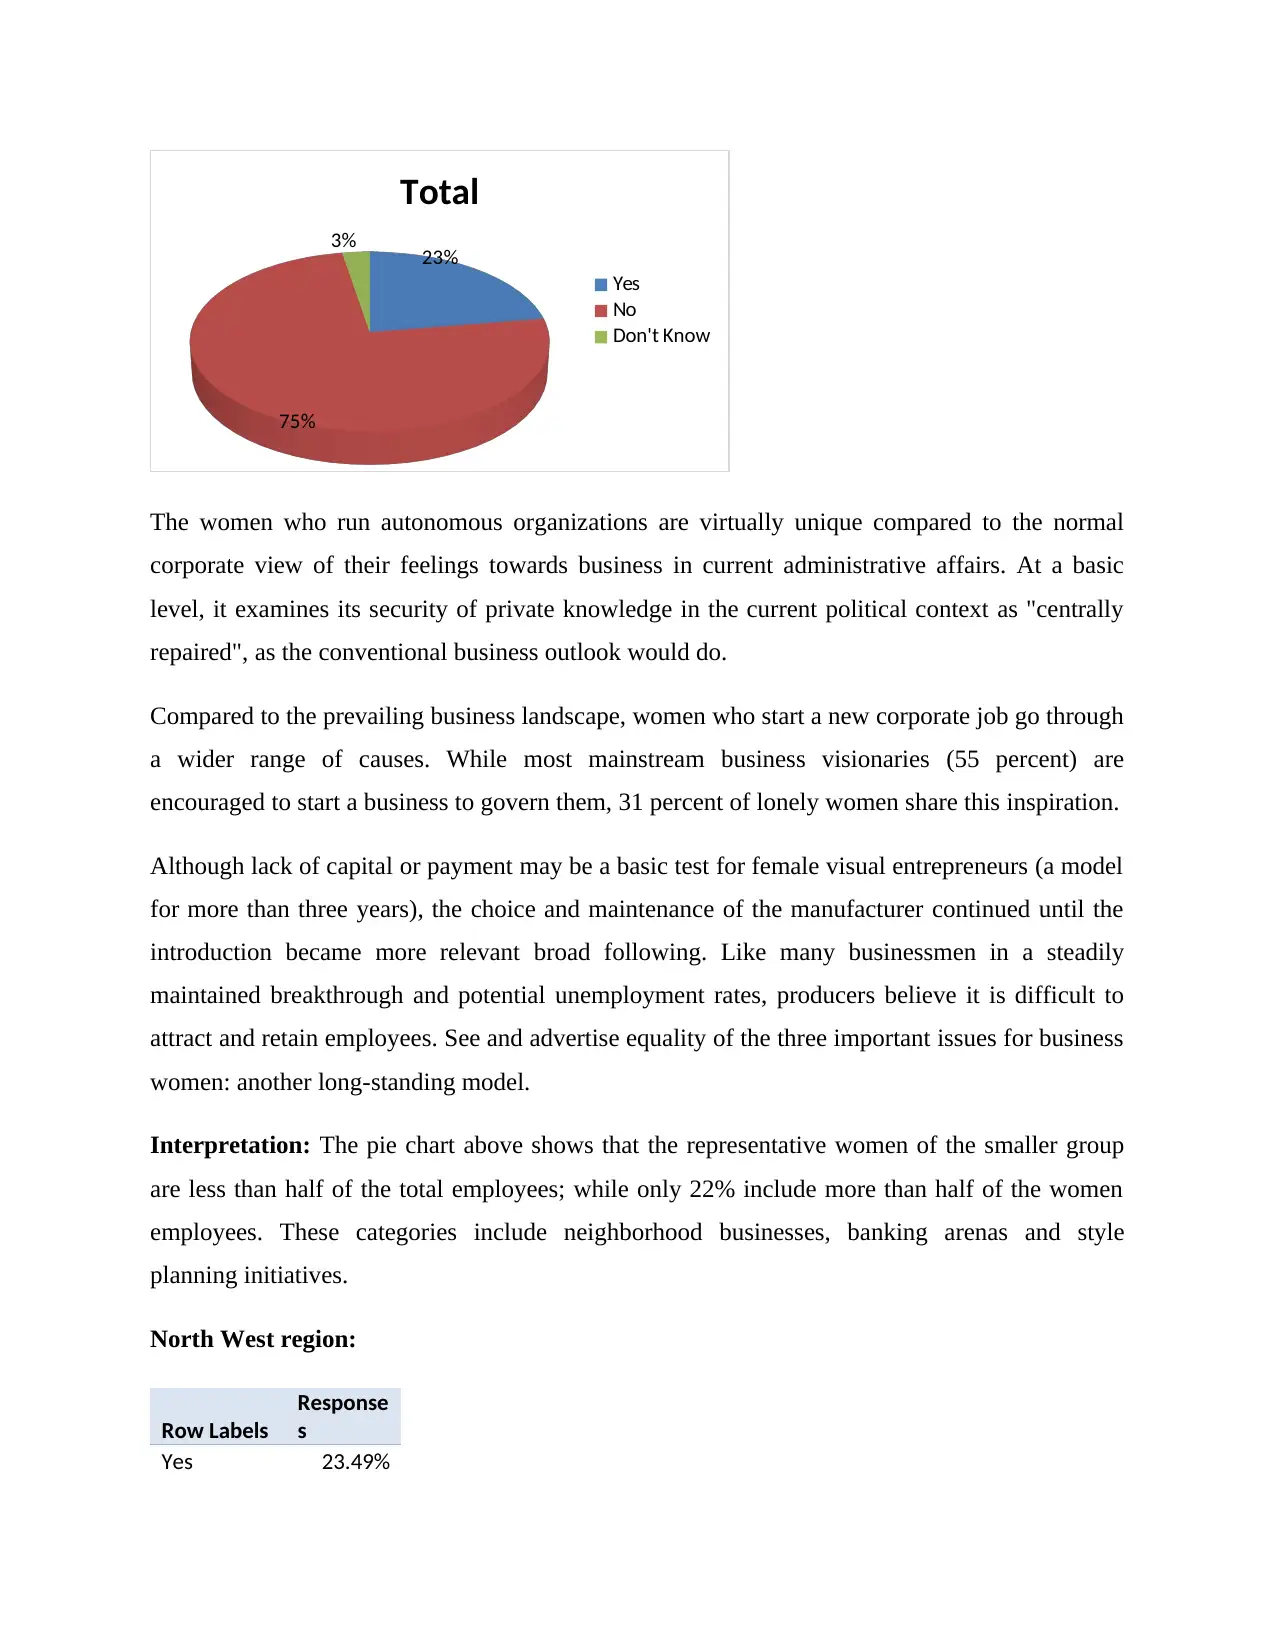
The women who run autonomous organizations are virtually unique compared to the normal
corporate view of their feelings towards business in current administrative affairs. At a basic
level, it examines its security of private knowledge in the current political context as "centrally
repaired", as the conventional business outlook would do.
Compared to the prevailing business landscape, women who start a new corporate job go through
a wider range of causes. While most mainstream business visionaries (55 percent) are
encouraged to start a business to govern them, 31 percent of lonely women share this inspiration.
Although lack of capital or payment may be a basic test for female visual entrepreneurs (a model
for more than three years), the choice and maintenance of the manufacturer continued until the
introduction became more relevant broad following. Like many businessmen in a steadily
maintained breakthrough and potential unemployment rates, producers believe it is difficult to
attract and retain employees. See and advertise equality of the three important issues for business
women: another long-standing model.
Interpretation: The pie chart above shows that the representative women of the smaller group
are less than half of the total employees; while only 22% include more than half of the women
employees. These categories include neighborhood businesses, banking arenas and style
planning initiatives.
North West region:
Row Labels
Response
s
Yes 23.49%
75%
3%
Total
Yes
No
Don't Know
The women who run autonomous organizations are virtually unique compared to the normal
corporate view of their feelings towards business in current administrative affairs. At a basic
level, it examines its security of private knowledge in the current political context as "centrally
repaired", as the conventional business outlook would do.
Compared to the prevailing business landscape, women who start a new corporate job go through
a wider range of causes. While most mainstream business visionaries (55 percent) are
encouraged to start a business to govern them, 31 percent of lonely women share this inspiration.
Although lack of capital or payment may be a basic test for female visual entrepreneurs (a model
for more than three years), the choice and maintenance of the manufacturer continued until the
introduction became more relevant broad following. Like many businessmen in a steadily
maintained breakthrough and potential unemployment rates, producers believe it is difficult to
attract and retain employees. See and advertise equality of the three important issues for business
women: another long-standing model.
Interpretation: The pie chart above shows that the representative women of the smaller group
are less than half of the total employees; while only 22% include more than half of the women
employees. These categories include neighborhood businesses, banking arenas and style
planning initiatives.
North West region:
Row Labels
Response
s
Yes 23.49%
Secure Best Marks with AI Grader
Need help grading? Try our AI Grader for instant feedback on your assignments.
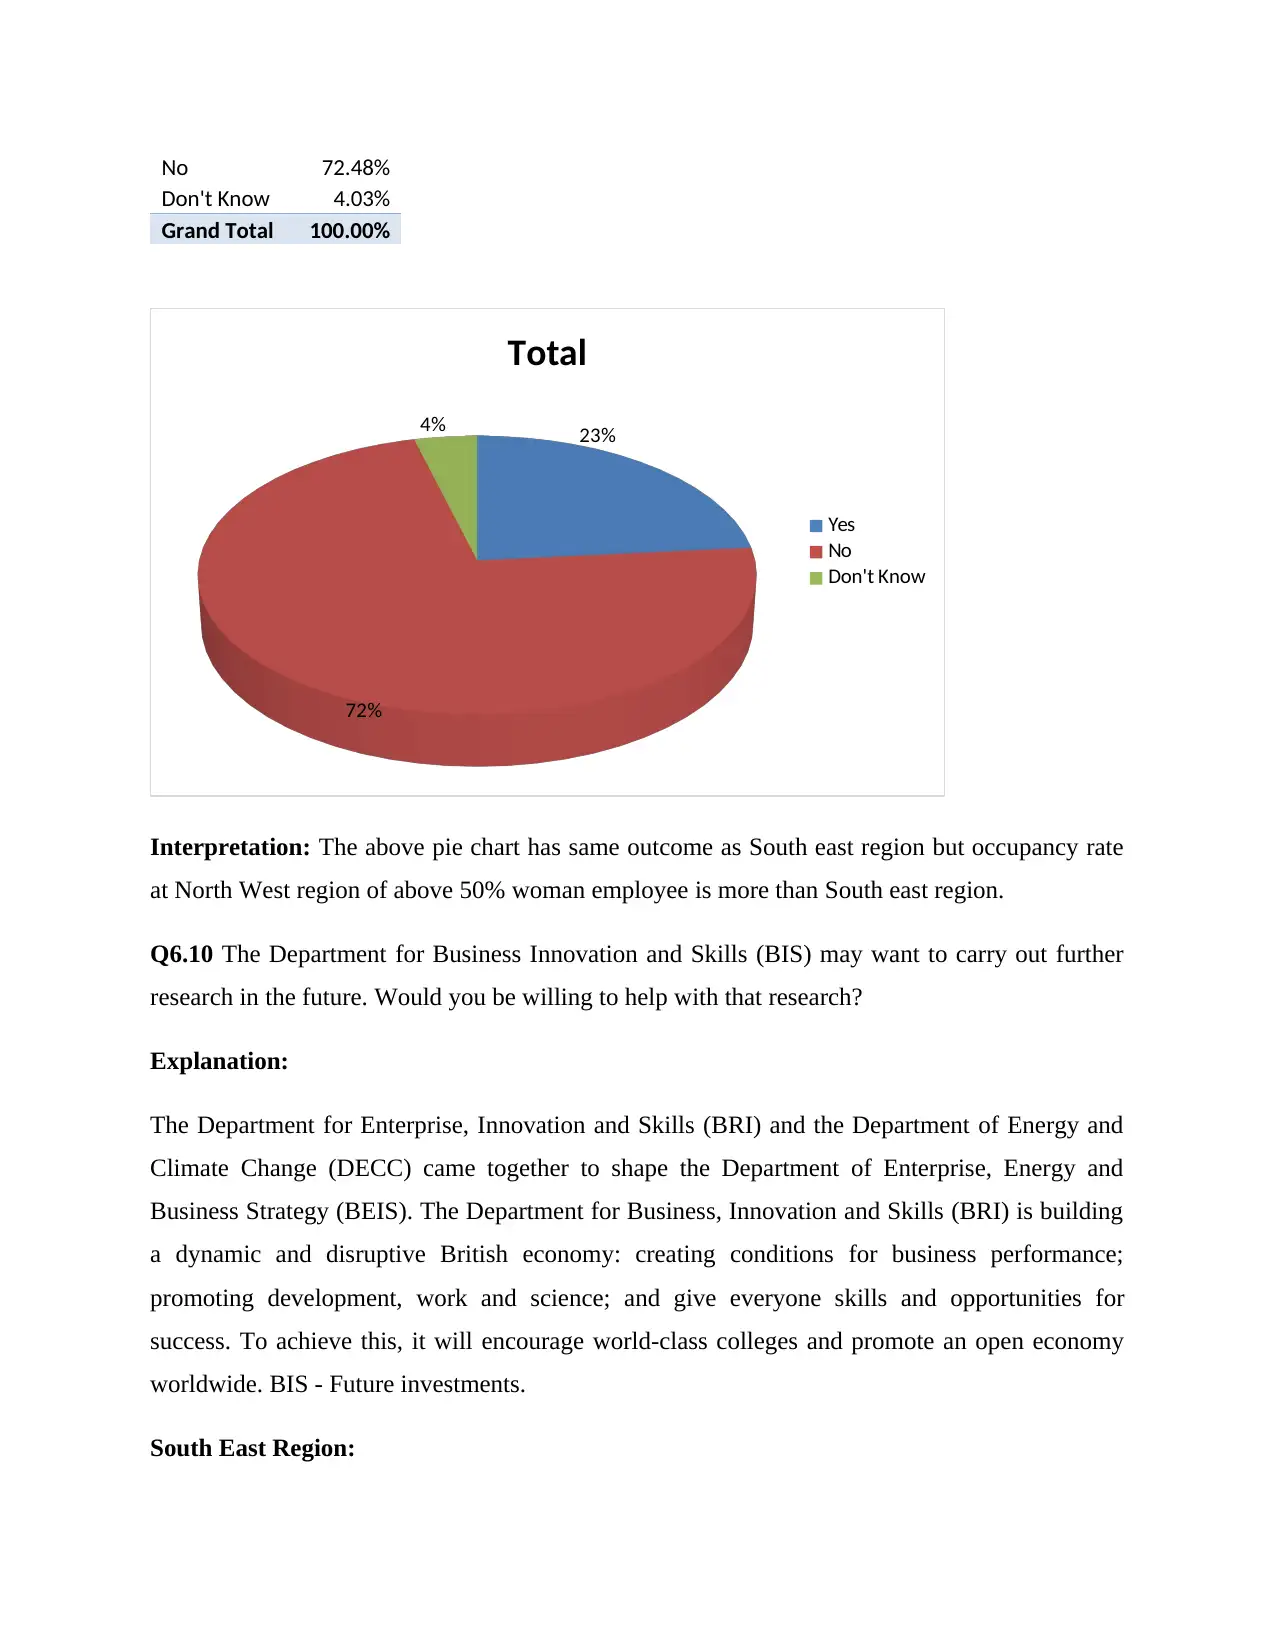
No 72.48%
Don't Know 4.03%
Grand Total 100.00%
23%
72%
4%
Total
Yes
No
Don't Know
Interpretation: The above pie chart has same outcome as South east region but occupancy rate
at North West region of above 50% woman employee is more than South east region.
Q6.10 The Department for Business Innovation and Skills (BIS) may want to carry out further
research in the future. Would you be willing to help with that research?
Explanation:
The Department for Enterprise, Innovation and Skills (BRI) and the Department of Energy and
Climate Change (DECC) came together to shape the Department of Enterprise, Energy and
Business Strategy (BEIS). The Department for Business, Innovation and Skills (BRI) is building
a dynamic and disruptive British economy: creating conditions for business performance;
promoting development, work and science; and give everyone skills and opportunities for
success. To achieve this, it will encourage world-class colleges and promote an open economy
worldwide. BIS - Future investments.
South East Region:
Row Labels
Response
s
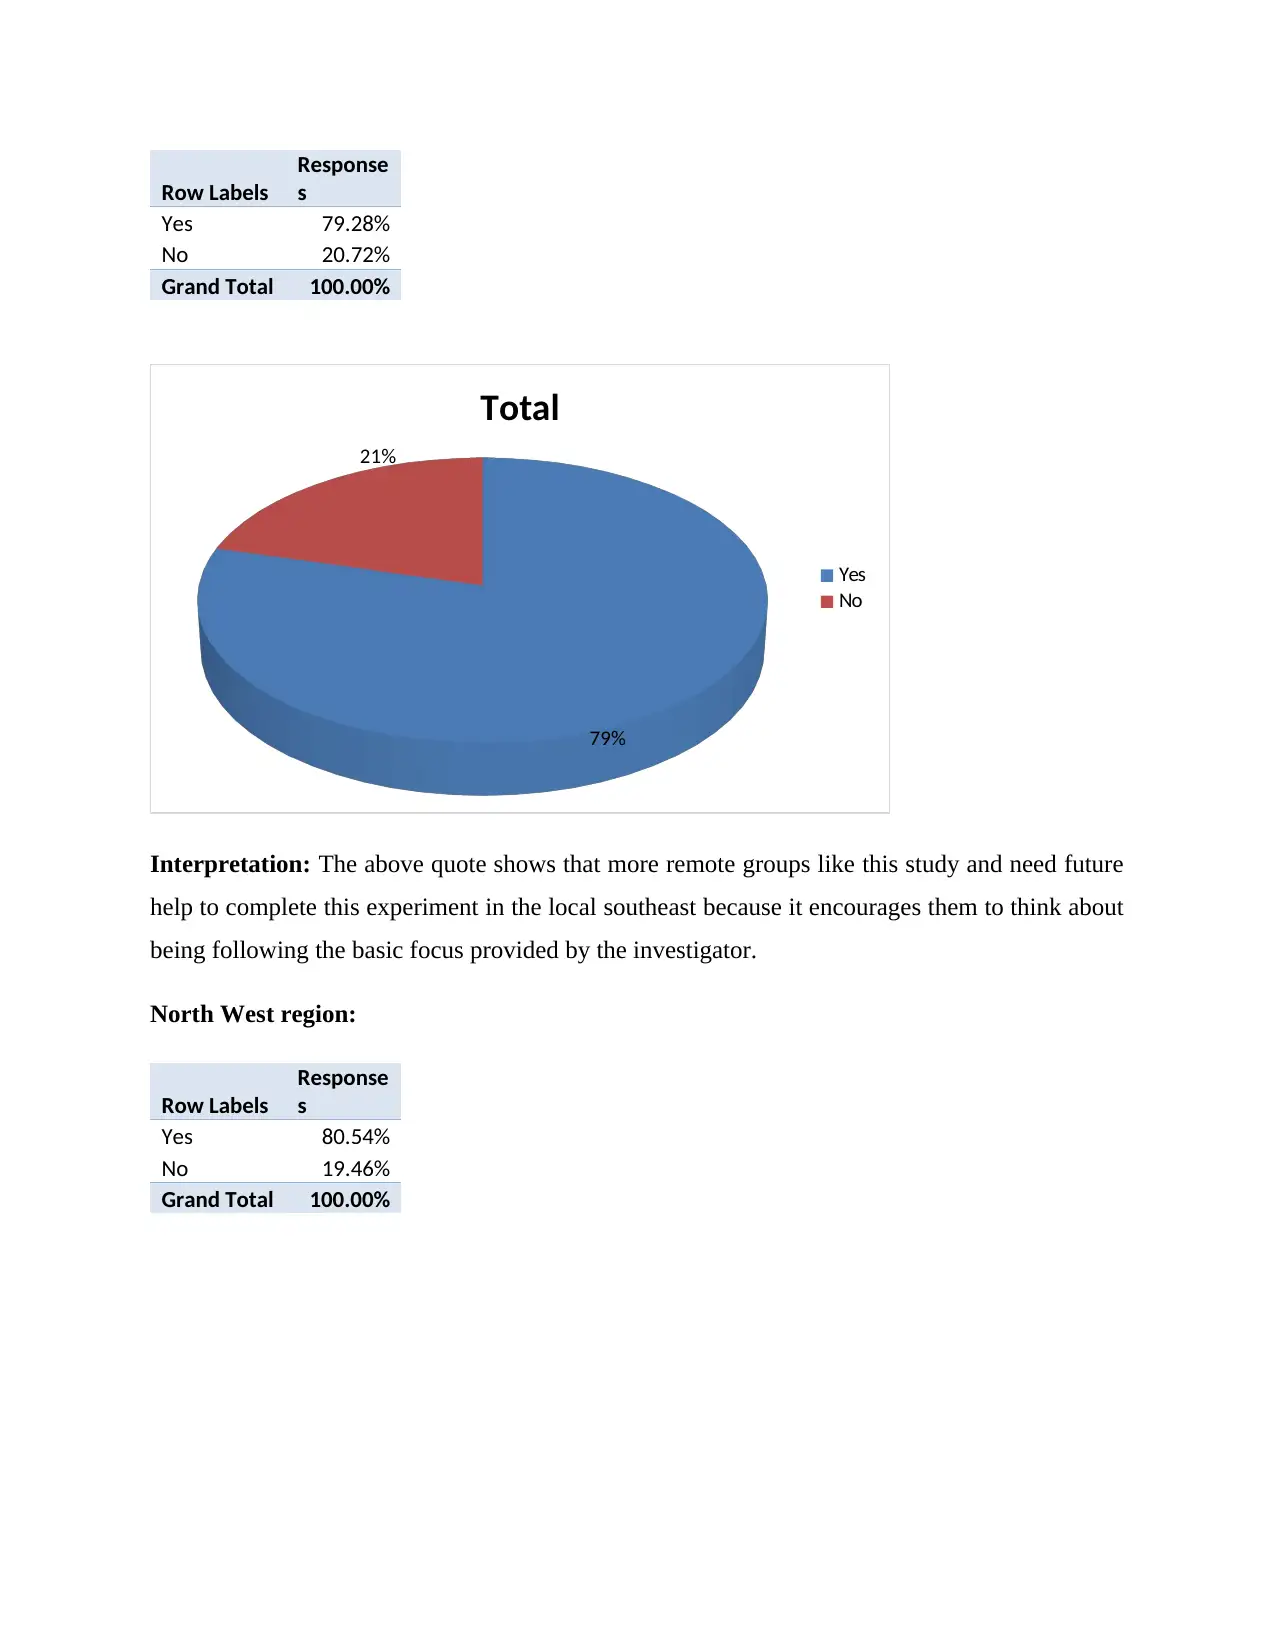
Yes 79.28%
No 20.72%
Grand Total 100.00%
79%
21%
Total
Yes
No
Interpretation: The above quote shows that more remote groups like this study and need future
help to complete this experiment in the local southeast because it encourages them to think about
being following the basic focus provided by the investigator.
North West region:
Row Labels
Response
s
Yes 80.54%
No 19.46%
Grand Total 100.00%
Response
s
Yes 79.28%
No 20.72%
Grand Total 100.00%
79%
21%
Total
Yes
No
Interpretation: The above quote shows that more remote groups like this study and need future
help to complete this experiment in the local southeast because it encourages them to think about
being following the basic focus provided by the investigator.
North West region:
Row Labels
Response
s
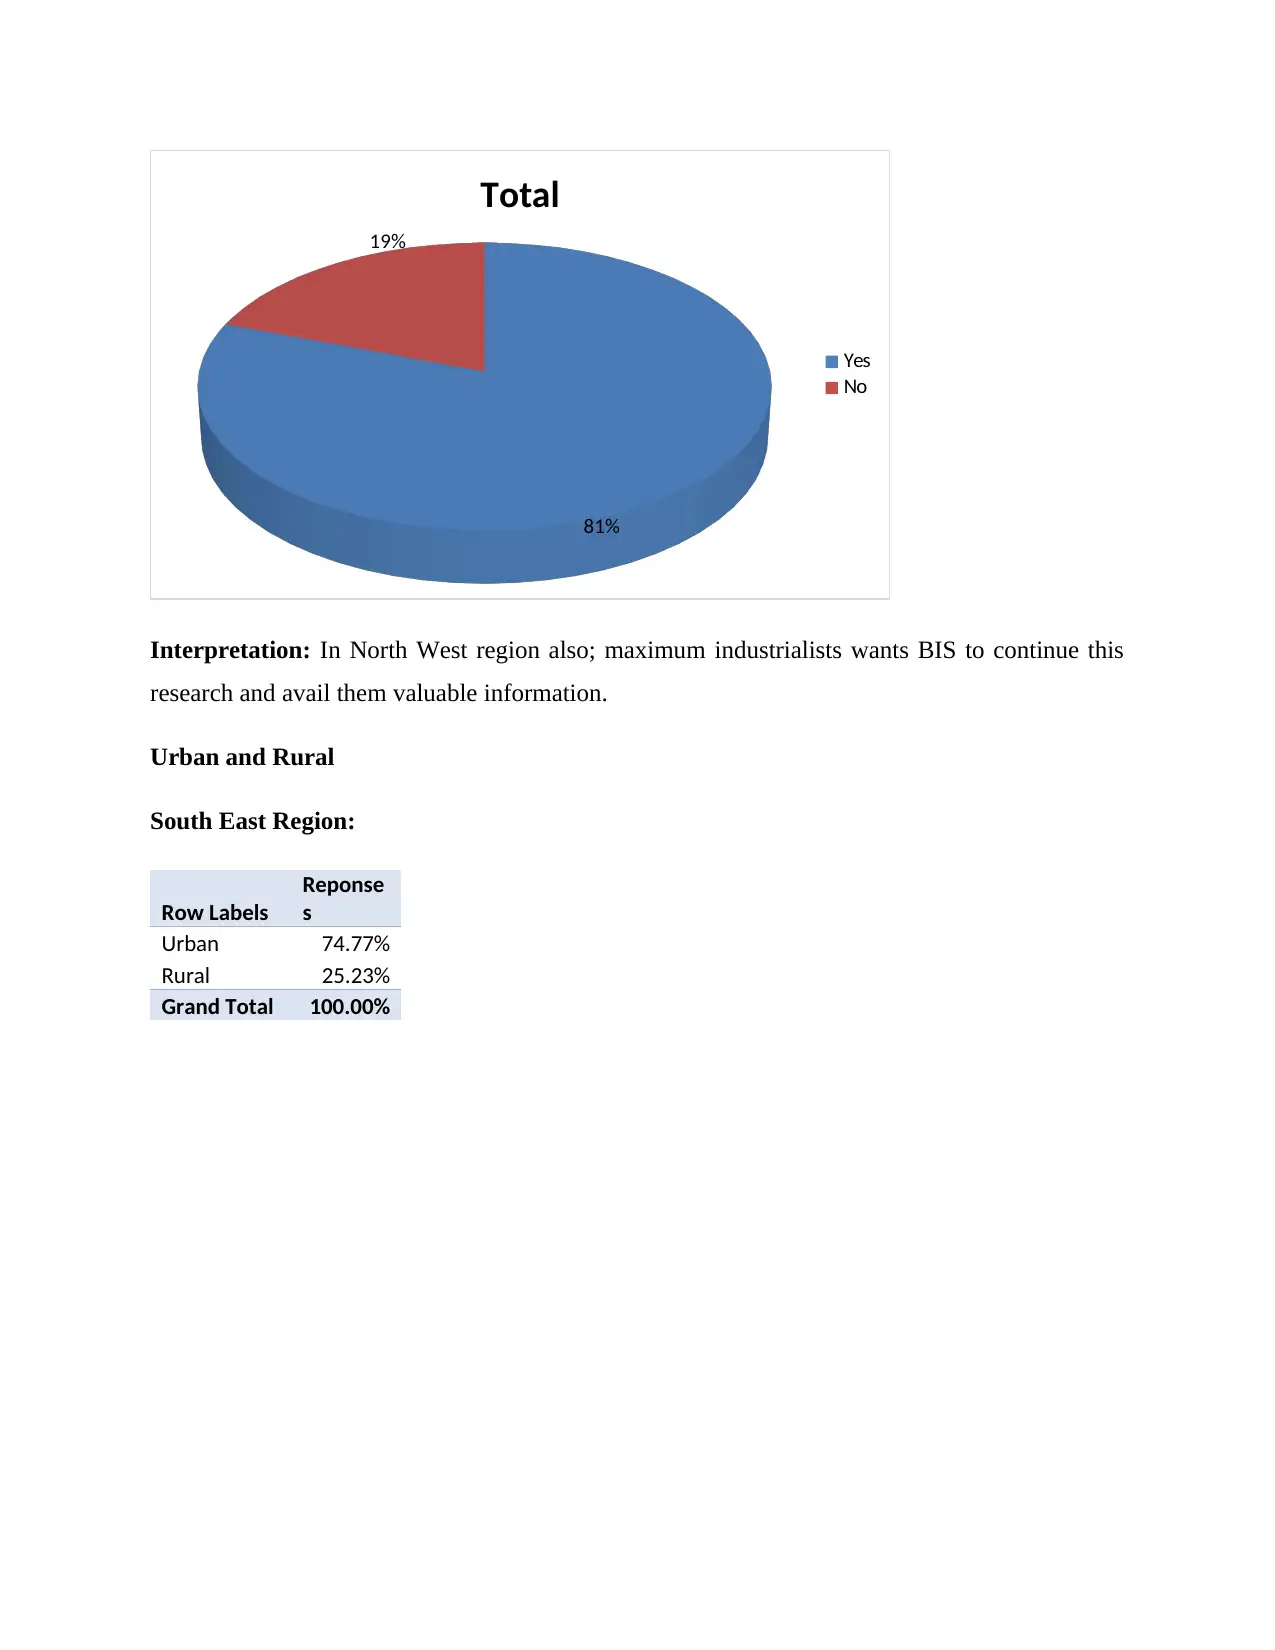
Yes 80.54%
No 19.46%
Grand Total 100.00%
81%
19%
Total
Yes
No
Interpretation: In North West region also; maximum industrialists wants BIS to continue this
research and avail them valuable information.
Urban and Rural
South East Region:
Row Labels
Reponse
s
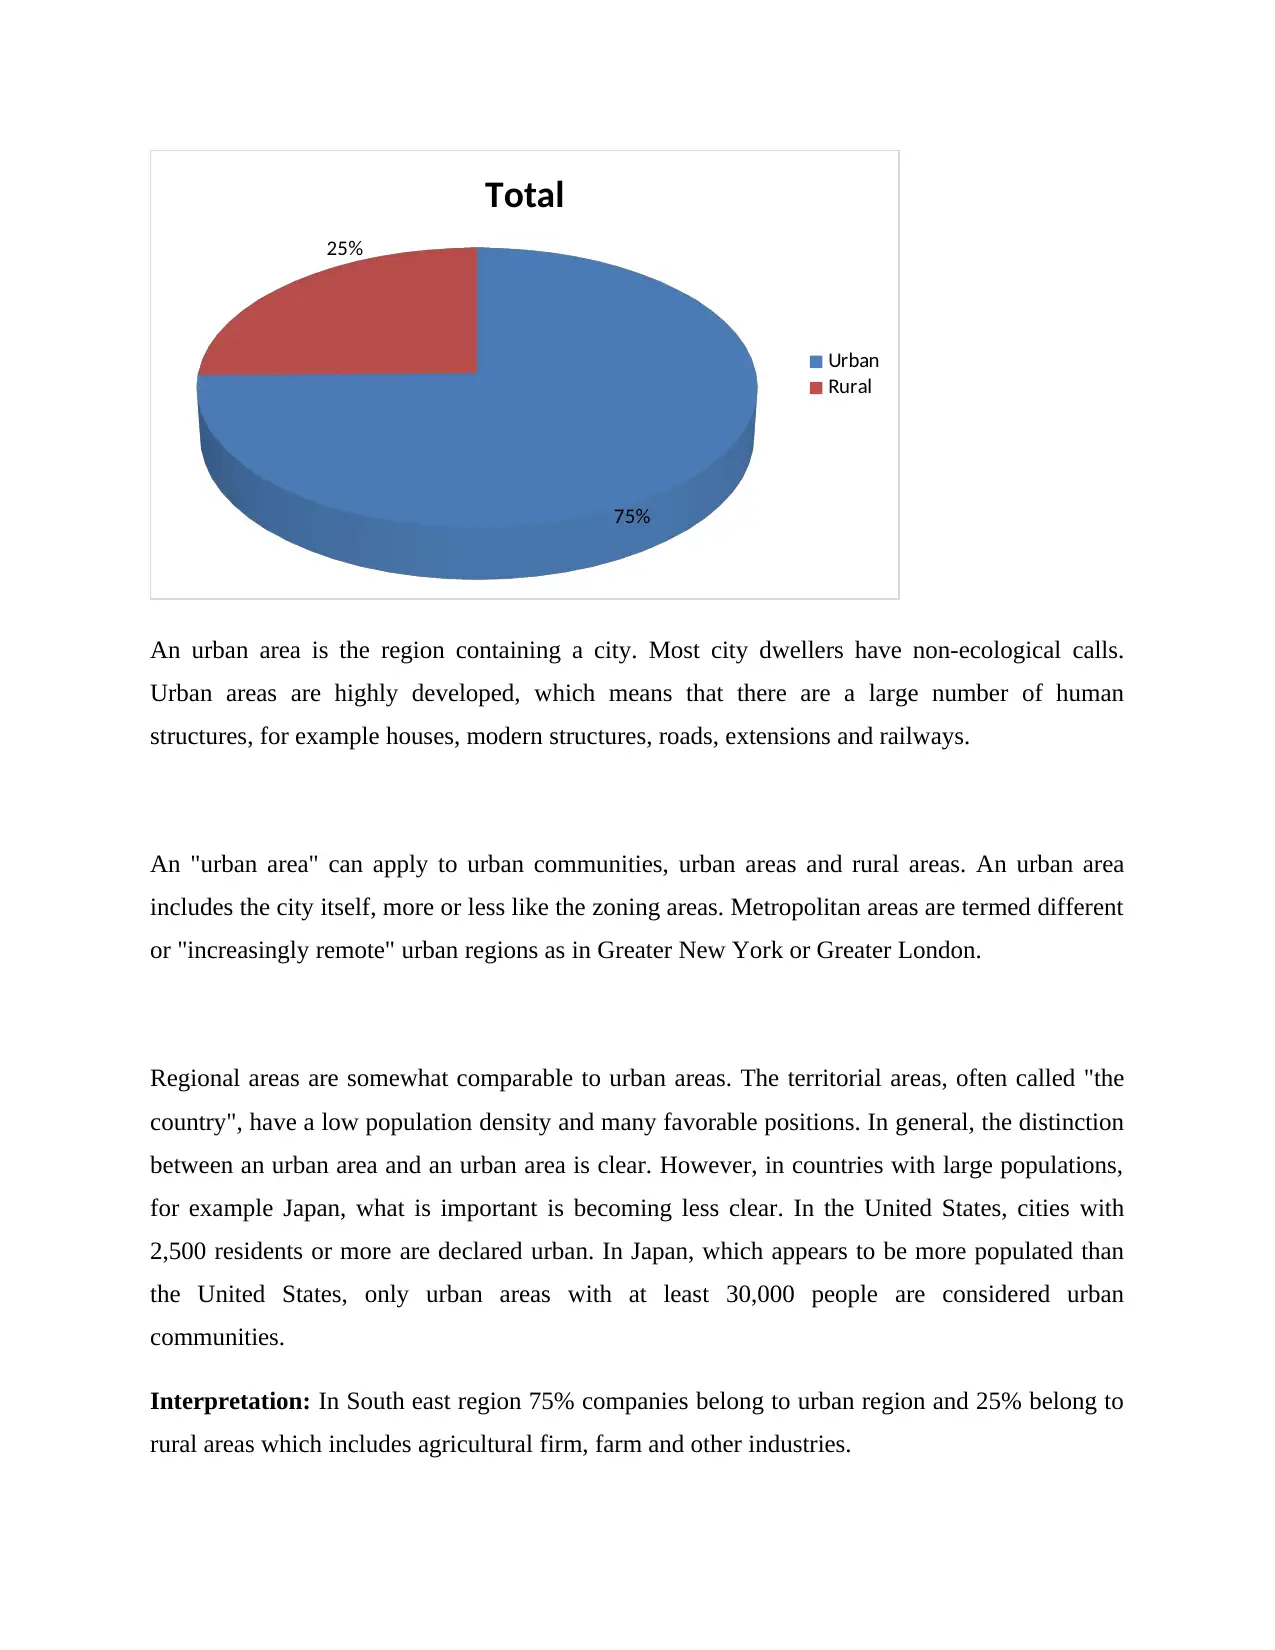
Urban 74.77%
Rural 25.23%
Grand Total 100.00%
19%
Total
Yes
No
Interpretation: In North West region also; maximum industrialists wants BIS to continue this
research and avail them valuable information.
Urban and Rural
South East Region:
Row Labels
Reponse
s
Urban 74.77%
Rural 25.23%
Grand Total 100.00%
Paraphrase This Document
Need a fresh take? Get an instant paraphrase of this document with our AI Paraphraser
75%
25%
Total
Urban
Rural
An urban area is the region containing a city. Most city dwellers have non-ecological calls.
Urban areas are highly developed, which means that there are a large number of human
structures, for example houses, modern structures, roads, extensions and railways.
An "urban area" can apply to urban communities, urban areas and rural areas. An urban area
includes the city itself, more or less like the zoning areas. Metropolitan areas are termed different
or "increasingly remote" urban regions as in Greater New York or Greater London.
Regional areas are somewhat comparable to urban areas. The territorial areas, often called "the
country", have a low population density and many favorable positions. In general, the distinction
between an urban area and an urban area is clear. However, in countries with large populations,
for example Japan, what is important is becoming less clear. In the United States, cities with
2,500 residents or more are declared urban. In Japan, which appears to be more populated than
the United States, only urban areas with at least 30,000 people are considered urban
communities.
Interpretation: In South east region 75% companies belong to urban region and 25% belong to
rural areas which includes agricultural firm, farm and other industries.
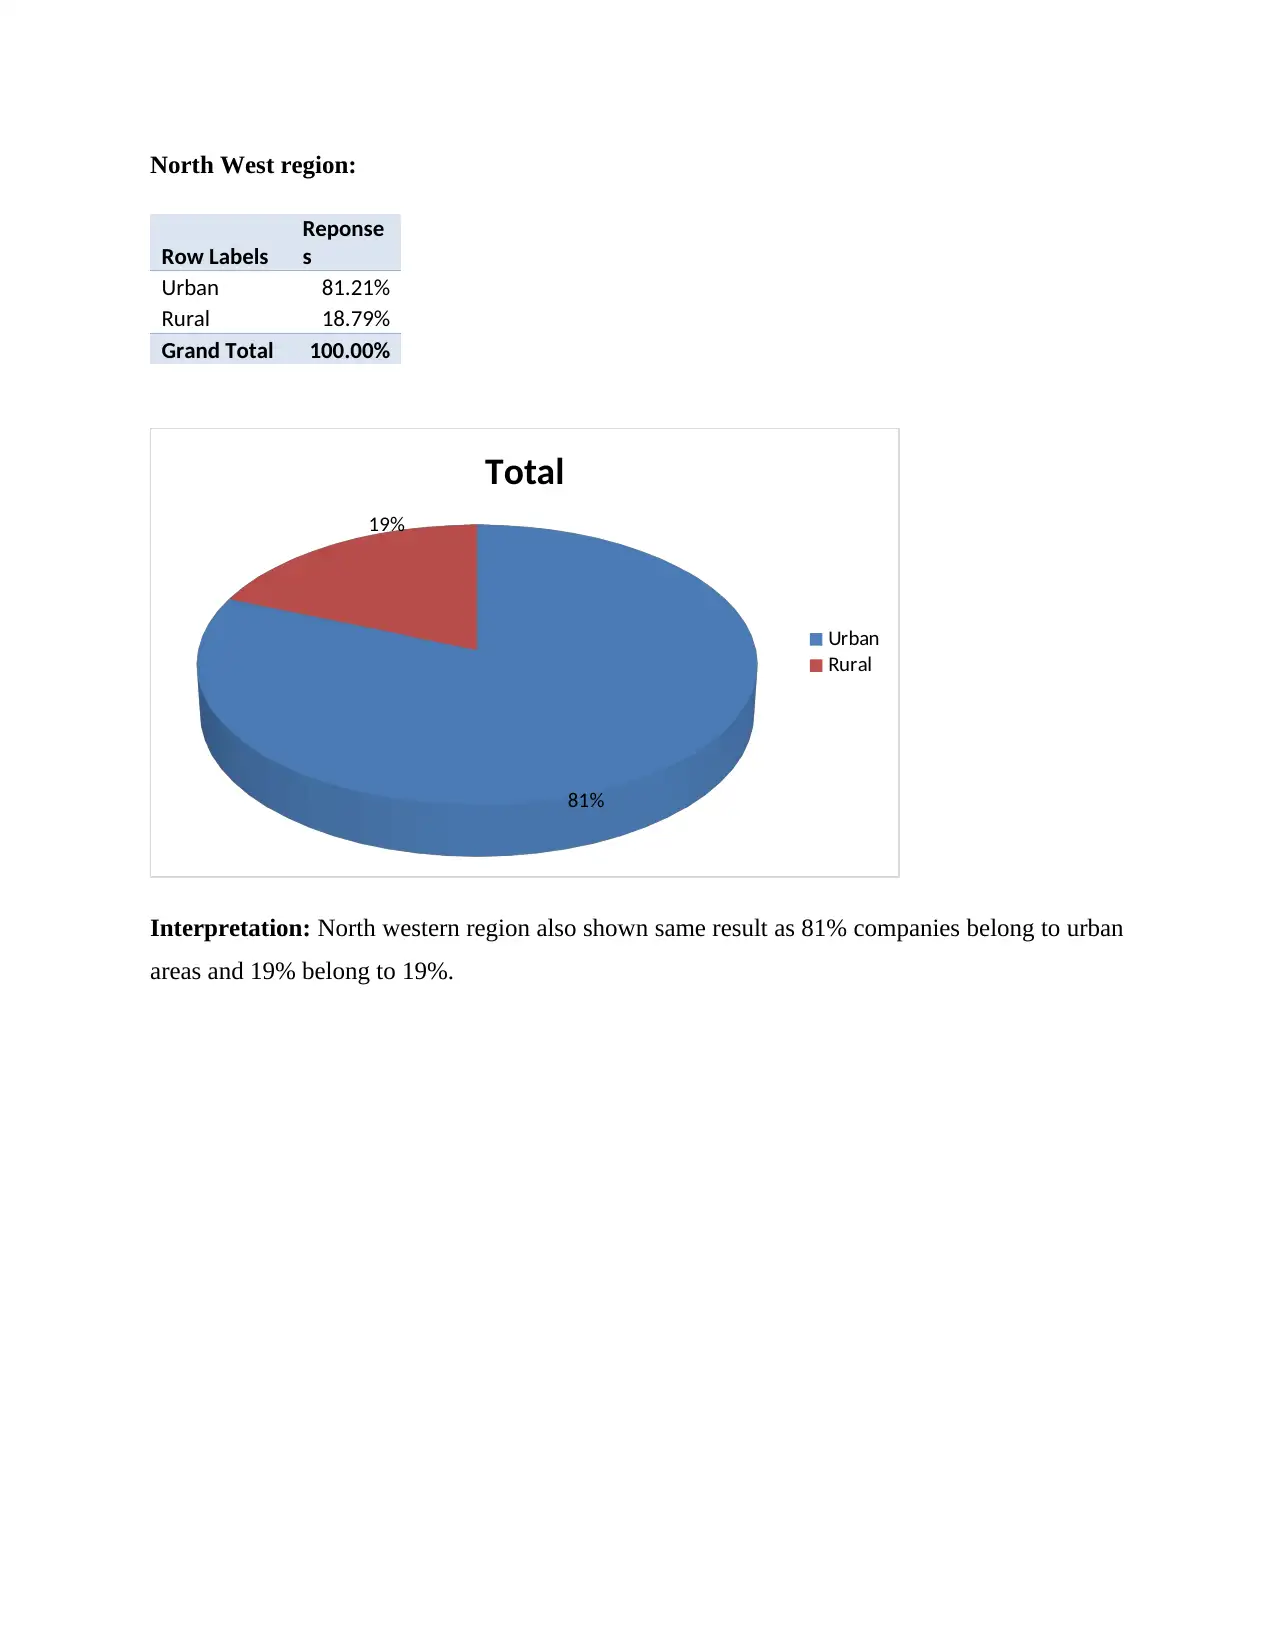
North West region:
Row Labels
Reponse
s
Urban 81.21%
Rural 18.79%
Grand Total 100.00%
81%
19%
Total
Urban
Rural
Interpretation: North western region also shown same result as 81% companies belong to urban
areas and 19% belong to 19%.
Row Labels
Reponse
s
Urban 81.21%
Rural 18.79%
Grand Total 100.00%
81%
19%
Total
Urban
Rural
Interpretation: North western region also shown same result as 81% companies belong to urban
areas and 19% belong to 19%.
1 out of 21


Your All-in-One AI-Powered Toolkit for Academic Success.
+13062052269
info@desklib.com
Available 24*7 on WhatsApp / Email
![[object Object]](/_next/static/media/star-bottom.7253800d.svg)
Unlock your academic potential
© 2024 | Zucol Services PVT LTD | All rights reserved.