BIS Data Analysis: Identifying Barriers to Business Support (Report)
VerifiedAdded on 2023/01/11
|14
|2295
|93
Report
AI Summary
This report presents an analysis of BIS data, focusing on identifying barriers that prevent businesses from utilizing available support services. The study concentrates on a comparative analysis between the South East and North West regions of the UK, utilizing Microsoft Excel for data processing and analysis, including filtering and pivot tables. The analysis examines variables such as urban/rural distribution, types of business ownership, and the extent of public sector support usage. Key findings reveal that the South East region has a higher concentration of businesses and a greater inclination towards using public services, particularly Business Link. The report further investigates barriers, highlighting the impact of business owner's mindset and the role of female ownership in influencing the uptake of business support. The conclusion presents these key insights and suggests the need for further investigation by the Chief Research Analyst.
BIS Data analysis
Paraphrase This Document
Need a fresh take? Get an instant paraphrase of this document with our AI Paraphraser

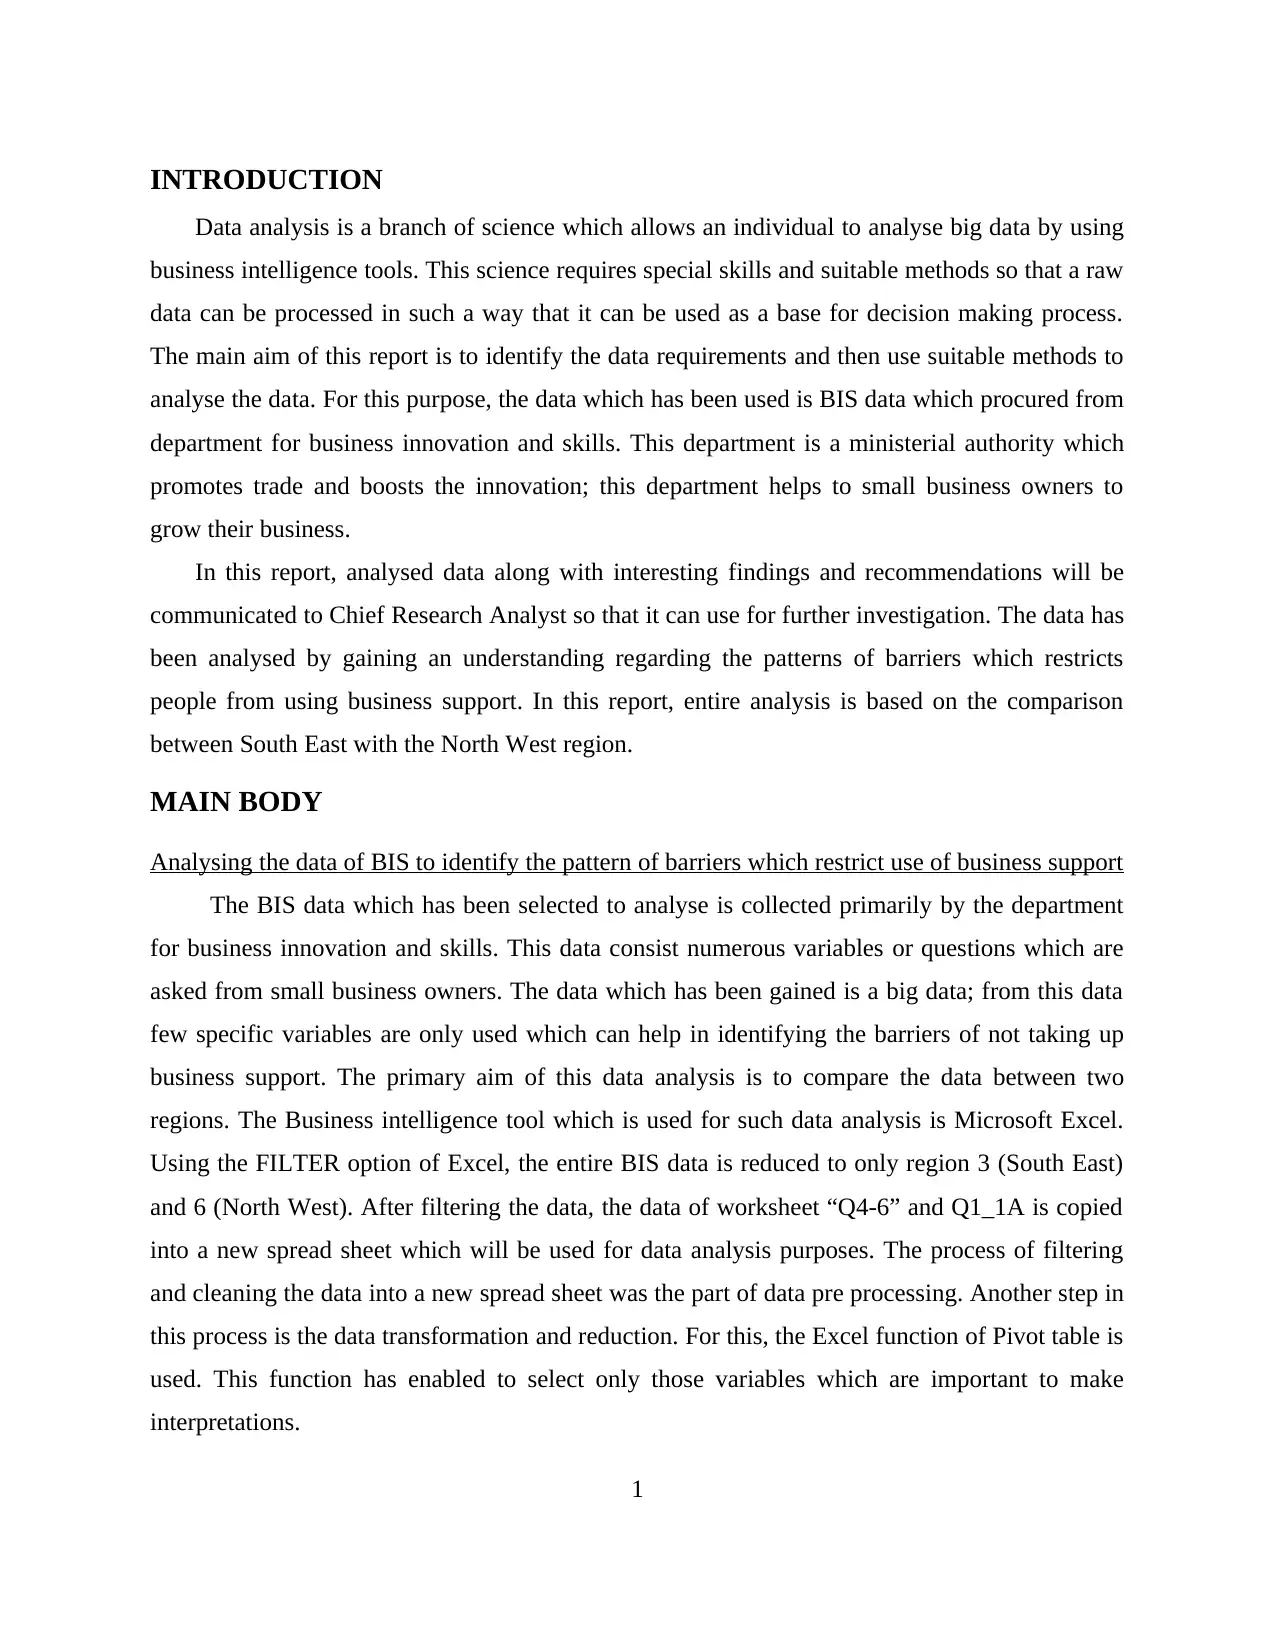
INTRODUCTION
Data analysis is a branch of science which allows an individual to analyse big data by using
business intelligence tools. This science requires special skills and suitable methods so that a raw
data can be processed in such a way that it can be used as a base for decision making process.
The main aim of this report is to identify the data requirements and then use suitable methods to
analyse the data. For this purpose, the data which has been used is BIS data which procured from
department for business innovation and skills. This department is a ministerial authority which
promotes trade and boosts the innovation; this department helps to small business owners to
grow their business.
In this report, analysed data along with interesting findings and recommendations will be
communicated to Chief Research Analyst so that it can use for further investigation. The data has
been analysed by gaining an understanding regarding the patterns of barriers which restricts
people from using business support. In this report, entire analysis is based on the comparison
between South East with the North West region.
MAIN BODY
Analysing the data of BIS to identify the pattern of barriers which restrict use of business support
The BIS data which has been selected to analyse is collected primarily by the department
for business innovation and skills. This data consist numerous variables or questions which are
asked from small business owners. The data which has been gained is a big data; from this data
few specific variables are only used which can help in identifying the barriers of not taking up
business support. The primary aim of this data analysis is to compare the data between two
regions. The Business intelligence tool which is used for such data analysis is Microsoft Excel.
Using the FILTER option of Excel, the entire BIS data is reduced to only region 3 (South East)
and 6 (North West). After filtering the data, the data of worksheet “Q4-6” and Q1_1A is copied
into a new spread sheet which will be used for data analysis purposes. The process of filtering
and cleaning the data into a new spread sheet was the part of data pre processing. Another step in
this process is the data transformation and reduction. For this, the Excel function of Pivot table is
used. This function has enabled to select only those variables which are important to make
interpretations.
1
⊘ This is a preview!⊘
Do you want full access?
Subscribe today to unlock all pages.
Trusted by 1+ million students worldwide
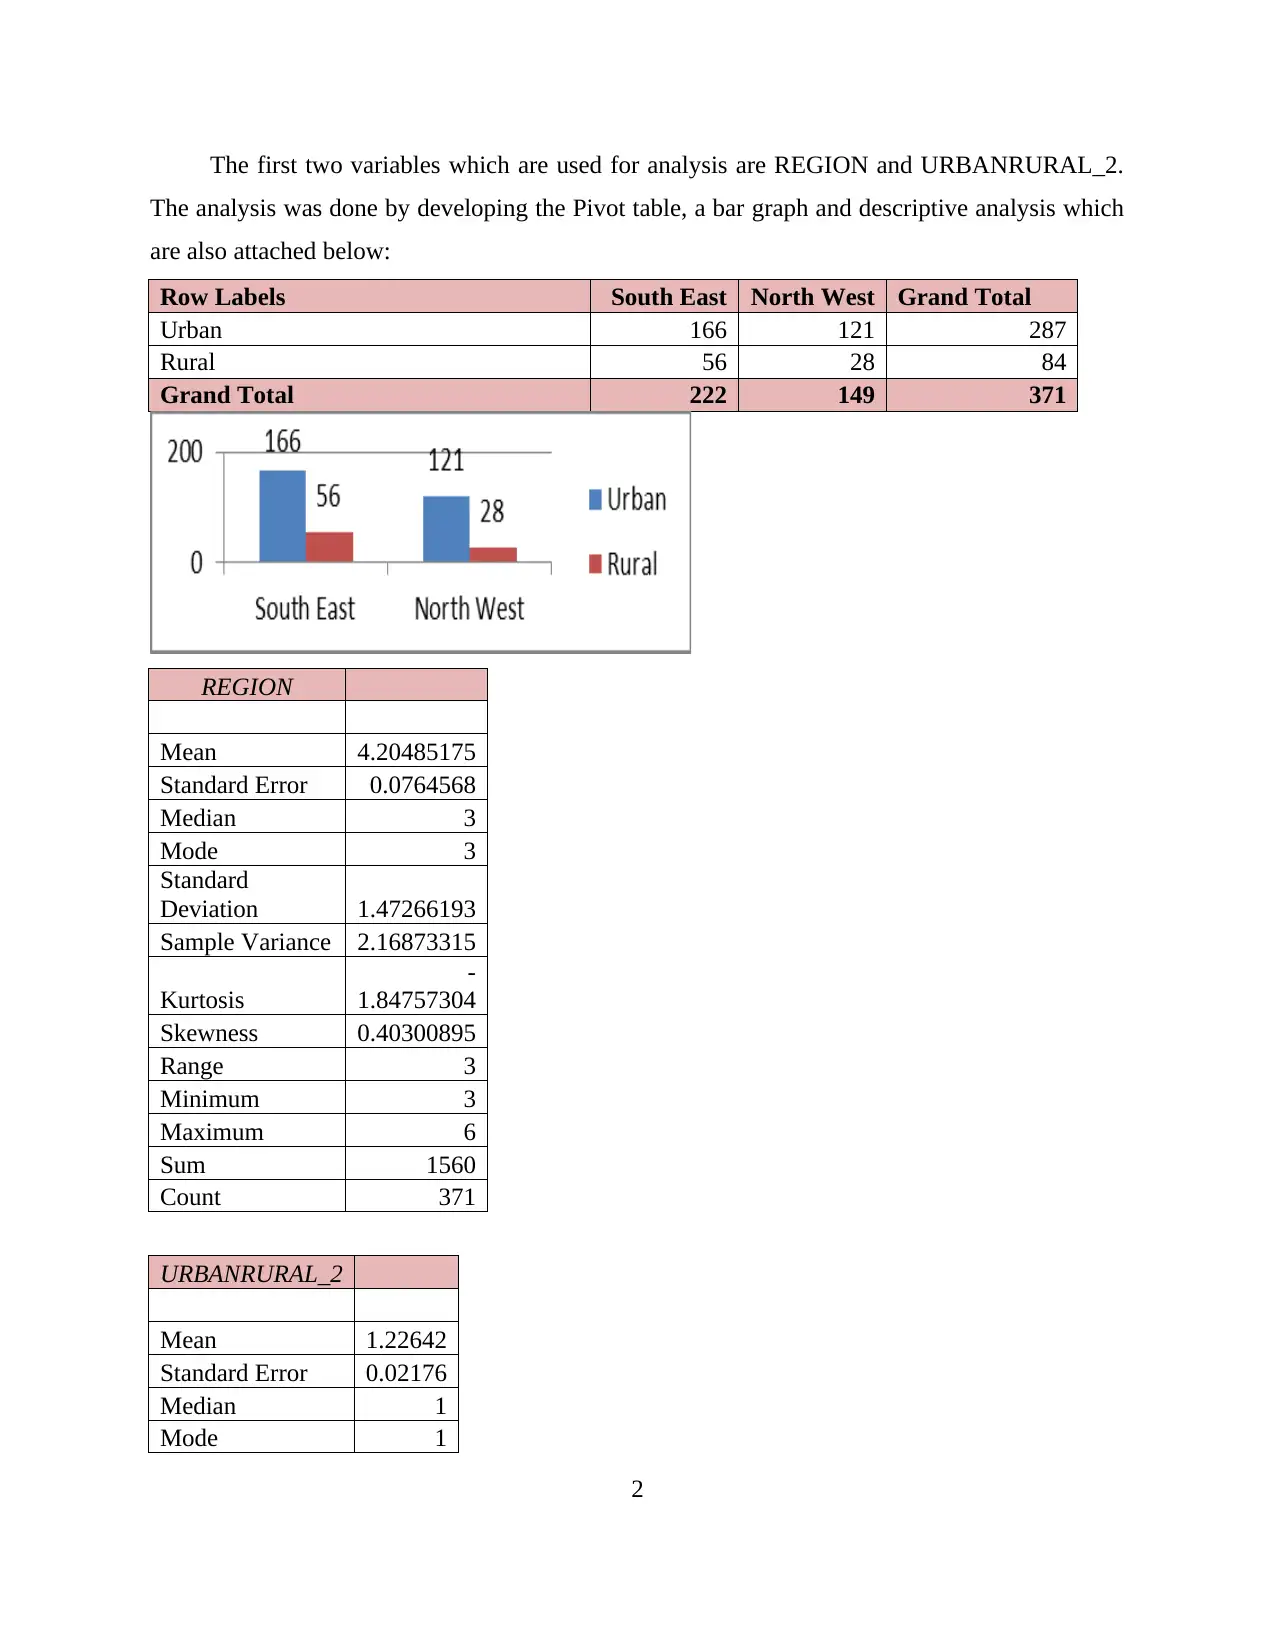
The first two variables which are used for analysis are REGION and URBANRURAL_2.
The analysis was done by developing the Pivot table, a bar graph and descriptive analysis which
are also attached below:
Row Labels South East North West Grand Total
Urban 166 121 287
Rural 56 28 84
Grand Total 222 149 371
REGION
Mean 4.20485175
Standard Error 0.0764568
Median 3
Mode 3
Standard
Deviation 1.47266193
Sample Variance 2.16873315
Kurtosis
-
1.84757304
Skewness 0.40300895
Range 3
Minimum 3
Maximum 6
Sum 1560
Count 371
URBANRURAL_2
Mean 1.22642
Standard Error 0.02176
Median 1
Mode 1
2
Paraphrase This Document
Need a fresh take? Get an instant paraphrase of this document with our AI Paraphraser
Standard
Deviation 0.41908
Sample Variance 0.17562
Kurtosis -0.2783
Skewness 1.31273
Range 1
Minimum 1
Maximum 2
Sum 455
Count 371
From the above data analysis tables and graphs, it has been interpreted that total number
of businesses in South East region is 222 and in North West region is 149. This made clear that
South East region is more industrialisation oriented. The percentage of having urban business is
higher in North West region and the percentage of having high rural and traditional businesses is
higher in South East.
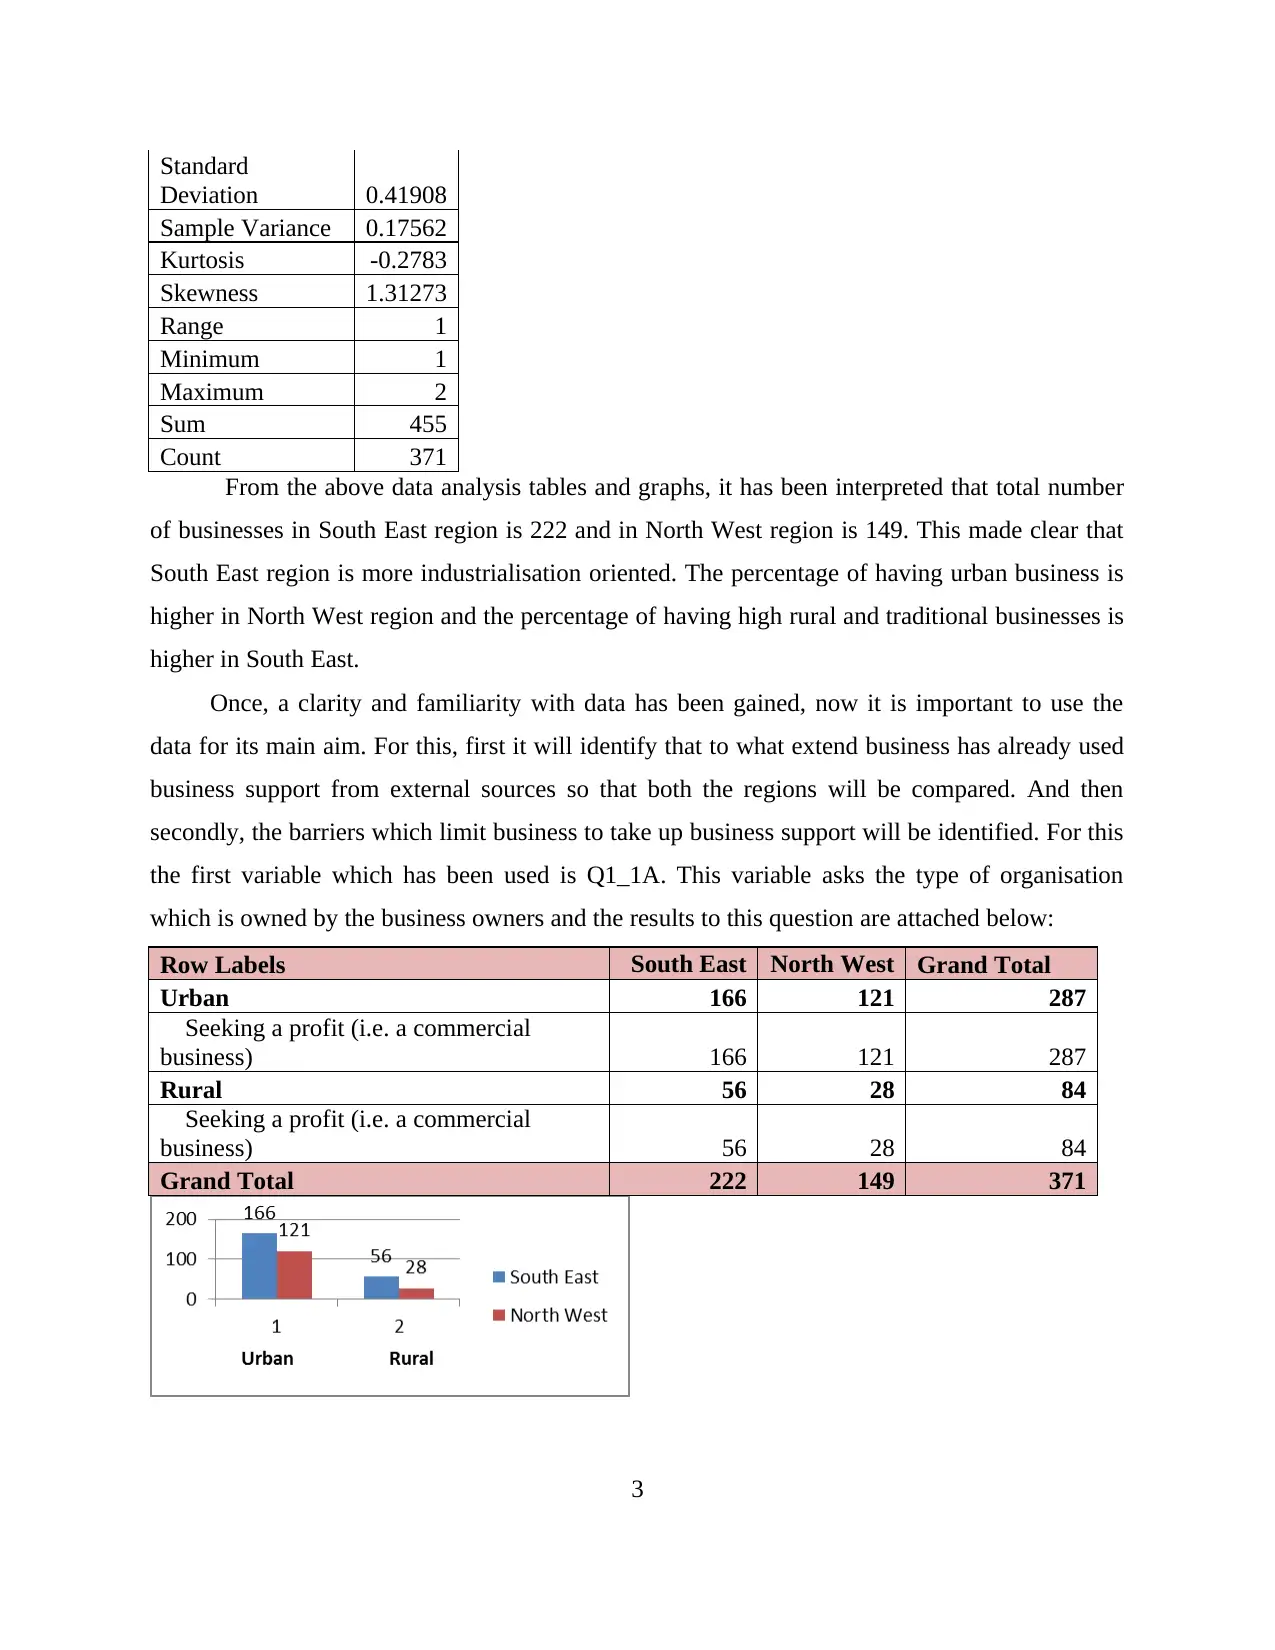
Once, a clarity and familiarity with data has been gained, now it is important to use the
data for its main aim. For this, first it will identify that to what extend business has already used
business support from external sources so that both the regions will be compared. And then
secondly, the barriers which limit business to take up business support will be identified. For this
the first variable which has been used is Q1_1A. This variable asks the type of organisation
which is owned by the business owners and the results to this question are attached below:
Row Labels South East North West Grand Total
Urban 166 121 287
Seeking a profit (i.e. a commercial
business) 166 121 287
Rural 56 28 84
Seeking a profit (i.e. a commercial
business) 56 28 84
Grand Total 222 149 371
3
Deviation 0.41908
Sample Variance 0.17562
Kurtosis -0.2783
Skewness 1.31273
Range 1
Minimum 1
Maximum 2
Sum 455
Count 371
From the above data analysis tables and graphs, it has been interpreted that total number
of businesses in South East region is 222 and in North West region is 149. This made clear that
South East region is more industrialisation oriented. The percentage of having urban business is
higher in North West region and the percentage of having high rural and traditional businesses is
higher in South East.
Once, a clarity and familiarity with data has been gained, now it is important to use the
data for its main aim. For this, first it will identify that to what extend business has already used
business support from external sources so that both the regions will be compared. And then
secondly, the barriers which limit business to take up business support will be identified. For this
the first variable which has been used is Q1_1A. This variable asks the type of organisation
which is owned by the business owners and the results to this question are attached below:
Row Labels South East North West Grand Total
Urban 166 121 287
Seeking a profit (i.e. a commercial
business) 166 121 287
Rural 56 28 84
Seeking a profit (i.e. a commercial
business) 56 28 84
Grand Total 222 149 371
3
From the above analysis, it has been seen that every business in South East and Noth West
region is a profit making business only due to which the results of both the tables above is
similar.
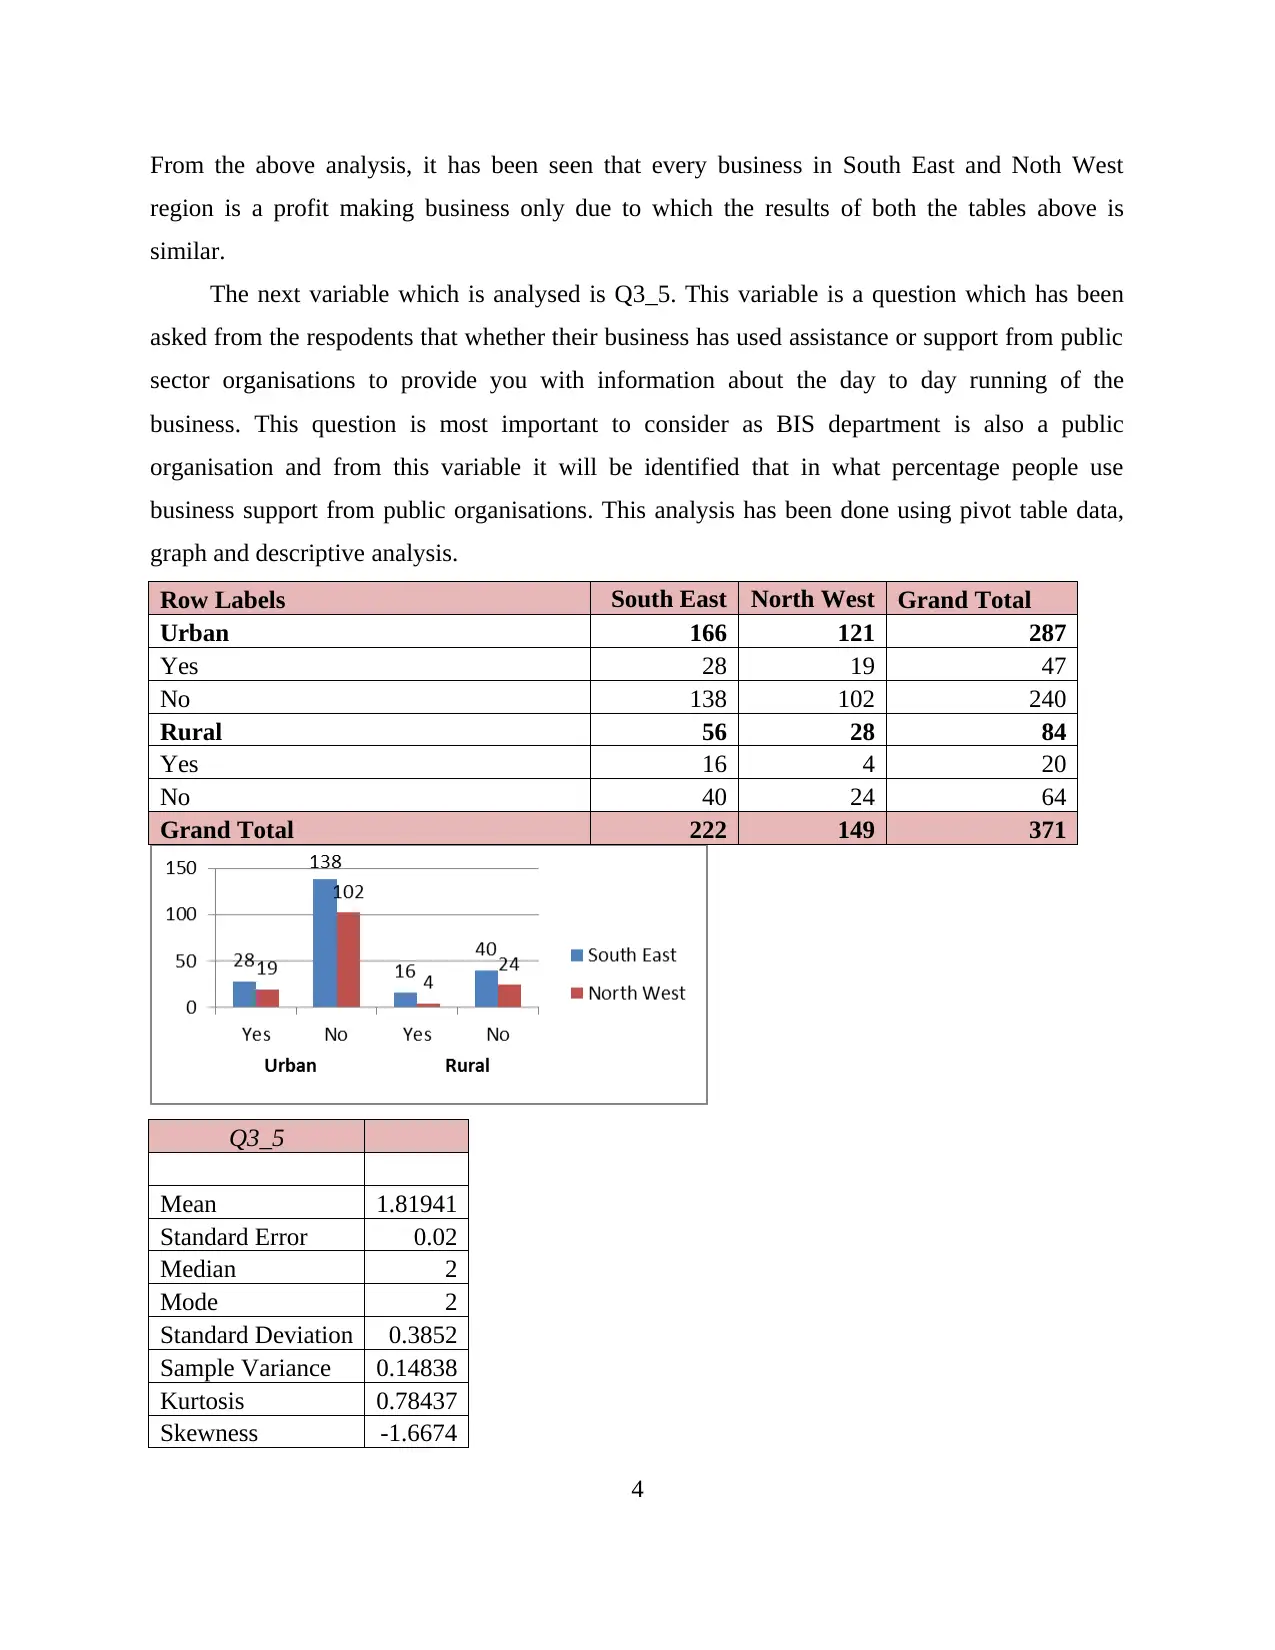
The next variable which is analysed is Q3_5. This variable is a question which has been
asked from the respodents that whether their business has used assistance or support from public
sector organisations to provide you with information about the day to day running of the
business. This question is most important to consider as BIS department is also a public
organisation and from this variable it will be identified that in what percentage people use
business support from public organisations. This analysis has been done using pivot table data,
graph and descriptive analysis.
Row Labels South East North West Grand Total
Urban 166 121 287
Yes 28 19 47
No 138 102 240
Rural 56 28 84
Yes 16 4 20
No 40 24 64
Grand Total 222 149 371
Q3_5
Mean 1.81941
Standard Error 0.02
Median 2
Mode 2
Standard Deviation 0.3852
Sample Variance 0.14838
Kurtosis 0.78437
Skewness -1.6674
4
region is a profit making business only due to which the results of both the tables above is
similar.
The next variable which is analysed is Q3_5. This variable is a question which has been
asked from the respodents that whether their business has used assistance or support from public
sector organisations to provide you with information about the day to day running of the
business. This question is most important to consider as BIS department is also a public
organisation and from this variable it will be identified that in what percentage people use
business support from public organisations. This analysis has been done using pivot table data,
graph and descriptive analysis.
Row Labels South East North West Grand Total
Urban 166 121 287
Yes 28 19 47
No 138 102 240
Rural 56 28 84
Yes 16 4 20
No 40 24 64
Grand Total 222 149 371
Q3_5
Mean 1.81941
Standard Error 0.02
Median 2
Mode 2
Standard Deviation 0.3852
Sample Variance 0.14838
Kurtosis 0.78437
Skewness -1.6674
4
⊘ This is a preview!⊘
Do you want full access?
Subscribe today to unlock all pages.
Trusted by 1+ million students worldwide
Range 1
Minimum 1
Maximum 2
Sum 675
Count 371
From the above graph, it has been clear that the response “NO” is much common than
“YES”. The South East region with high number of rural business has higher percentage of
businesses which has used business support from public organisations than North West region.
This interpretation is a clear point of distinction between the regions. The reason behind this
distinction is that rural businesses have low skilled personnel due to which they believe in
gaining external assistance for their business issues.
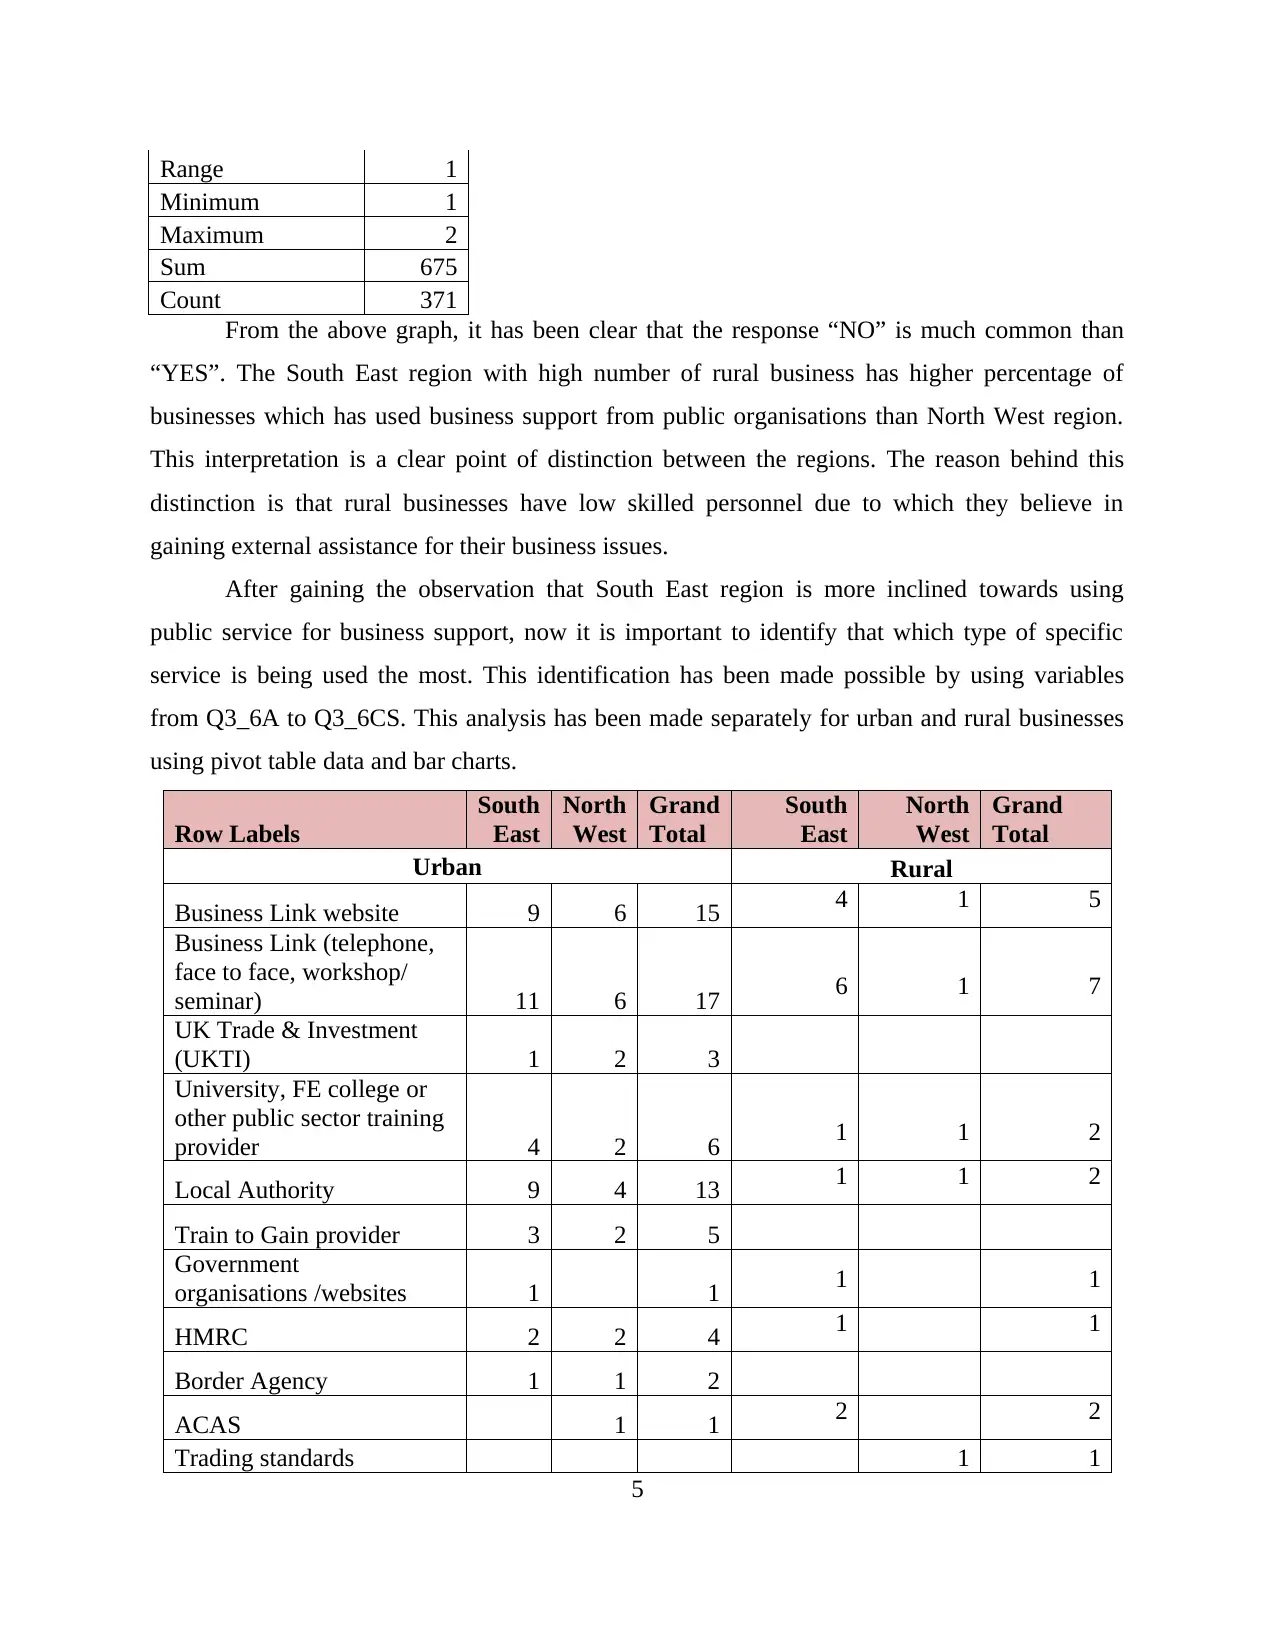
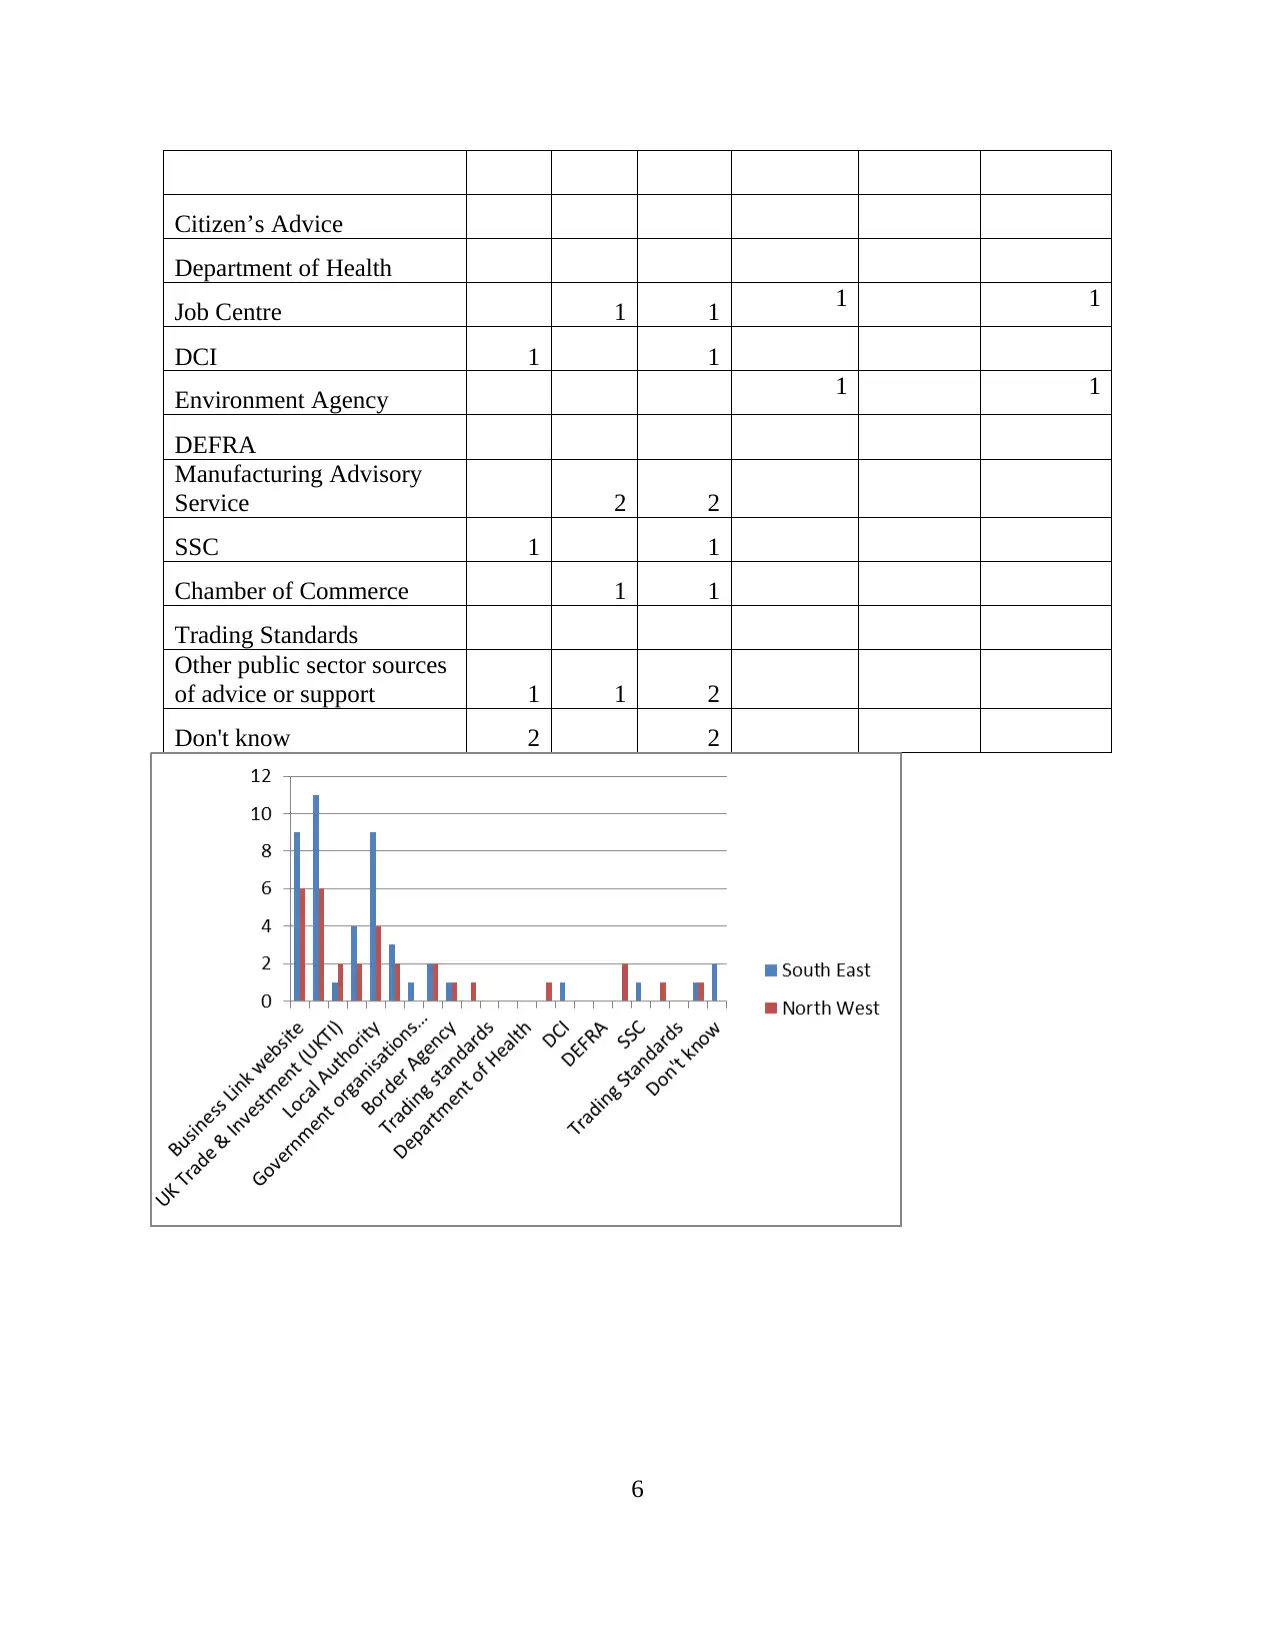
After gaining the observation that South East region is more inclined towards using
public service for business support, now it is important to identify that which type of specific
service is being used the most. This identification has been made possible by using variables
from Q3_6A to Q3_6CS. This analysis has been made separately for urban and rural businesses
using pivot table data and bar charts.
Row Labels
South
East
North
West
Grand
Total
South
East
North
West
Grand
Total
Urban Rural
Business Link website 9 6 15 4 1 5
Business Link (telephone,
face to face, workshop/
seminar) 11 6 17 6 1 7
UK Trade & Investment
(UKTI) 1 2 3
University, FE college or
other public sector training
provider 4 2 6 1 1 2
Local Authority 9 4 13 1 1 2
Train to Gain provider 3 2 5
Government
organisations /websites 1 1 1 1
HMRC 2 2 4 1 1
Border Agency 1 1 2
ACAS 1 1 2 2
Trading standards 1 1
5
Minimum 1
Maximum 2
Sum 675
Count 371
From the above graph, it has been clear that the response “NO” is much common than
“YES”. The South East region with high number of rural business has higher percentage of
businesses which has used business support from public organisations than North West region.
This interpretation is a clear point of distinction between the regions. The reason behind this
distinction is that rural businesses have low skilled personnel due to which they believe in
gaining external assistance for their business issues.
After gaining the observation that South East region is more inclined towards using
public service for business support, now it is important to identify that which type of specific
service is being used the most. This identification has been made possible by using variables
from Q3_6A to Q3_6CS. This analysis has been made separately for urban and rural businesses
using pivot table data and bar charts.
Row Labels
South
East
North
West
Grand
Total
South
East
North
West
Grand
Total
Urban Rural
Business Link website 9 6 15 4 1 5
Business Link (telephone,
face to face, workshop/
seminar) 11 6 17 6 1 7
UK Trade & Investment
(UKTI) 1 2 3
University, FE college or
other public sector training
provider 4 2 6 1 1 2
Local Authority 9 4 13 1 1 2
Train to Gain provider 3 2 5
Government
organisations /websites 1 1 1 1
HMRC 2 2 4 1 1
Border Agency 1 1 2
ACAS 1 1 2 2
Trading standards 1 1
5
Paraphrase This Document
Need a fresh take? Get an instant paraphrase of this document with our AI Paraphraser
Citizen’s Advice
Department of Health
Job Centre 1 1 1 1
DCI 1 1
Environment Agency 1 1
DEFRA
Manufacturing Advisory
Service 2 2
SSC 1 1
Chamber of Commerce 1 1
Trading Standards
Other public sector sources
of advice or support 1 1 2
Don't know 2 2
6
Department of Health
Job Centre 1 1 1 1
DCI 1 1
Environment Agency 1 1
DEFRA
Manufacturing Advisory
Service 2 2
SSC 1 1
Chamber of Commerce 1 1
Trading Standards
Other public sector sources
of advice or support 1 1 2
Don't know 2 2
6
From the above analysis, it has been interpreted that despite of having differences of
different region and nature of businesses, the most used business support service from public
organisations is business link. This service includes telephone, face to face, workshop and
seminars). The only point of distinction between South East and North West region which is
identified in above analysis is that most popular service in rural businesses of North West region
does not prefer to use business link services but the rural businesses of South East region are the
main users of such service.
From the above analysis, it has been observed that the both considered regions are different
from each other as they both have different preferences related to using business support services
from public organisations. Once the differences between both the regions are clear, the barriers
of restricting people from using such services will be identified. For this purpose, two variables
from the entire data are shortlisted which are Q4_4 and Q6_5.
The variable Q4_4 is a question which has been asked from individuals that whether they
think that business support can help them or not. The rationale behind selecting this variable is
that it can help in considering thought process of people as a barrier which limits them to take up
business support. The results of this variable are presented below which only presents the result
for two specific regions. The results are gained from pivot table data, summary statistics and a
bar graph.
Row Labels
South
East
North
West
Grand
Total
7
⊘ This is a preview!⊘
Do you want full access?
Subscribe today to unlock all pages.
Trusted by 1+ million students worldwide
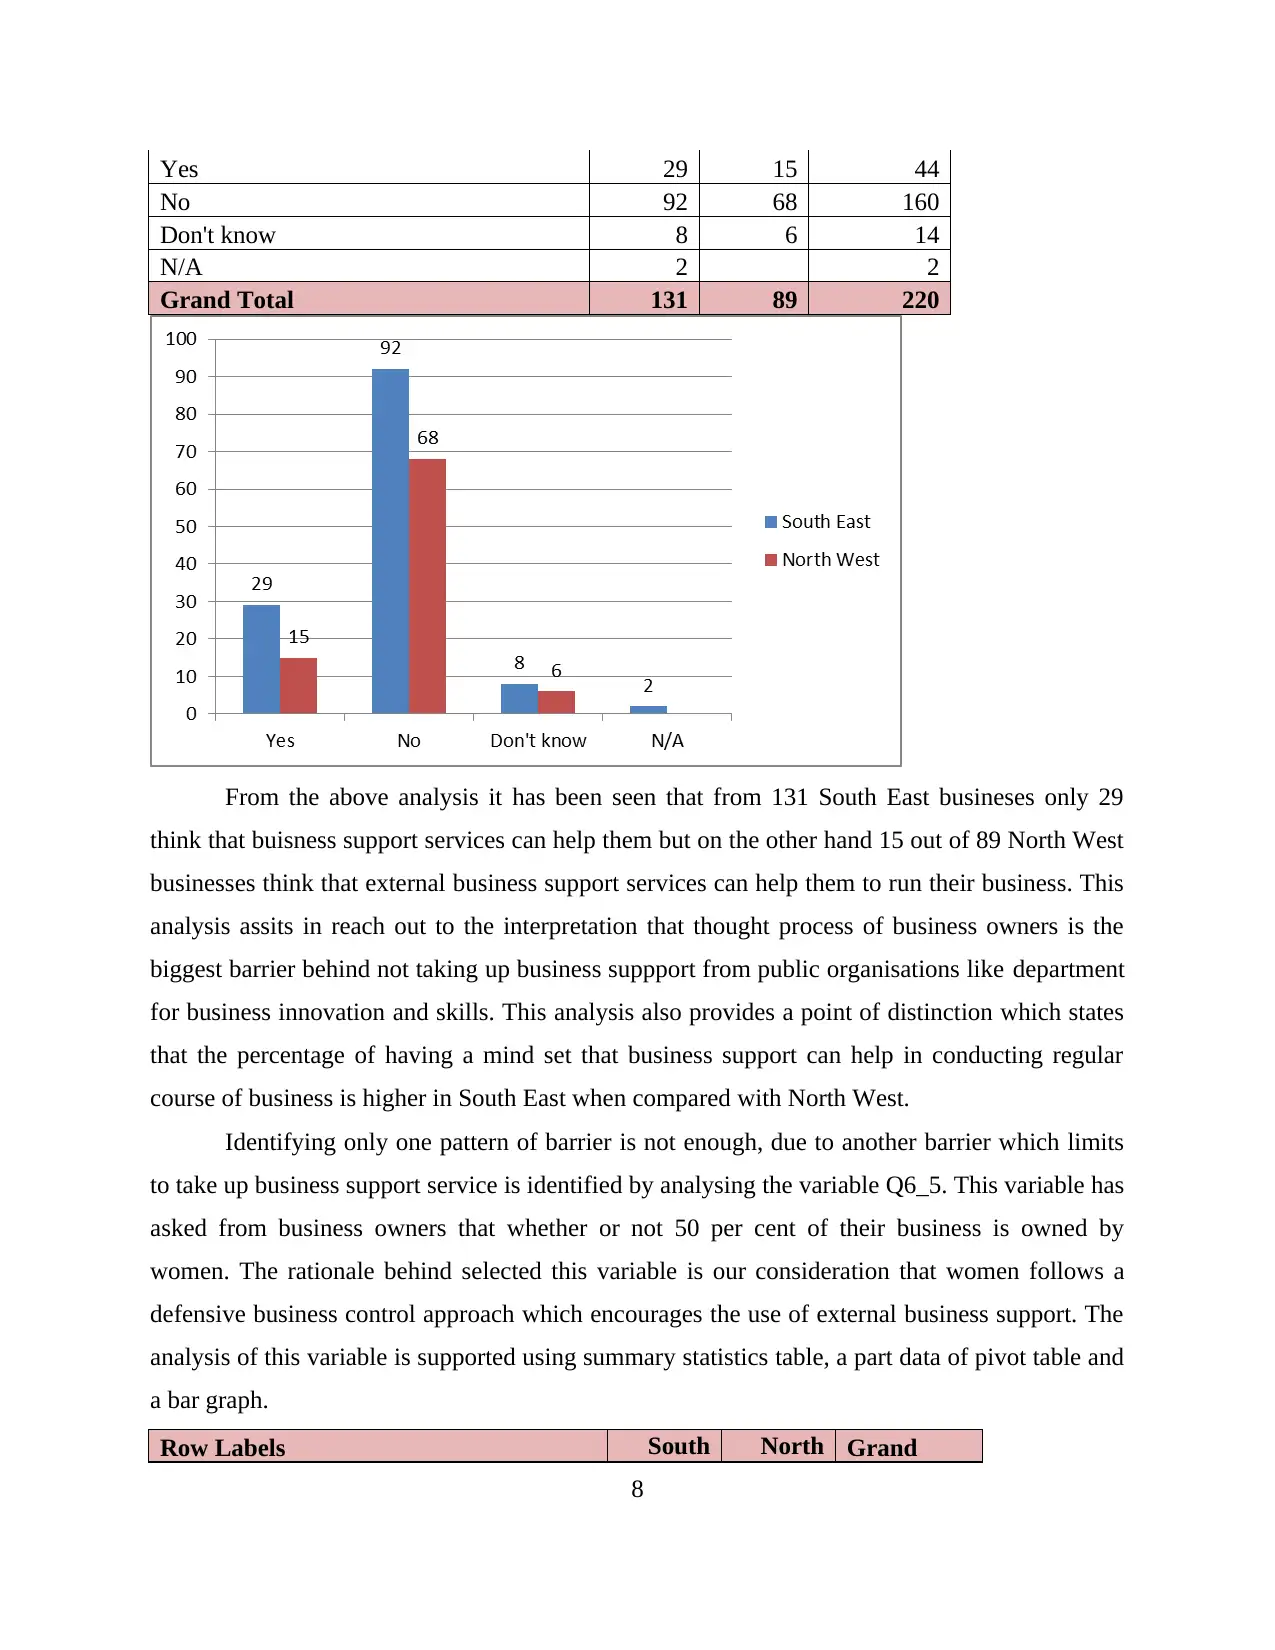
Yes 29 15 44
No 92 68 160
Don't know 8 6 14
N/A 2 2
Grand Total 131 89 220
From the above analysis it has been seen that from 131 South East busineses only 29
think that buisness support services can help them but on the other hand 15 out of 89 North West
businesses think that external business support services can help them to run their business. This
analysis assits in reach out to the interpretation that thought process of business owners is the
biggest barrier behind not taking up business suppport from public organisations like department
for business innovation and skills. This analysis also provides a point of distinction which states
that the percentage of having a mind set that business support can help in conducting regular
course of business is higher in South East when compared with North West.
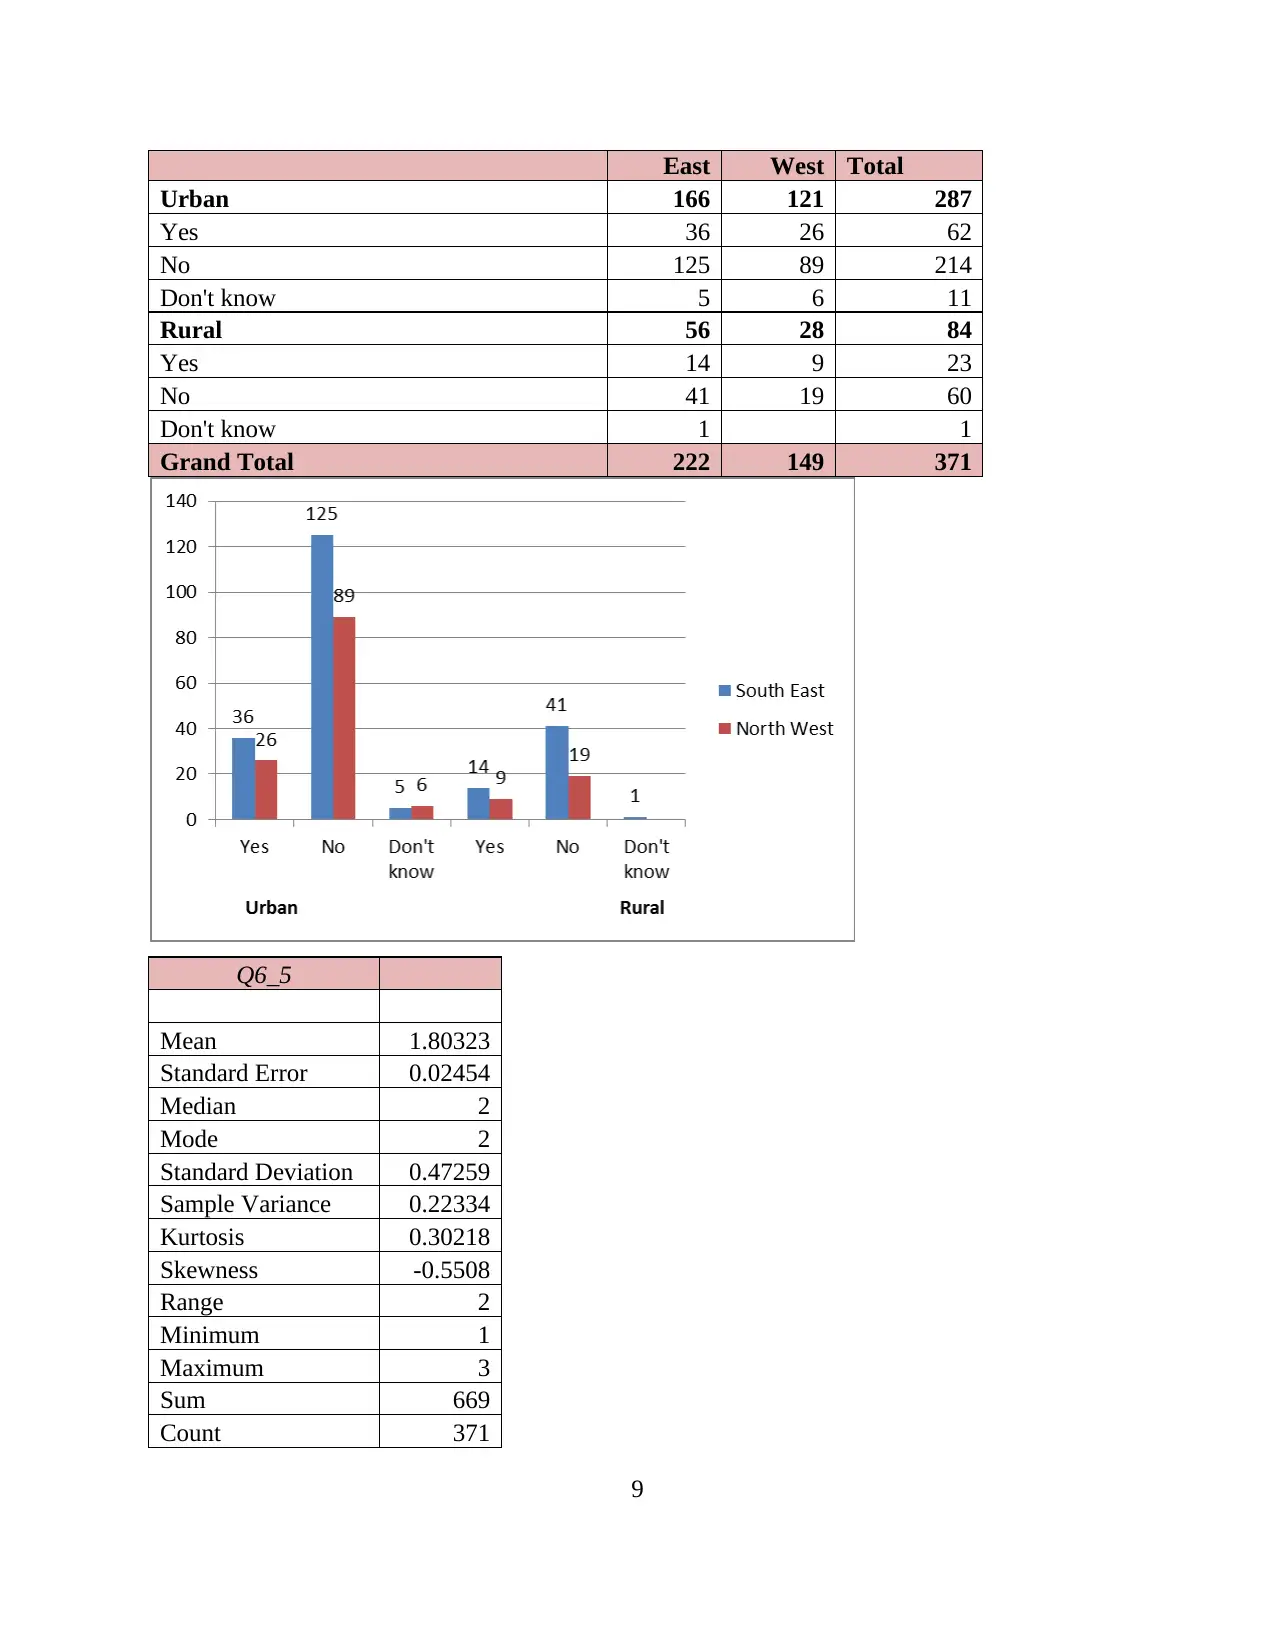
Identifying only one pattern of barrier is not enough, due to another barrier which limits
to take up business support service is identified by analysing the variable Q6_5. This variable has
asked from business owners that whether or not 50 per cent of their business is owned by
women. The rationale behind selected this variable is our consideration that women follows a
defensive business control approach which encourages the use of external business support. The
analysis of this variable is supported using summary statistics table, a part data of pivot table and
a bar graph.
Row Labels South North Grand
8
No 92 68 160
Don't know 8 6 14
N/A 2 2
Grand Total 131 89 220
From the above analysis it has been seen that from 131 South East busineses only 29
think that buisness support services can help them but on the other hand 15 out of 89 North West
businesses think that external business support services can help them to run their business. This
analysis assits in reach out to the interpretation that thought process of business owners is the
biggest barrier behind not taking up business suppport from public organisations like department
for business innovation and skills. This analysis also provides a point of distinction which states
that the percentage of having a mind set that business support can help in conducting regular
course of business is higher in South East when compared with North West.
Identifying only one pattern of barrier is not enough, due to another barrier which limits
to take up business support service is identified by analysing the variable Q6_5. This variable has
asked from business owners that whether or not 50 per cent of their business is owned by
women. The rationale behind selected this variable is our consideration that women follows a
defensive business control approach which encourages the use of external business support. The
analysis of this variable is supported using summary statistics table, a part data of pivot table and
a bar graph.
Row Labels South North Grand
8
Paraphrase This Document
Need a fresh take? Get an instant paraphrase of this document with our AI Paraphraser
East West Total
Urban 166 121 287
Yes 36 26 62
No 125 89 214
Don't know 5 6 11
Rural 56 28 84
Yes 14 9 23
No 41 19 60
Don't know 1 1
Grand Total 222 149 371
Q6_5
Mean 1.80323
Standard Error 0.02454
Median 2
Mode 2
Standard Deviation 0.47259
Sample Variance 0.22334
Kurtosis 0.30218
Skewness -0.5508
Range 2
Minimum 1
Maximum 3
Sum 669
Count 371
9
From the above summary statistics table, the Mode of the variable data is 2 which reflects
that most of the people has responded no when they were asked that whether 50% of the business
owners are women. For more specific data, the pivot table shows that the percentage of owning
business by women is higher in North West region and this is because the high urban businesses
in this region.
So, from the above analysis it has been clear that not having women business owners is
also a barrier of taking up business support from public organisations.
Highlighting interesting findings
The BIS data has provided few interesting findings which are all stated below along with
their brief description:
The regions of South East and North West are different from each other by various points
of differences. But these two regions also has a point of similarity which is that the most
popular external business support service from public organisations is of business link
service.
The Number of Urban businesses is higher in South East region which is the result of
number of high overall businesses in this region. But the ratio of having urban businesses
is higher in North West region.
Another interesting finding which has been gained from above analysis is that urban
businesses has more women owners than rural businesses and this also results in higher
utilisation of business support services as the mind set of women states that using
external business support from viable organisations can benefit regular conduct of
business.
Another interesting finding which is identified is that the most influential barrier which
limits businesses from using business support from external public organisations is the
thought process of business owners which is fixed that external help cannot be useful as
they do not know anything about the business operations.
Recommendations about areas which require further support
After analysing the BIS data and highlighting interesting findings, it is important that to
recommend about the areas which require further support to Chief Research Analyst of BIS.
These recommendations are discussed below:
10
⊘ This is a preview!⊘
Do you want full access?
Subscribe today to unlock all pages.
Trusted by 1+ million students worldwide
1 out of 14
Related Documents


Your All-in-One AI-Powered Toolkit for Academic Success.
+13062052269
info@desklib.com
Available 24*7 on WhatsApp / Email
![[object Object]](/_next/static/media/star-bottom.7253800d.svg)
Unlock your academic potential
Copyright © 2020–2026 A2Z Services. All Rights Reserved. Developed and managed by ZUCOL.