ProductsLogo
LogoStudy Documents
LogoAI Grader
LogoAI Answer
LogoAI Code Checker
LogoPlagiarism Checker
LogoAI Paraphraser
LogoAI Quiz
LogoAI Detector
PricingBlogAbout Us
logo

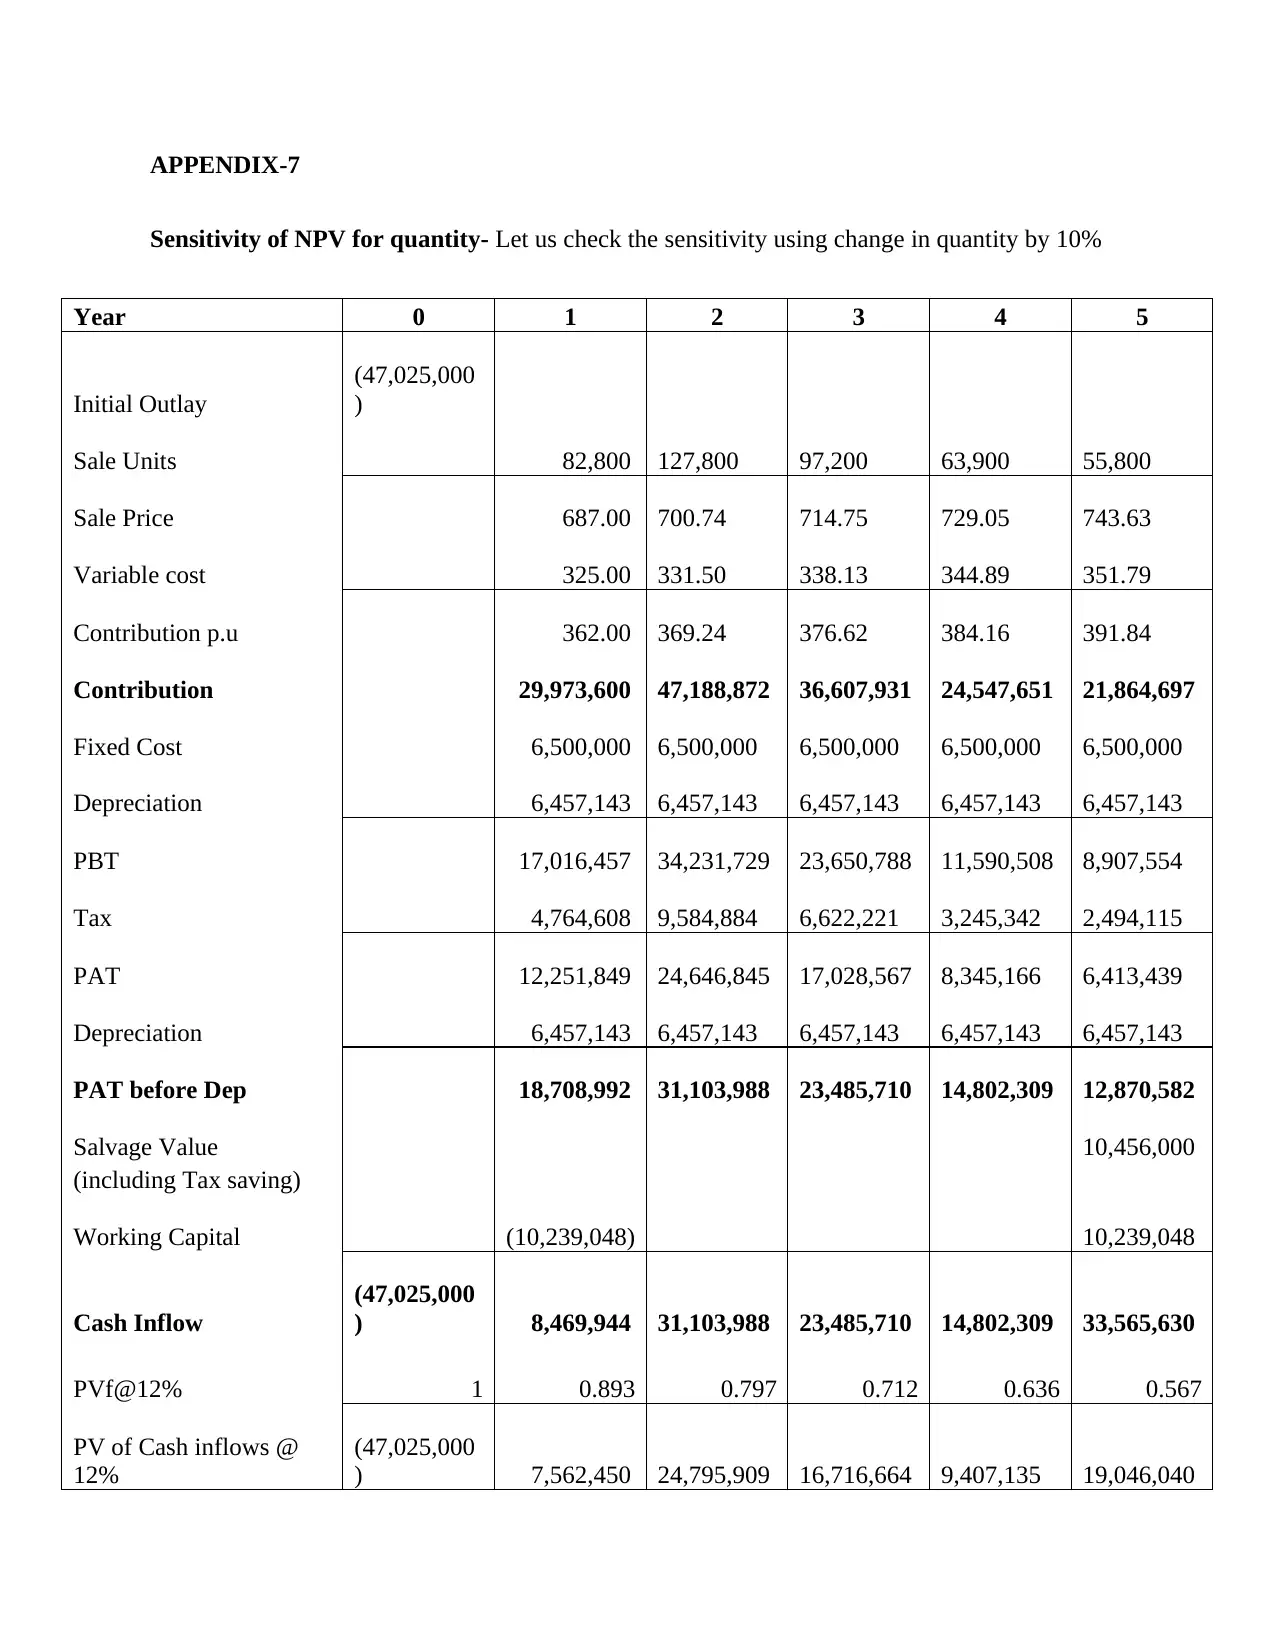
Sensitivity Analysis for Changes in Quantity by 10%

Verified

Added on  2019/09/25

|8
|1120
|102
Report
AI Summary
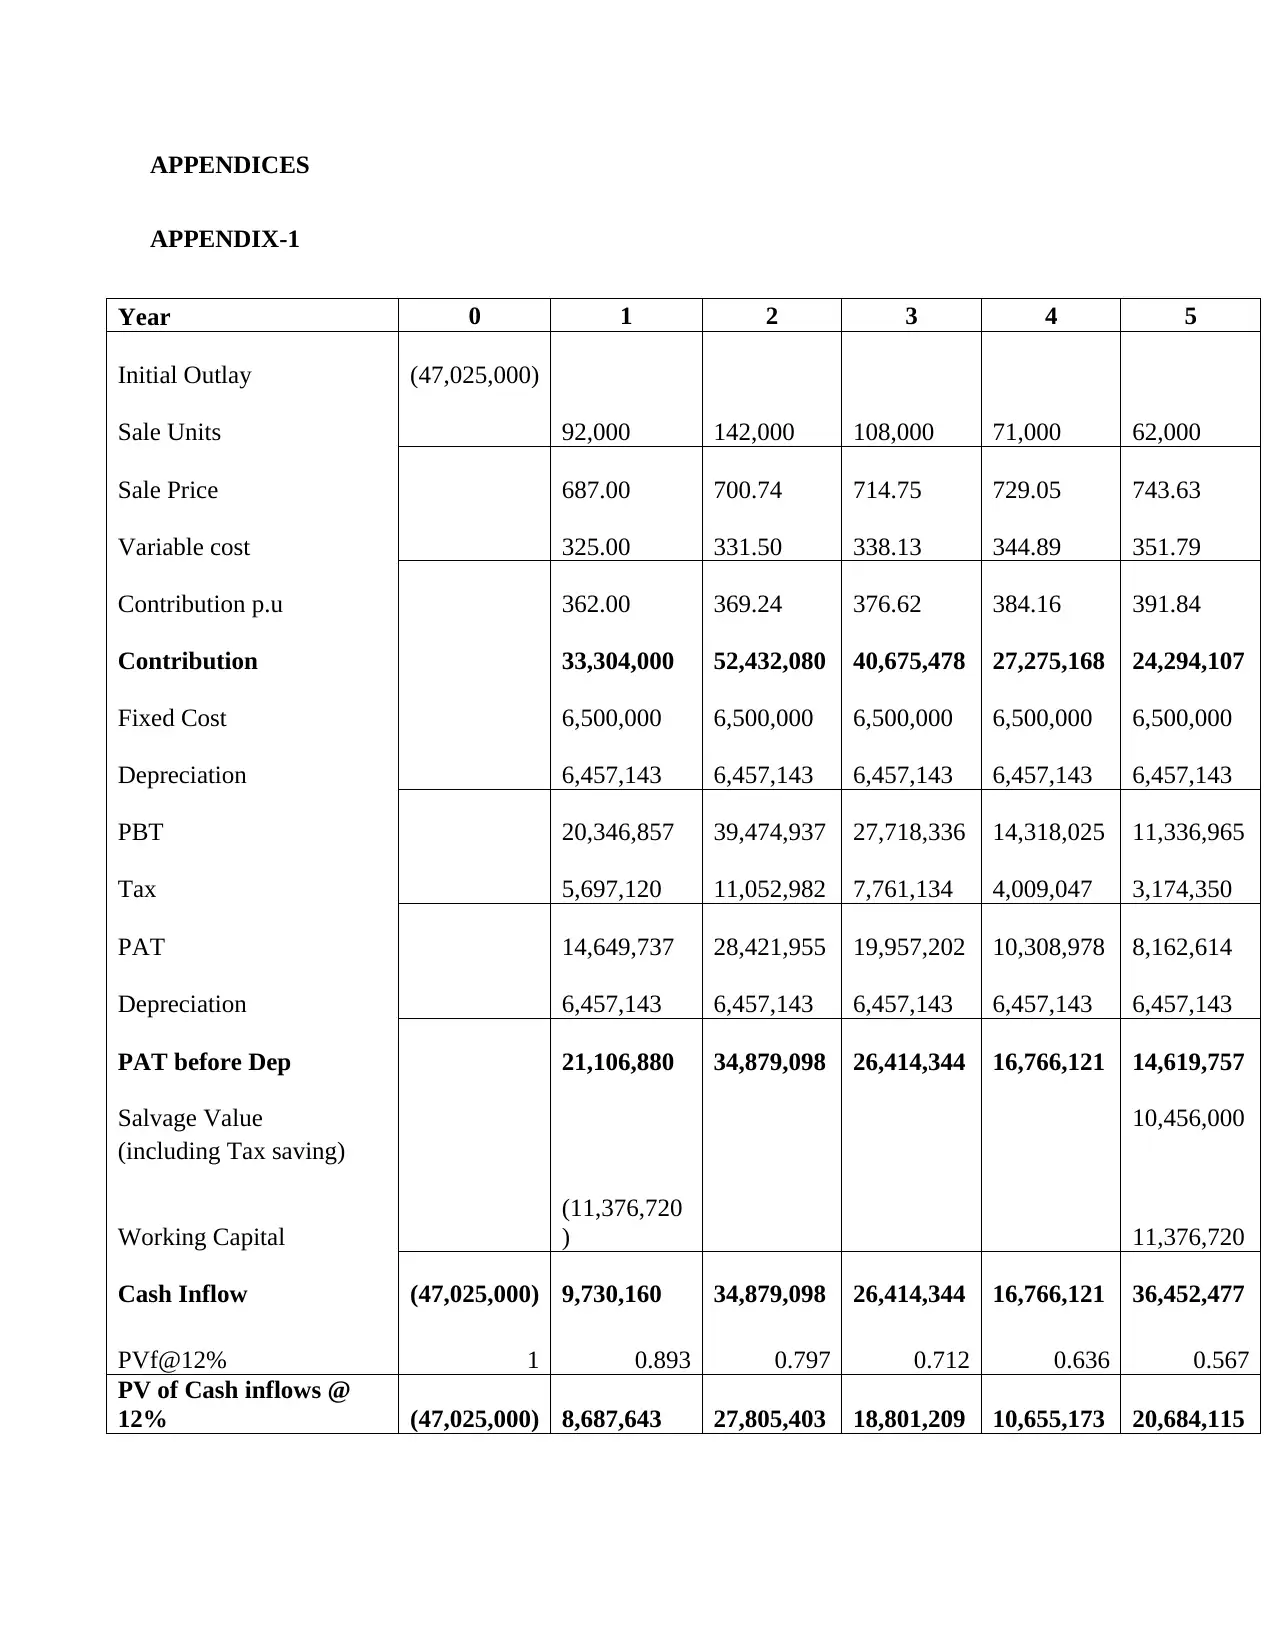
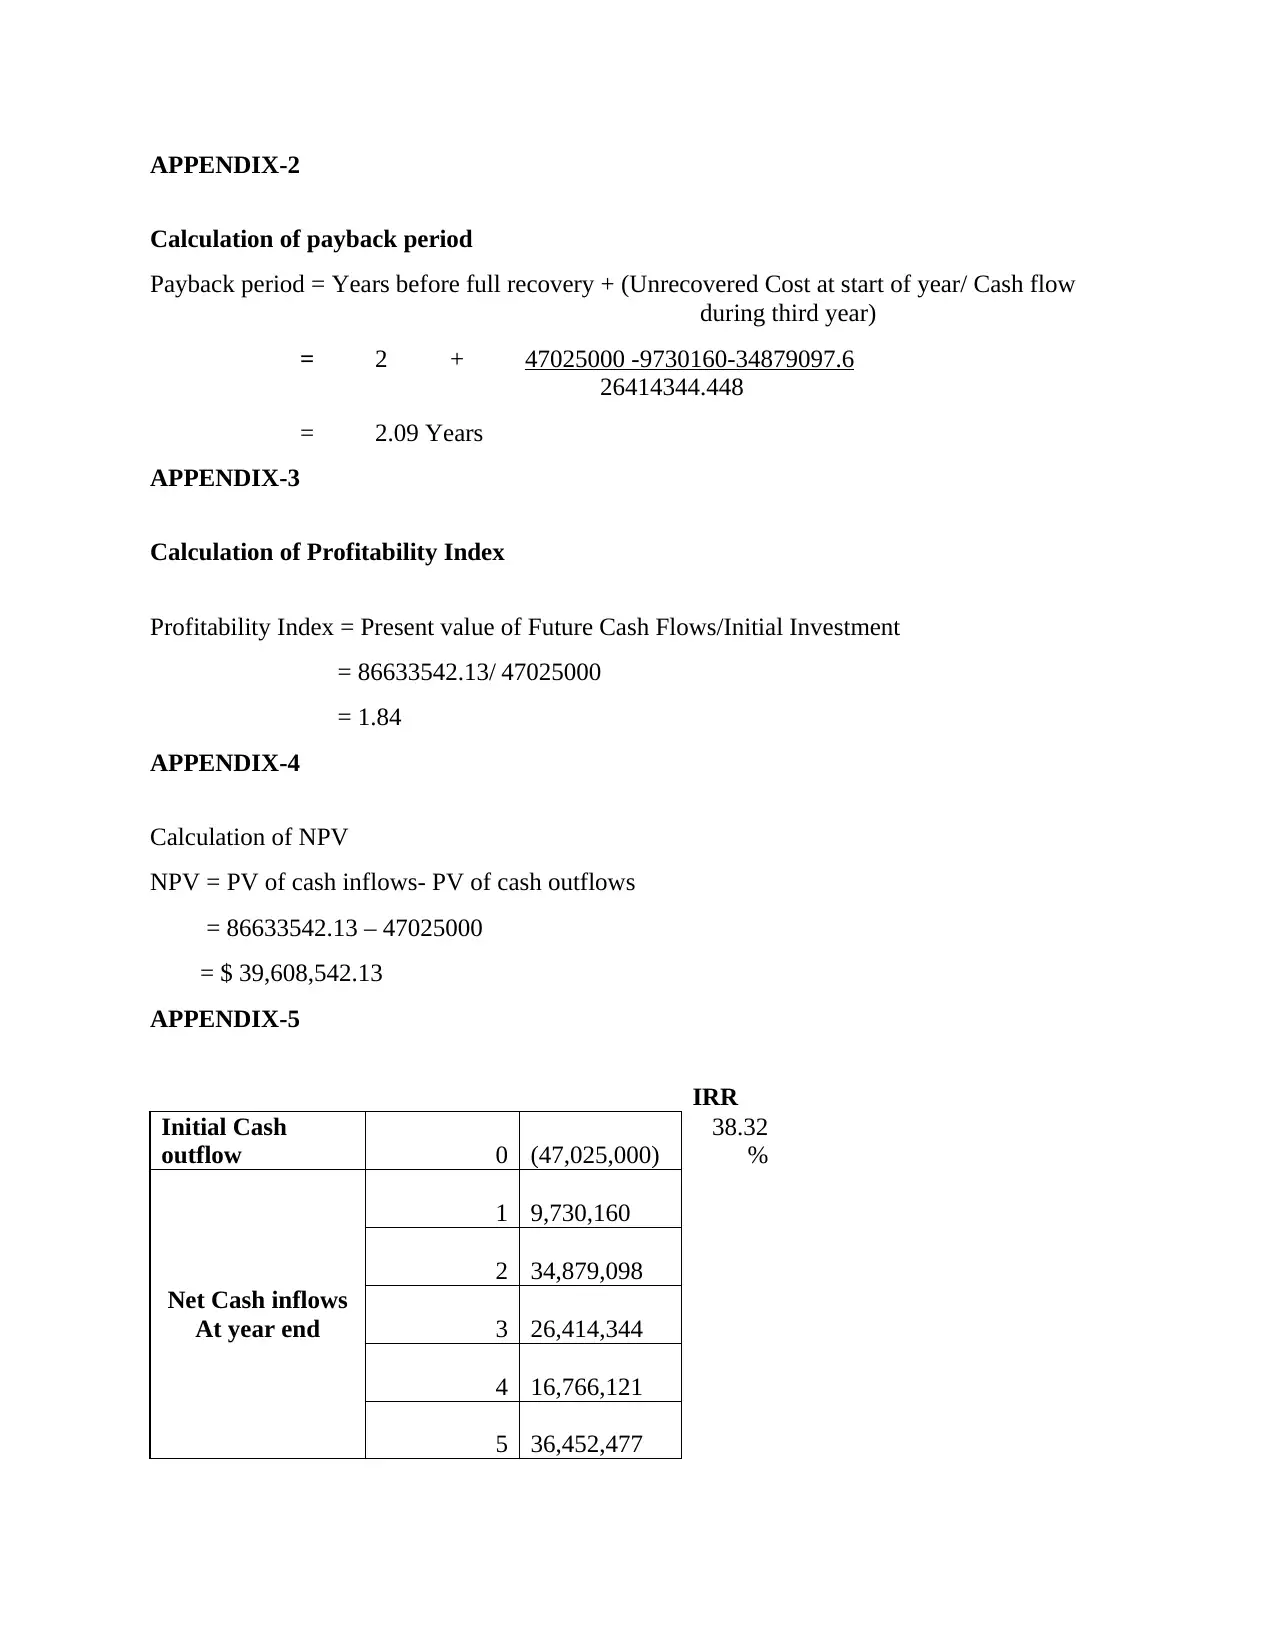
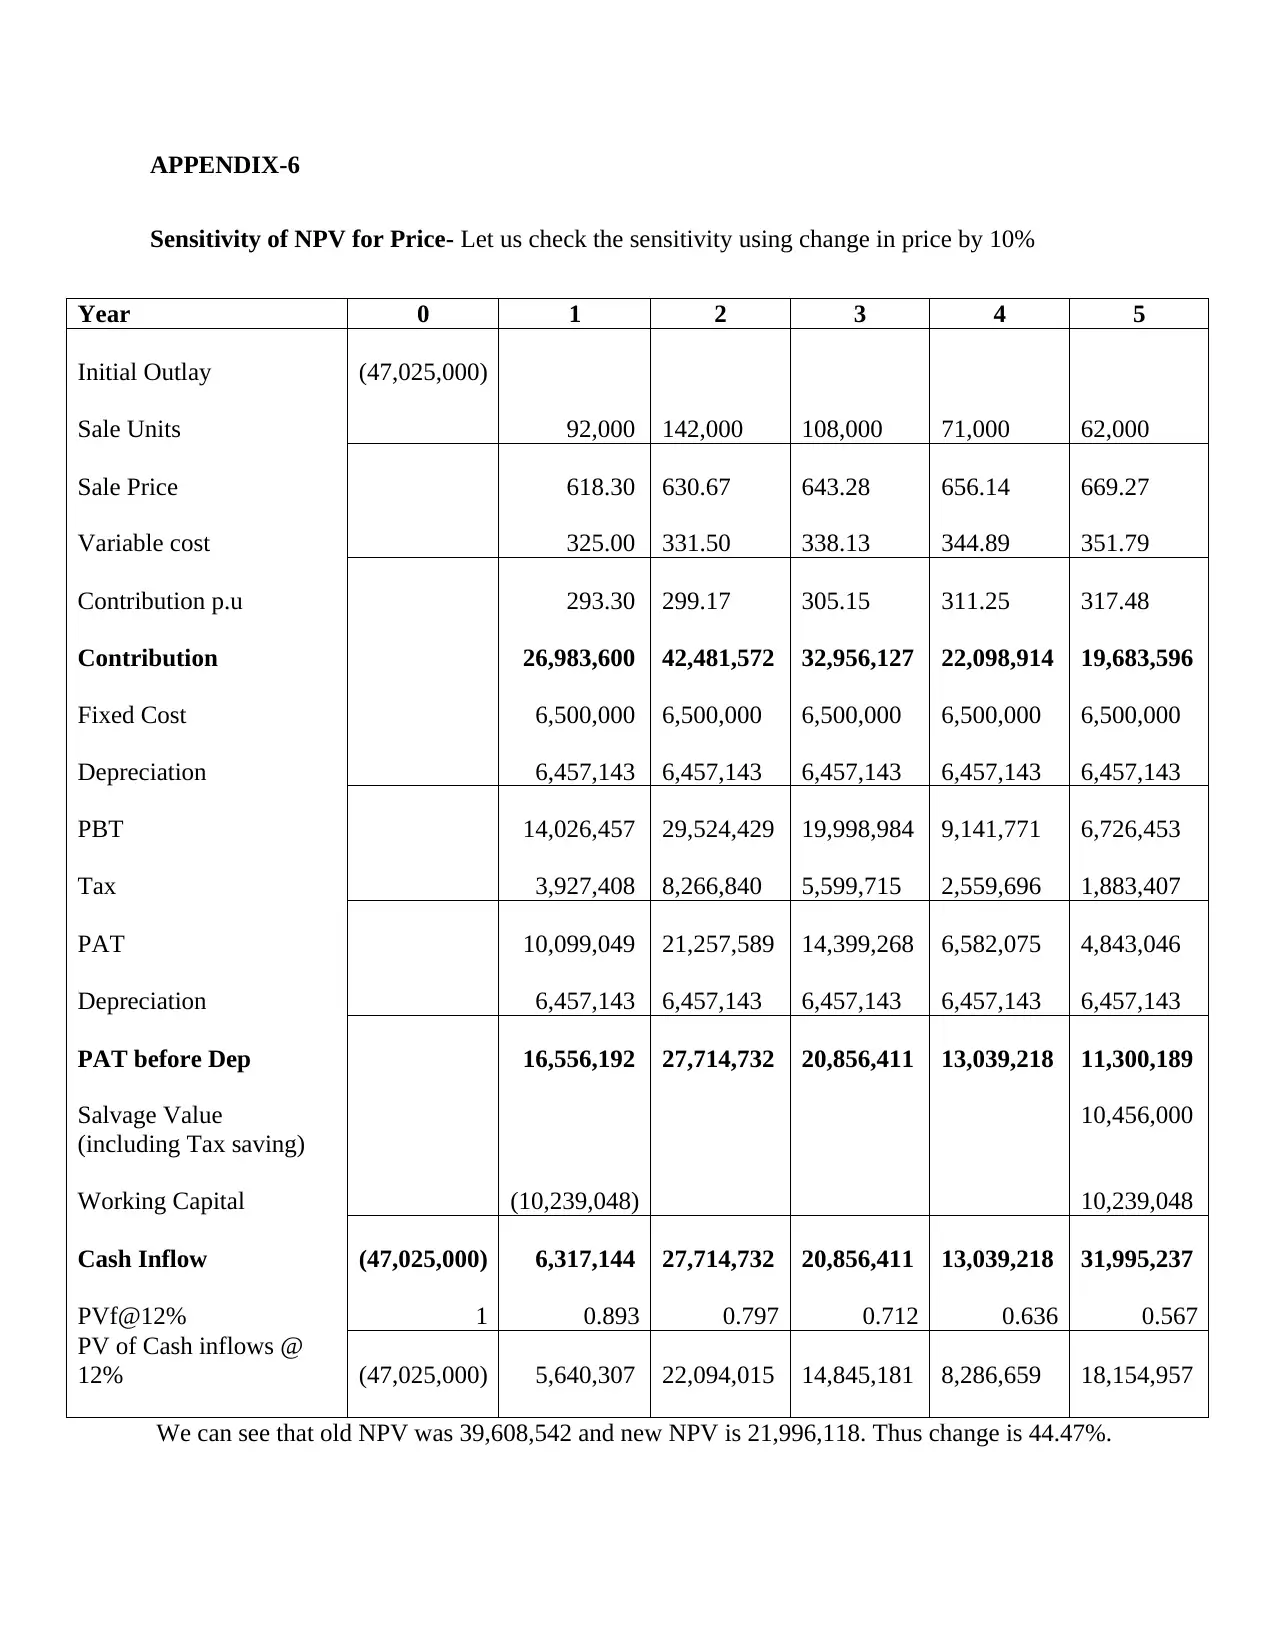
The assignment content presents a financial analysis of a project. The data provided shows the contribution, fixed cost, depreciation, PBT (Profit Before Tax), PAT (Profit After Tax), and working capital for different years. The sensitivity of NPV to quantity change is also analyzed by increasing the quantity by 10%. The results show an initial outlay of $47,025,000 and a new NPV of $21,996,118, indicating a 44.47% change from the old NPV of $39,608,542.

Contribute Materials

Your contribution can guide someone’s learning journey. Share your documents today.
Document Page
BOOLI ELECTRONICS
NEW SSHA- PRODUCT ANALYSIS

Secure Best Marks with AI Grader

Need help grading? Try our AI Grader for instant feedback on your assignments.
Document Page
INTRODUCTION
Booli Electronics a manufacturer of electronic products is currently producing a product smart
speaker and home assistant (SSHA). With the change in technology Booli Electronics is
considering producing a new SSHA model which has Wi-Fi tethering and access to large number
of streaming services, in addition to all the features of the old model. This report shows whether
the new SSHA should be produced or not and why.
THE BODY
Booli Electronics had already spent $ 1,175,000 developing a prototype and $ 650,000 for the
market study. Now the Booli Electronics wants to decide whether it should produce the new
model of SSHA or not.
As the Net Present Value of producing the new model for 5 years is positive and that too $
39,608,542 (Appendix-6) the company should go for production of new model. Company’s
required rate of return is 12% while new model of SSHA will provide 38.32% of return to the
company. (Appendix-5) The company should try to increase its market share by launching new
model.
We can also see that the profitability index of the capital investment decision is 1.84 (Appendix-
3) which is very good. Also the payback period of the project is only 2.09 years (Appendix-2)
means Booli Electronics will get its money back in around 2 years only.
Net Present Value of the project is very sensitive to price of the product. If price of the product
changes unfavorably by 10% then the net present value will decrease by 44.47 % (Appendix-6)
which is very high. Thu company should set the pricing of the product very wisely.
Document Page
Also, if we check the sensitivity of the net present value of the project with the quantity sold of
the model, then we find that if sale quantity of the new model decreases by 10 % then the net
present value will decrease by 23%. (Appendix-7) Thus company should keep its customers
intact and should try to maintain handsome amount of demand of its new model of SSHA.
In case Booli electronics will lose sale of other models on introduction of new model of SSHA,
then first we will see whether the cash flows lost from that sales are less than the cash flows from
the new model. If the net inflow, after deducting cash inflows of old model from the existing
models is positive then Booli should go for new model.
CONCLUSION
Since Booli will make handsome amount of profits after introduction of new SSHA model, I will
recommend that Booli should go for new SSHA model at the earliest.
RECOMMENDATIONS
It is recommended that Booli should conduct a study of price elasticity of demand for the new
SSHA model and then should charge such price that will give demand of enough units which
will give highest sales in volume to Booli Electronics.
Document Page
APPENDICES
APPENDIX-1
Year 0 1 2 3 4 5
Initial Outlay (47,025,000)
Sale Units 92,000 142,000 108,000 71,000 62,000
Sale Price 687.00 700.74 714.75 729.05 743.63
Variable cost 325.00 331.50 338.13 344.89 351.79
Contribution p.u 362.00 369.24 376.62 384.16 391.84
Contribution 33,304,000 52,432,080 40,675,478 27,275,168 24,294,107
Fixed Cost 6,500,000 6,500,000 6,500,000 6,500,000 6,500,000
Depreciation 6,457,143 6,457,143 6,457,143 6,457,143 6,457,143
PBT 20,346,857 39,474,937 27,718,336 14,318,025 11,336,965
Tax 5,697,120 11,052,982 7,761,134 4,009,047 3,174,350
PAT 14,649,737 28,421,955 19,957,202 10,308,978 8,162,614
Depreciation 6,457,143 6,457,143 6,457,143 6,457,143 6,457,143
PAT before Dep 21,106,880 34,879,098 26,414,344 16,766,121 14,619,757
Salvage Value 10,456,000
(including Tax saving)
Working Capital
(11,376,720
) 11,376,720
Cash Inflow (47,025,000) 9,730,160 34,879,098 26,414,344 16,766,121 36,452,477
PVf@12% 1 0.893 0.797 0.712 0.636 0.567
PV of Cash inflows @
12% (47,025,000) 8,687,643 27,805,403 18,801,209 10,655,173 20,684,115

Paraphrase This Document

Need a fresh take? Get an instant paraphrase of this document with our AI Paraphraser
Document Page
APPENDIX-2
Calculation of payback period
Payback period = Years before full recovery + (Unrecovered Cost at start of year/ Cash flow
during third year)
= 2 + 47025000 -9730160-34879097.6
26414344.448
= 2.09 Years
APPENDIX-3
Calculation of Profitability Index
Profitability Index = Present value of Future Cash Flows/Initial Investment
= 86633542.13/ 47025000
= 1.84
APPENDIX-4
Calculation of NPV
NPV = PV of cash inflows- PV of cash outflows
= 86633542.13 – 47025000
= $ 39,608,542.13
APPENDIX-5
IRR
Initial Cash
outflow 0 (47,025,000)
38.32
%
Net Cash inflows
At year end
1 9,730,160
2 34,879,098
3 26,414,344
4 16,766,121
5 36,452,477
Document Page
APPENDIX-6
Sensitivity of NPV for Price- Let us check the sensitivity using change in price by 10%
Year 0 1 2 3 4 5
Initial Outlay (47,025,000)
Sale Units 92,000 142,000 108,000 71,000 62,000
Sale Price 618.30 630.67 643.28 656.14 669.27
Variable cost 325.00 331.50 338.13 344.89 351.79
Contribution p.u 293.30 299.17 305.15 311.25 317.48
Contribution 26,983,600 42,481,572 32,956,127 22,098,914 19,683,596
Fixed Cost 6,500,000 6,500,000 6,500,000 6,500,000 6,500,000
Depreciation 6,457,143 6,457,143 6,457,143 6,457,143 6,457,143
PBT 14,026,457 29,524,429 19,998,984 9,141,771 6,726,453
Tax 3,927,408 8,266,840 5,599,715 2,559,696 1,883,407
PAT 10,099,049 21,257,589 14,399,268 6,582,075 4,843,046
Depreciation 6,457,143 6,457,143 6,457,143 6,457,143 6,457,143
PAT before Dep 16,556,192 27,714,732 20,856,411 13,039,218 11,300,189
Salvage Value 10,456,000
(including Tax saving)
Working Capital (10,239,048) 10,239,048
Cash Inflow (47,025,000) 6,317,144 27,714,732 20,856,411 13,039,218 31,995,237
PVf@12% 1 0.893 0.797 0.712 0.636 0.567
PV of Cash inflows @
12% (47,025,000) 5,640,307 22,094,015 14,845,181 8,286,659 18,154,957
We can see that old NPV was 39,608,542 and new NPV is 21,996,118. Thus change is 44.47%.
Document Page
APPENDIX-7
Sensitivity of NPV for quantity- Let us check the sensitivity using change in quantity by 10%
Year 0 1 2 3 4 5
Initial Outlay
(47,025,000
)
Sale Units 82,800 127,800 97,200 63,900 55,800
Sale Price 687.00 700.74 714.75 729.05 743.63
Variable cost 325.00 331.50 338.13 344.89 351.79
Contribution p.u 362.00 369.24 376.62 384.16 391.84
Contribution 29,973,600 47,188,872 36,607,931 24,547,651 21,864,697
Fixed Cost 6,500,000 6,500,000 6,500,000 6,500,000 6,500,000
Depreciation 6,457,143 6,457,143 6,457,143 6,457,143 6,457,143
PBT 17,016,457 34,231,729 23,650,788 11,590,508 8,907,554
Tax 4,764,608 9,584,884 6,622,221 3,245,342 2,494,115
PAT 12,251,849 24,646,845 17,028,567 8,345,166 6,413,439
Depreciation 6,457,143 6,457,143 6,457,143 6,457,143 6,457,143
PAT before Dep 18,708,992 31,103,988 23,485,710 14,802,309 12,870,582
Salvage Value 10,456,000
(including Tax saving)
Working Capital (10,239,048) 10,239,048
Cash Inflow
(47,025,000
) 8,469,944 31,103,988 23,485,710 14,802,309 33,565,630
PVf@12% 1 0.893 0.797 0.712 0.636 0.567
PV of Cash inflows @
12%
(47,025,000
) 7,562,450 24,795,909 16,716,664 9,407,135 19,046,040

Secure Best Marks with AI Grader

Need help grading? Try our AI Grader for instant feedback on your assignments.
Document Page
We can see that old NPV was 39,608,542 and new NPV is 30,503,198. Thus change is 23%.
1 out of 8
[object Object]

Your All-in-One AI-Powered Toolkit for Academic Success.

Available 24*7 on WhatsApp / Email

[object Object]