Exploring Break Time and its Effects on Productivity Statistically
VerifiedAdded on 2023/05/29
|14
|2360
|437
Homework Assignment
AI Summary
This assignment presents a statistical analysis of the relationship between break time and productivity, utilizing frequency statistics, generalized linear models, and cross-tabulations to explore the impact of break frequency and duration on perceived productivity. The analysis includes data on wh...
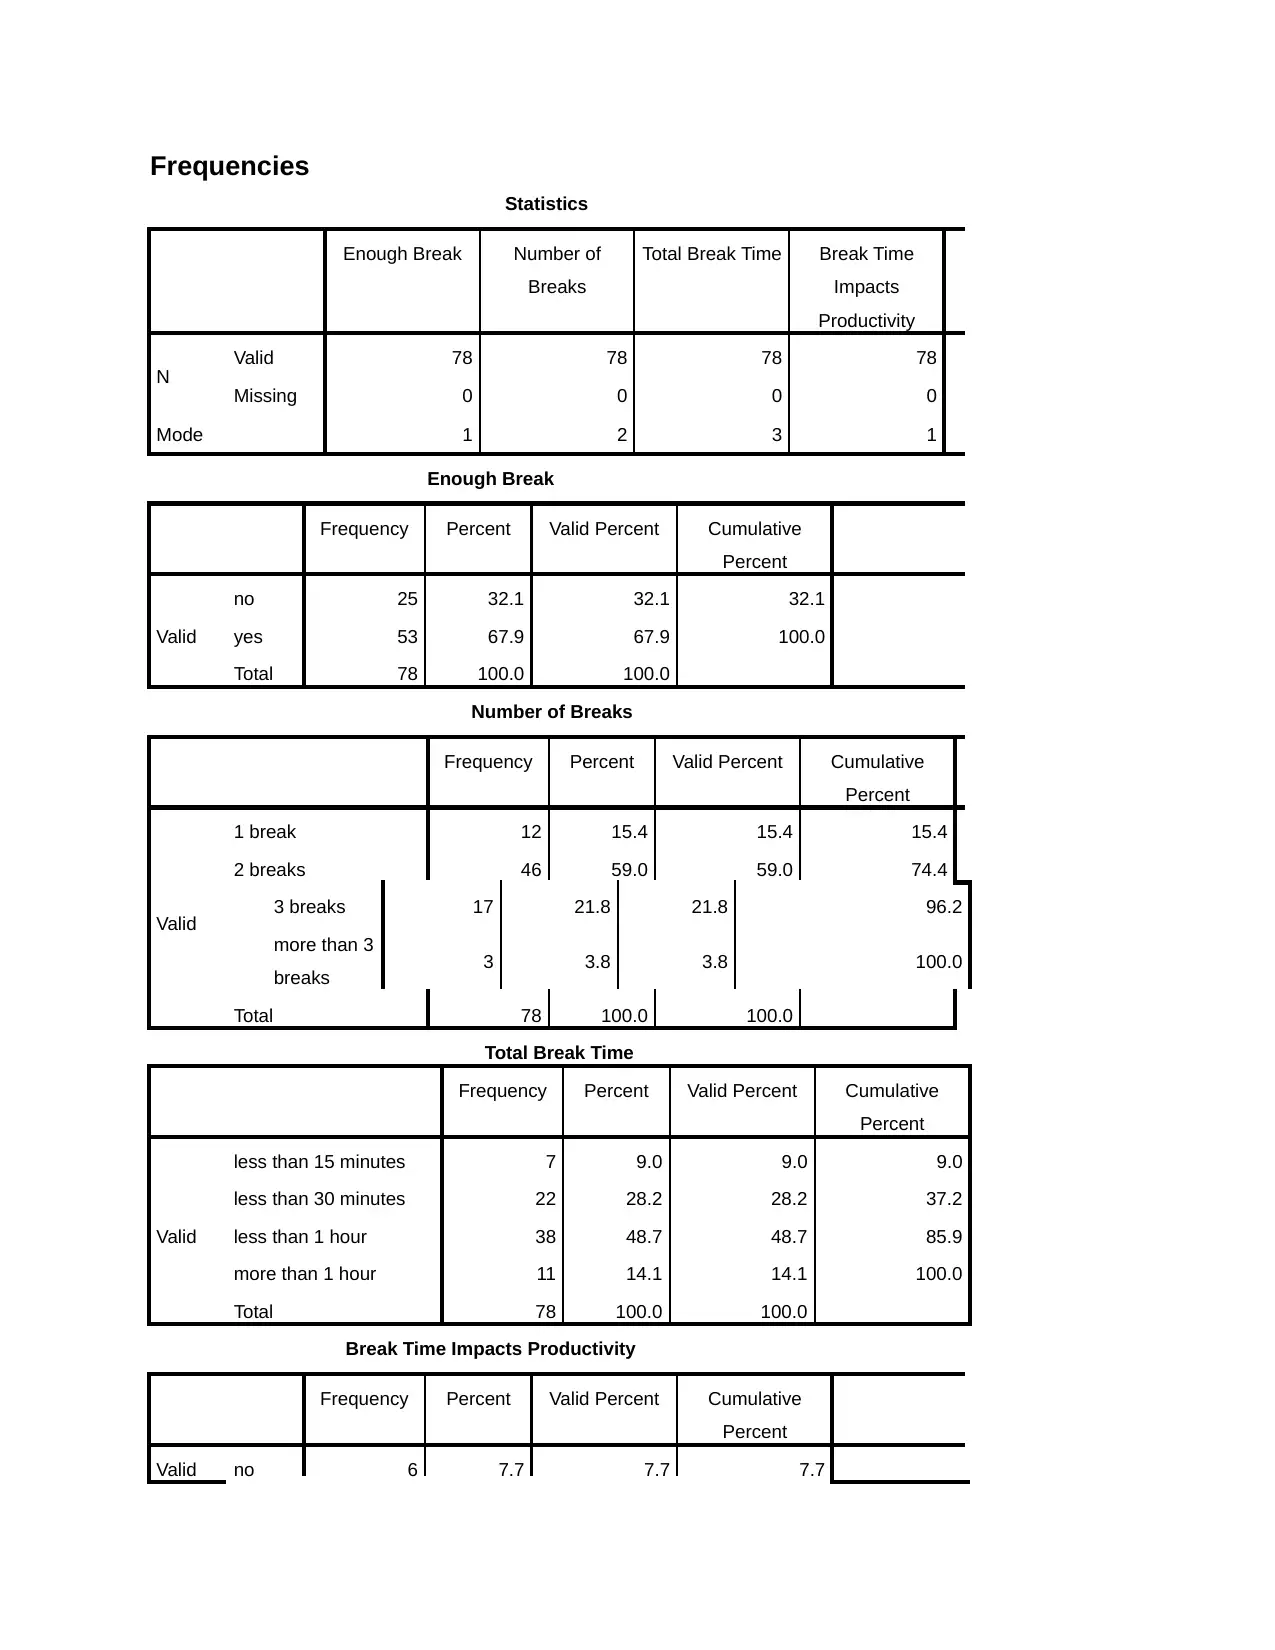
Frequencies
Statistics
Enough Break Number of
Breaks
Total Break Time Break Time
Impacts
Productivity
N Valid 78 78 78 78
Missing 0 0 0 0
Mode 1 2 3 1
Enough Break
Frequency Percent Valid Percent Cumulative
Percent
Valid
no 25 32.1 32.1 32.1
yes 53 67.9 67.9 100.0
Total 78 100.0 100.0
Number of Breaks
Frequency Percent Valid Percent Cumulative
Percent
Valid
1 break 12 15.4 15.4 15.4
2 breaks 46 59.0 59.0 74.4
3 breaks 17 21.8 21.8 96.2
more than 3
breaks 3 3.8 3.8 100.0
Total 78 100.0 100.0
Total Break Time
Frequency Percent Valid Percent Cumulative
Percent
Valid
less than 15 minutes 7 9.0 9.0 9.0
less than 30 minutes 22 28.2 28.2 37.2
less than 1 hour 38 48.7 48.7 85.9
more than 1 hour 11 14.1 14.1 100.0
Total 78 100.0 100.0
Break Time Impacts Productivity
Frequency Percent Valid Percent Cumulative
Percent
Valid no 6 7.7 7.7 7.7
Paraphrase This Document
Need a fresh take? Get an instant paraphrase of this document with our AI Paraphraser
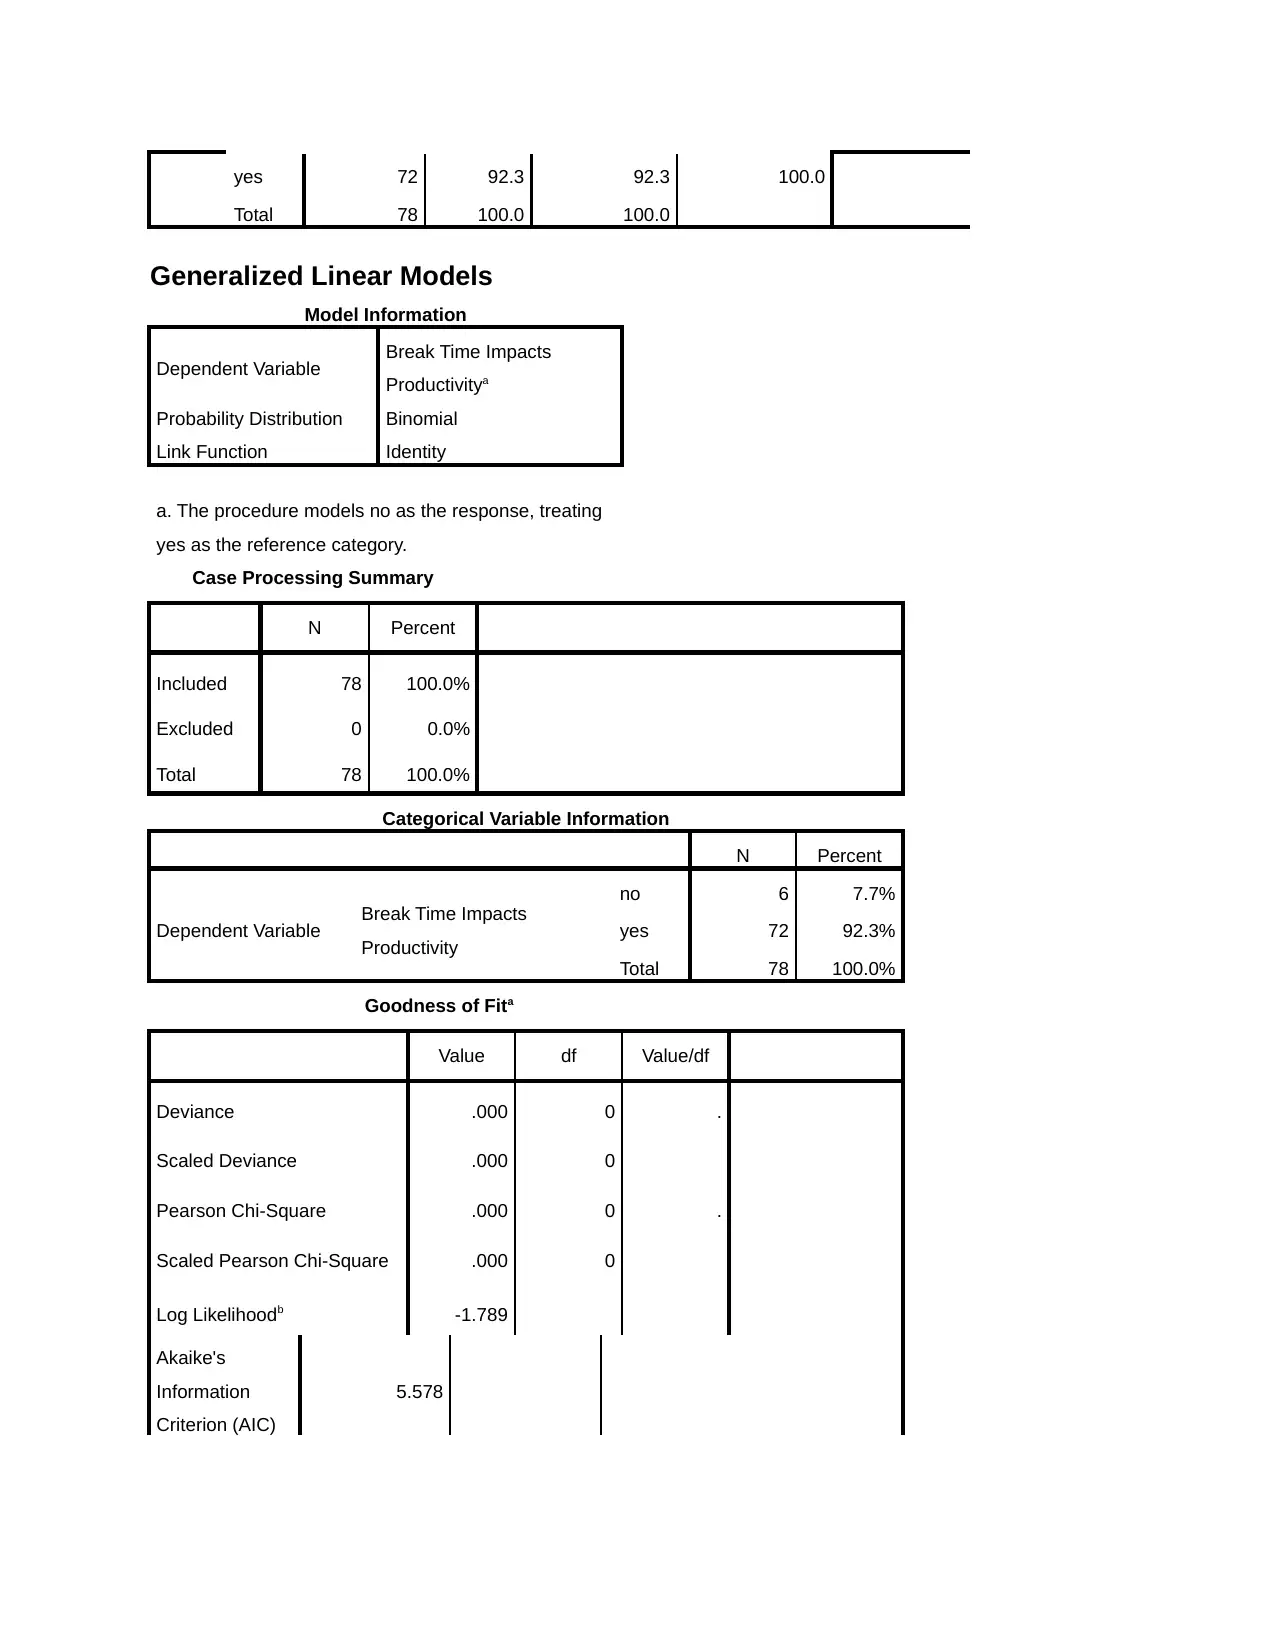
yes 72 92.3 92.3 100.0
Total 78 100.0 100.0
Generalized Linear Models
Model Information
Dependent Variable Break Time Impacts
Productivitya
Probability Distribution Binomial
Link Function Identity
a. The procedure models no as the response, treating
yes as the reference category.
Case Processing Summary
N Percent
Included 78 100.0%
Excluded 0 0.0%
Total 78 100.0%
Categorical Variable Information
N Percent
Dependent Variable Break Time Impacts
Productivity
no 6 7.7%
yes 72 92.3%
Total 78 100.0%
Goodness of Fita
Value df Value/df
Deviance .000 0 .
Scaled Deviance .000 0
Pearson Chi-Square .000 0 .
Scaled Pearson Chi-Square .000 0
Log Likelihoodb -1.789
Akaike's
Information
Criterion (AIC)
5.578
Finite Sample
Corrected AIC
(AICC)
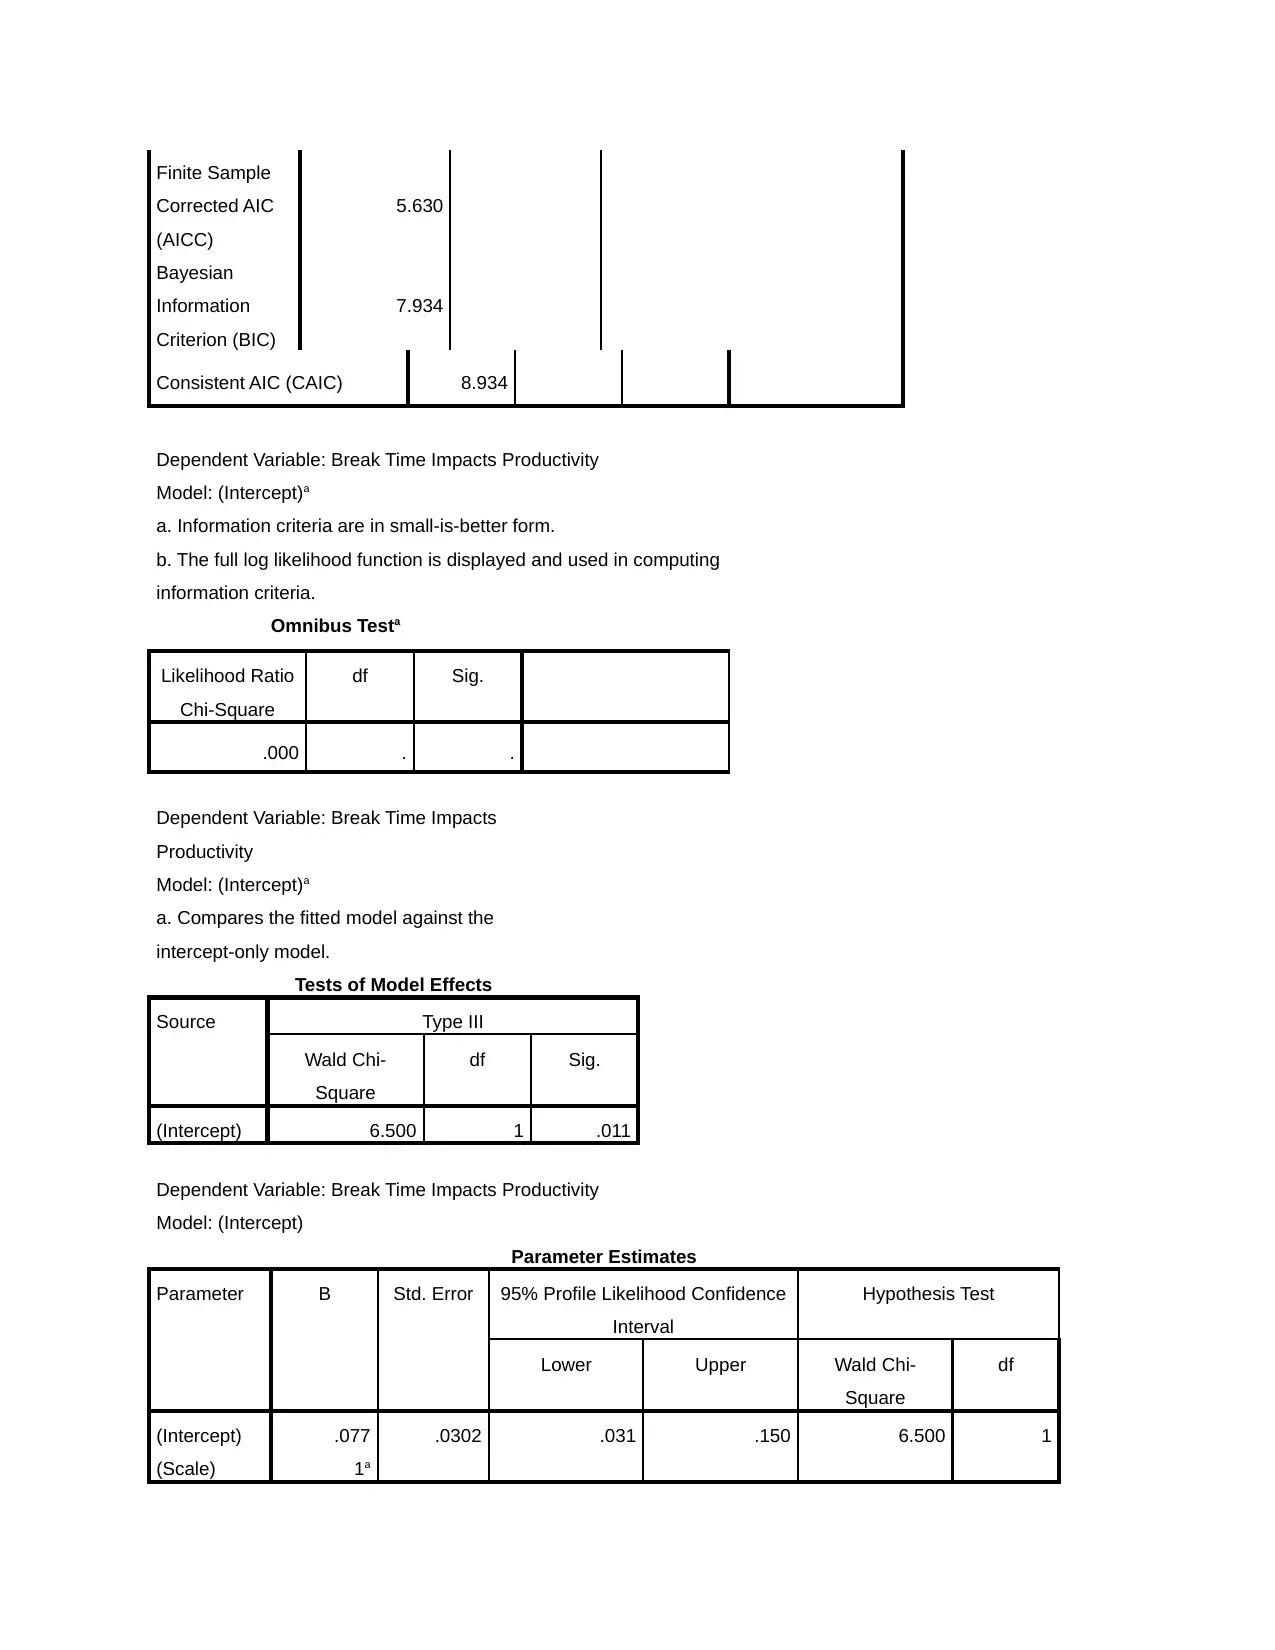
5.630
Bayesian
Information
Criterion (BIC)
7.934
Consistent AIC (CAIC) 8.934
Dependent Variable: Break Time Impacts Productivity
Model: (Intercept)a
a. Information criteria are in small-is-better form.
b. The full log likelihood function is displayed and used in computing
information criteria.
Omnibus Testa
Likelihood Ratio
Chi-Square
df Sig.
.000 . .
Dependent Variable: Break Time Impacts
Productivity
Model: (Intercept)a
a. Compares the fitted model against the
intercept-only model.
Tests of Model Effects
Source Type III
Wald Chi-
Square
df Sig.
(Intercept) 6.500 1 .011
Dependent Variable: Break Time Impacts Productivity
Model: (Intercept)
Parameter Estimates
Parameter B Std. Error 95% Profile Likelihood Confidence
Interval
Hypothesis Test
Lower Upper Wald Chi-
Square
df
(Intercept) .077 .0302 .031 .150 6.500 1
(Scale) 1a
Corrected AIC
(AICC)
5.630
Bayesian
Information
Criterion (BIC)
7.934
Consistent AIC (CAIC) 8.934
Dependent Variable: Break Time Impacts Productivity
Model: (Intercept)a
a. Information criteria are in small-is-better form.
b. The full log likelihood function is displayed and used in computing
information criteria.
Omnibus Testa
Likelihood Ratio
Chi-Square
df Sig.
.000 . .
Dependent Variable: Break Time Impacts
Productivity
Model: (Intercept)a
a. Compares the fitted model against the
intercept-only model.
Tests of Model Effects
Source Type III
Wald Chi-
Square
df Sig.
(Intercept) 6.500 1 .011
Dependent Variable: Break Time Impacts Productivity
Model: (Intercept)
Parameter Estimates
Parameter B Std. Error 95% Profile Likelihood Confidence
Interval
Hypothesis Test
Lower Upper Wald Chi-
Square
df
(Intercept) .077 .0302 .031 .150 6.500 1
(Scale) 1a
⊘ This is a preview!⊘
Do you want full access?
Subscribe today to unlock all pages.
Trusted by 1+ million students worldwide
Parameter Estimates
Parameter Hypothesis Test
Sig.
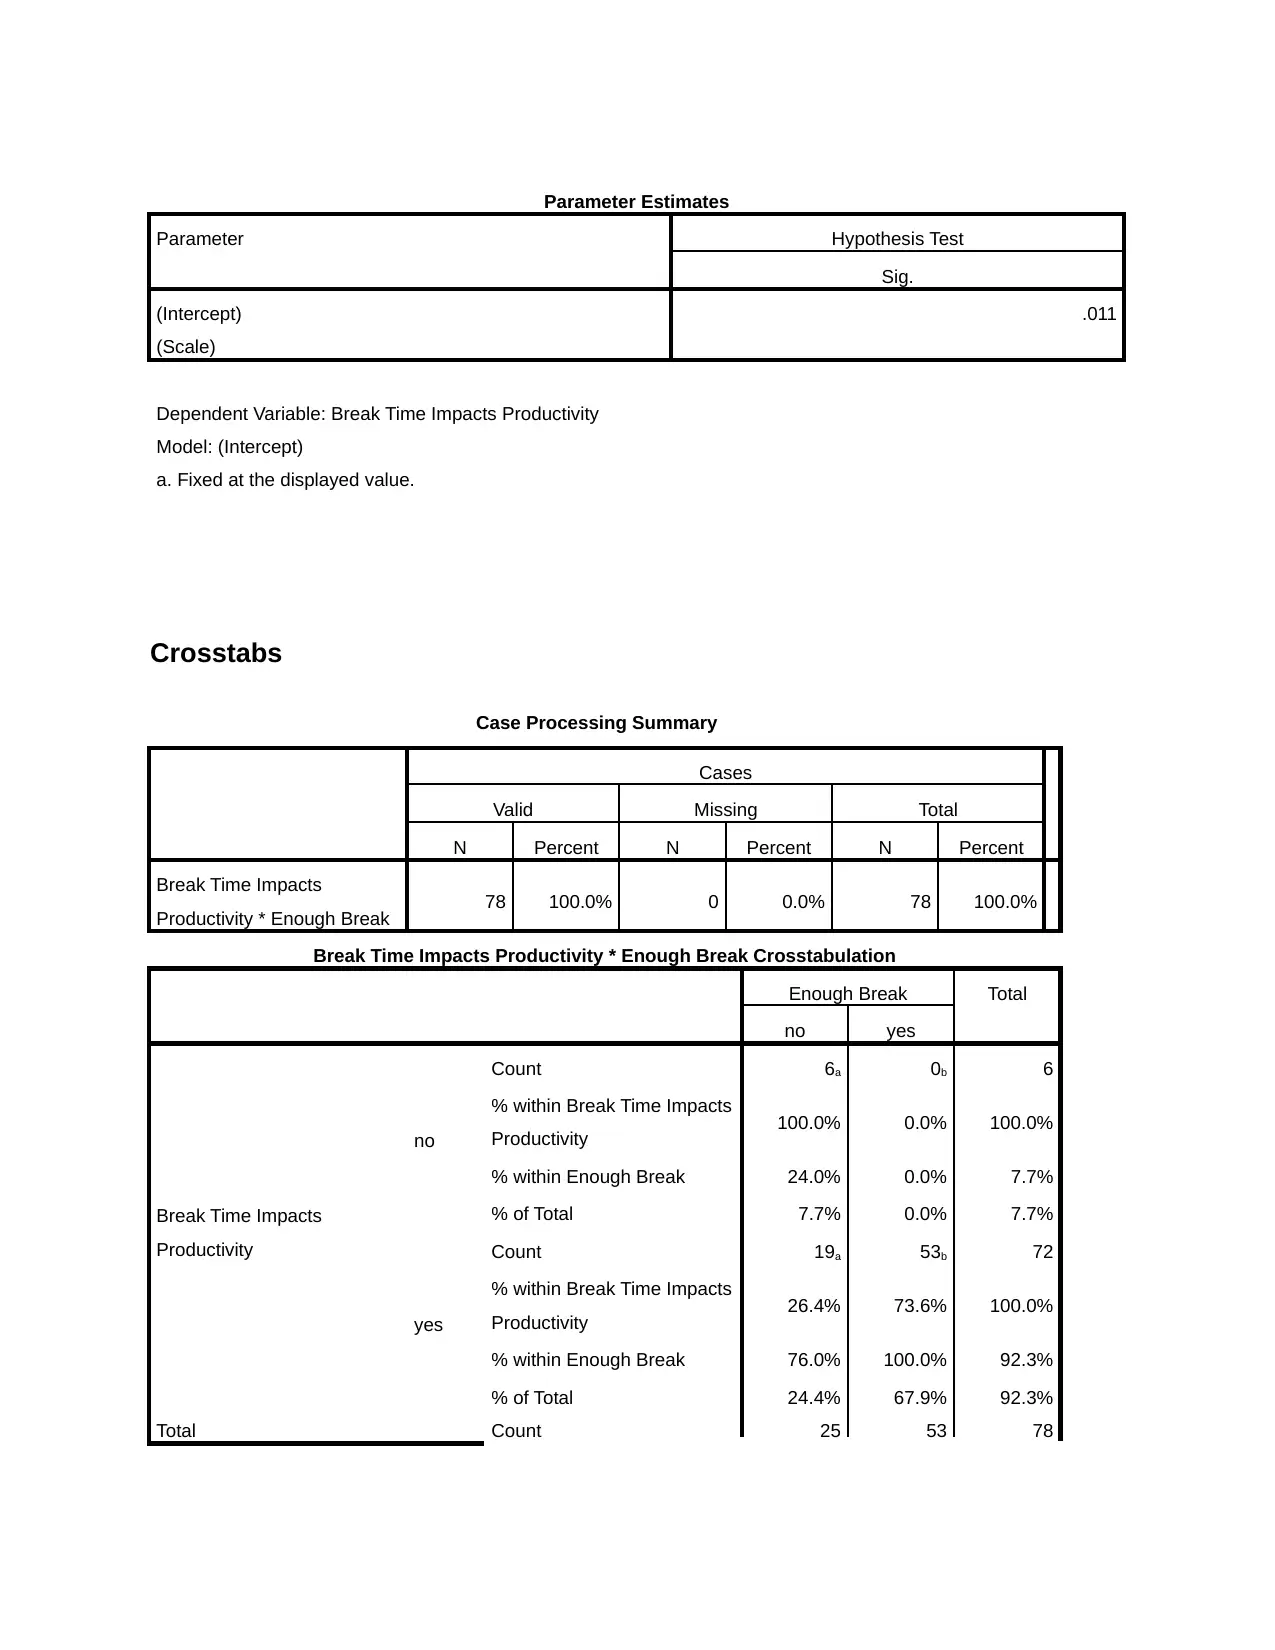
(Intercept) .011
(Scale)
Dependent Variable: Break Time Impacts Productivity
Model: (Intercept)
a. Fixed at the displayed value.
Crosstabs
Case Processing Summary
Cases
Valid Missing Total
N Percent N Percent N Percent
Break Time Impacts
Productivity * Enough Break 78 100.0% 0 0.0% 78 100.0%
Break Time Impacts Productivity * Enough Break Crosstabulation
Enough Break Total
no yes
Break Time Impacts
Productivity
no
Count 6a 0b 6
% within Break Time Impacts
Productivity 100.0% 0.0% 100.0%
% within Enough Break 24.0% 0.0% 7.7%
% of Total 7.7% 0.0% 7.7%
yes
Count 19a 53b 72
% within Break Time Impacts
Productivity 26.4% 73.6% 100.0%
% within Enough Break 76.0% 100.0% 92.3%
% of Total 24.4% 67.9% 92.3%
Total Count 25 53 78
Parameter Hypothesis Test
Sig.
(Intercept) .011
(Scale)
Dependent Variable: Break Time Impacts Productivity
Model: (Intercept)
a. Fixed at the displayed value.
Crosstabs
Case Processing Summary
Cases
Valid Missing Total
N Percent N Percent N Percent
Break Time Impacts
Productivity * Enough Break 78 100.0% 0 0.0% 78 100.0%
Break Time Impacts Productivity * Enough Break Crosstabulation
Enough Break Total
no yes
Break Time Impacts
Productivity
no
Count 6a 0b 6
% within Break Time Impacts
Productivity 100.0% 0.0% 100.0%
% within Enough Break 24.0% 0.0% 7.7%
% of Total 7.7% 0.0% 7.7%
yes
Count 19a 53b 72
% within Break Time Impacts
Productivity 26.4% 73.6% 100.0%
% within Enough Break 76.0% 100.0% 92.3%
% of Total 24.4% 67.9% 92.3%
Total Count 25 53 78
Paraphrase This Document
Need a fresh take? Get an instant paraphrase of this document with our AI Paraphraser
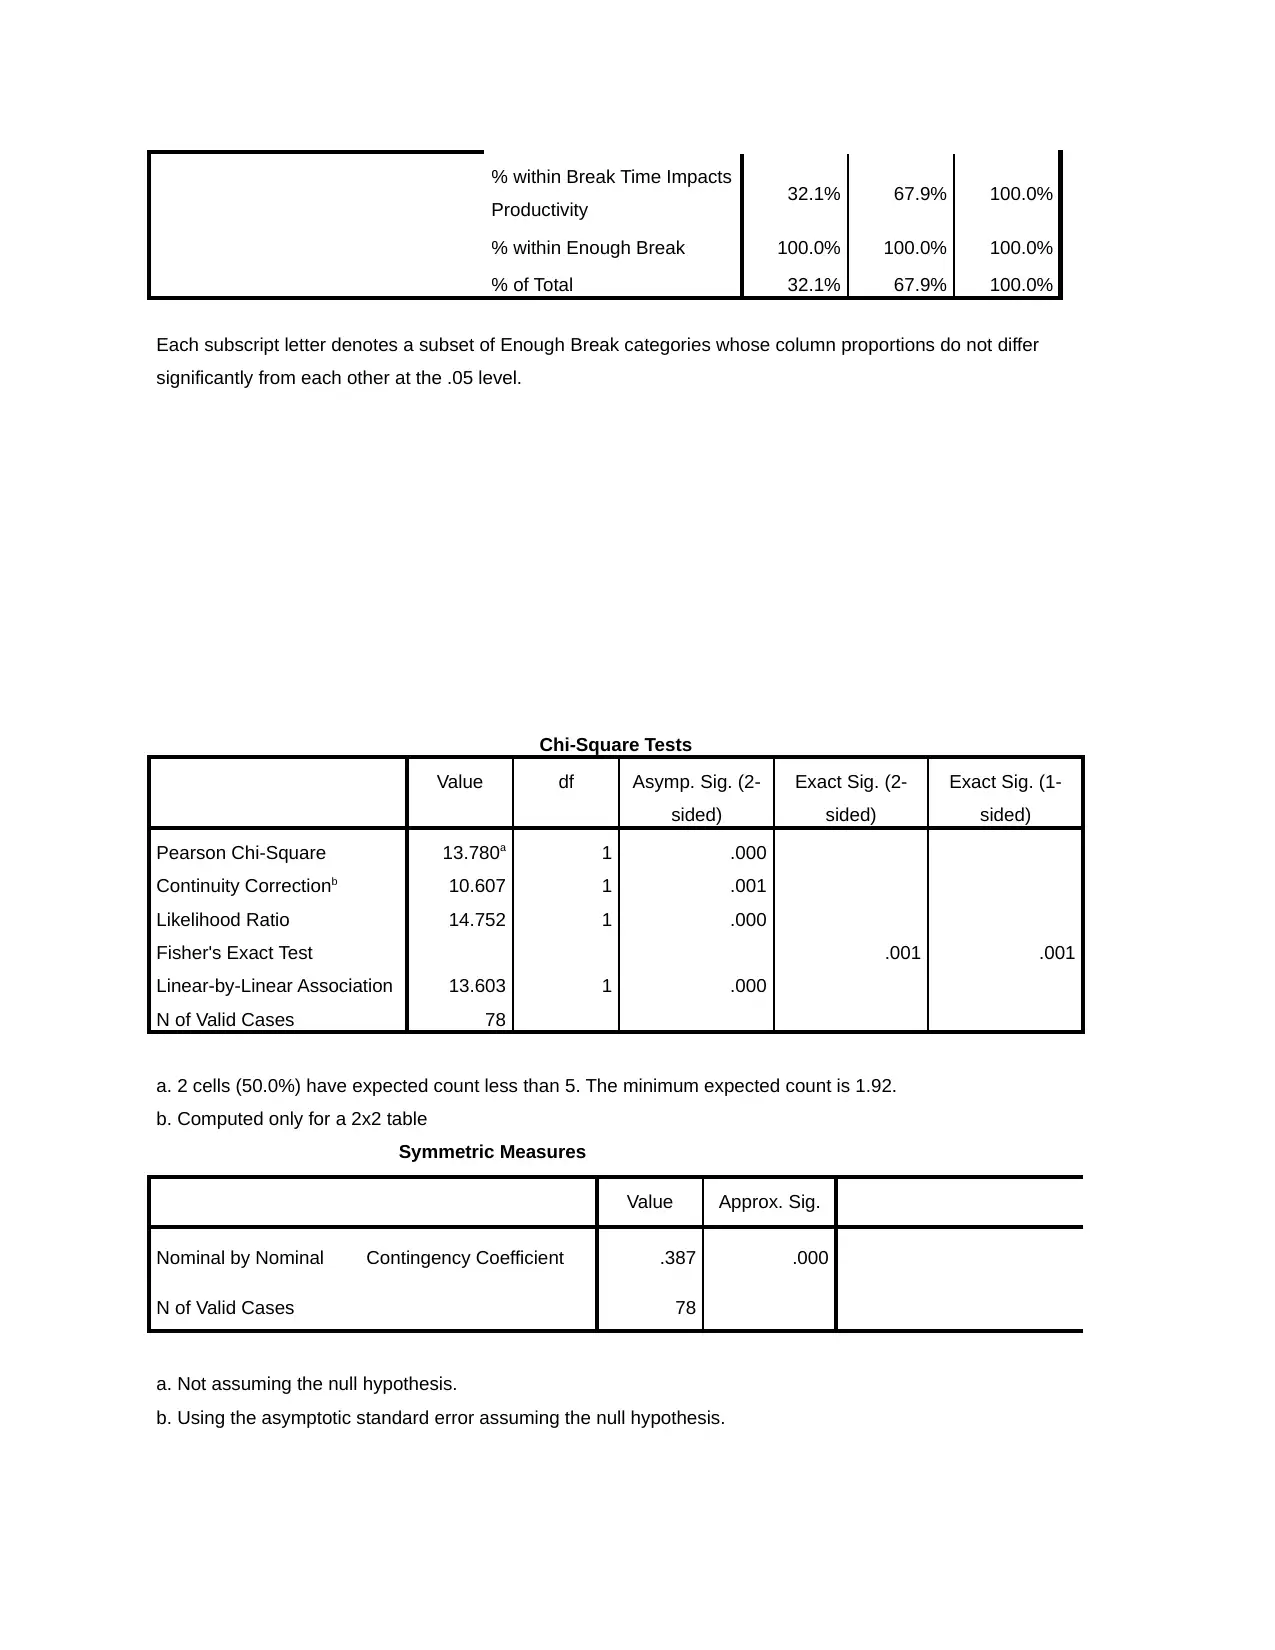
% within Break Time Impacts
Productivity 32.1% 67.9% 100.0%
% within Enough Break 100.0% 100.0% 100.0%
% of Total 32.1% 67.9% 100.0%
Each subscript letter denotes a subset of Enough Break categories whose column proportions do not differ
significantly from each other at the .05 level.
Chi-Square Tests
Value df Asymp. Sig. (2-
sided)
Exact Sig. (2-
sided)
Exact Sig. (1-
sided)
Pearson Chi-Square 13.780a 1 .000
Continuity Correctionb 10.607 1 .001
Likelihood Ratio 14.752 1 .000
Fisher's Exact Test .001 .001
Linear-by-Linear Association 13.603 1 .000
N of Valid Cases 78
a. 2 cells (50.0%) have expected count less than 5. The minimum expected count is 1.92.
b. Computed only for a 2x2 table
Symmetric Measures
Value Approx. Sig.
Nominal by Nominal Contingency Coefficient .387 .000
N of Valid Cases 78
a. Not assuming the null hypothesis.
b. Using the asymptotic standard error assuming the null hypothesis.
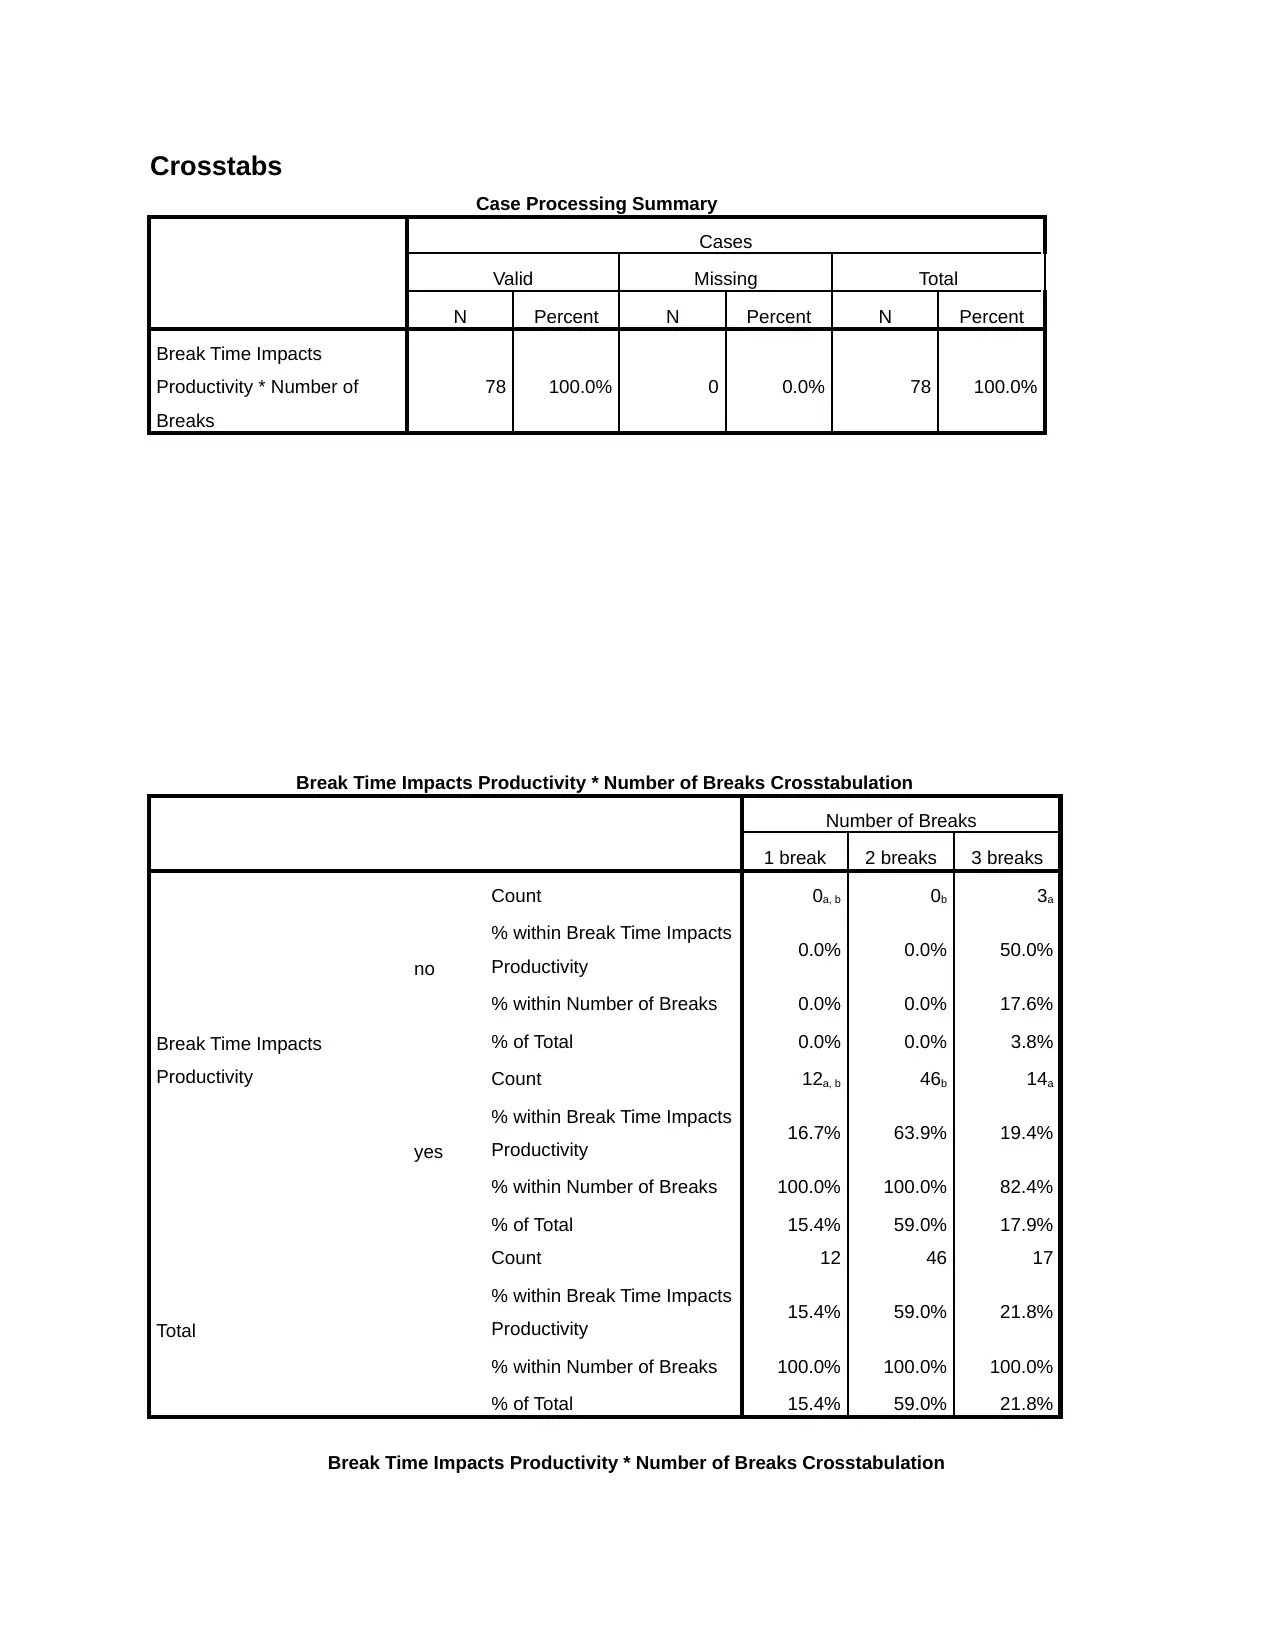
Crosstabs
Case Processing Summary
Cases
Valid Missing Total
N Percent N Percent N Percent
Break Time Impacts
Productivity * Number of
Breaks
78 100.0% 0 0.0% 78 100.0%
Break Time Impacts Productivity * Number of Breaks Crosstabulation
Number of Breaks
1 break 2 breaks 3 breaks
Break Time Impacts
Productivity
no
Count 0a, b 0b 3a
% within Break Time Impacts
Productivity 0.0% 0.0% 50.0%
% within Number of Breaks 0.0% 0.0% 17.6%
% of Total 0.0% 0.0% 3.8%
yes
Count 12a, b 46b 14a
% within Break Time Impacts
Productivity 16.7% 63.9% 19.4%
% within Number of Breaks 100.0% 100.0% 82.4%
% of Total 15.4% 59.0% 17.9%
Total
Count 12 46 17
% within Break Time Impacts
Productivity 15.4% 59.0% 21.8%
% within Number of Breaks 100.0% 100.0% 100.0%
% of Total 15.4% 59.0% 21.8%
Break Time Impacts Productivity * Number of Breaks Crosstabulation
⊘ This is a preview!⊘
Do you want full access?
Subscribe today to unlock all pages.
Trusted by 1+ million students worldwide
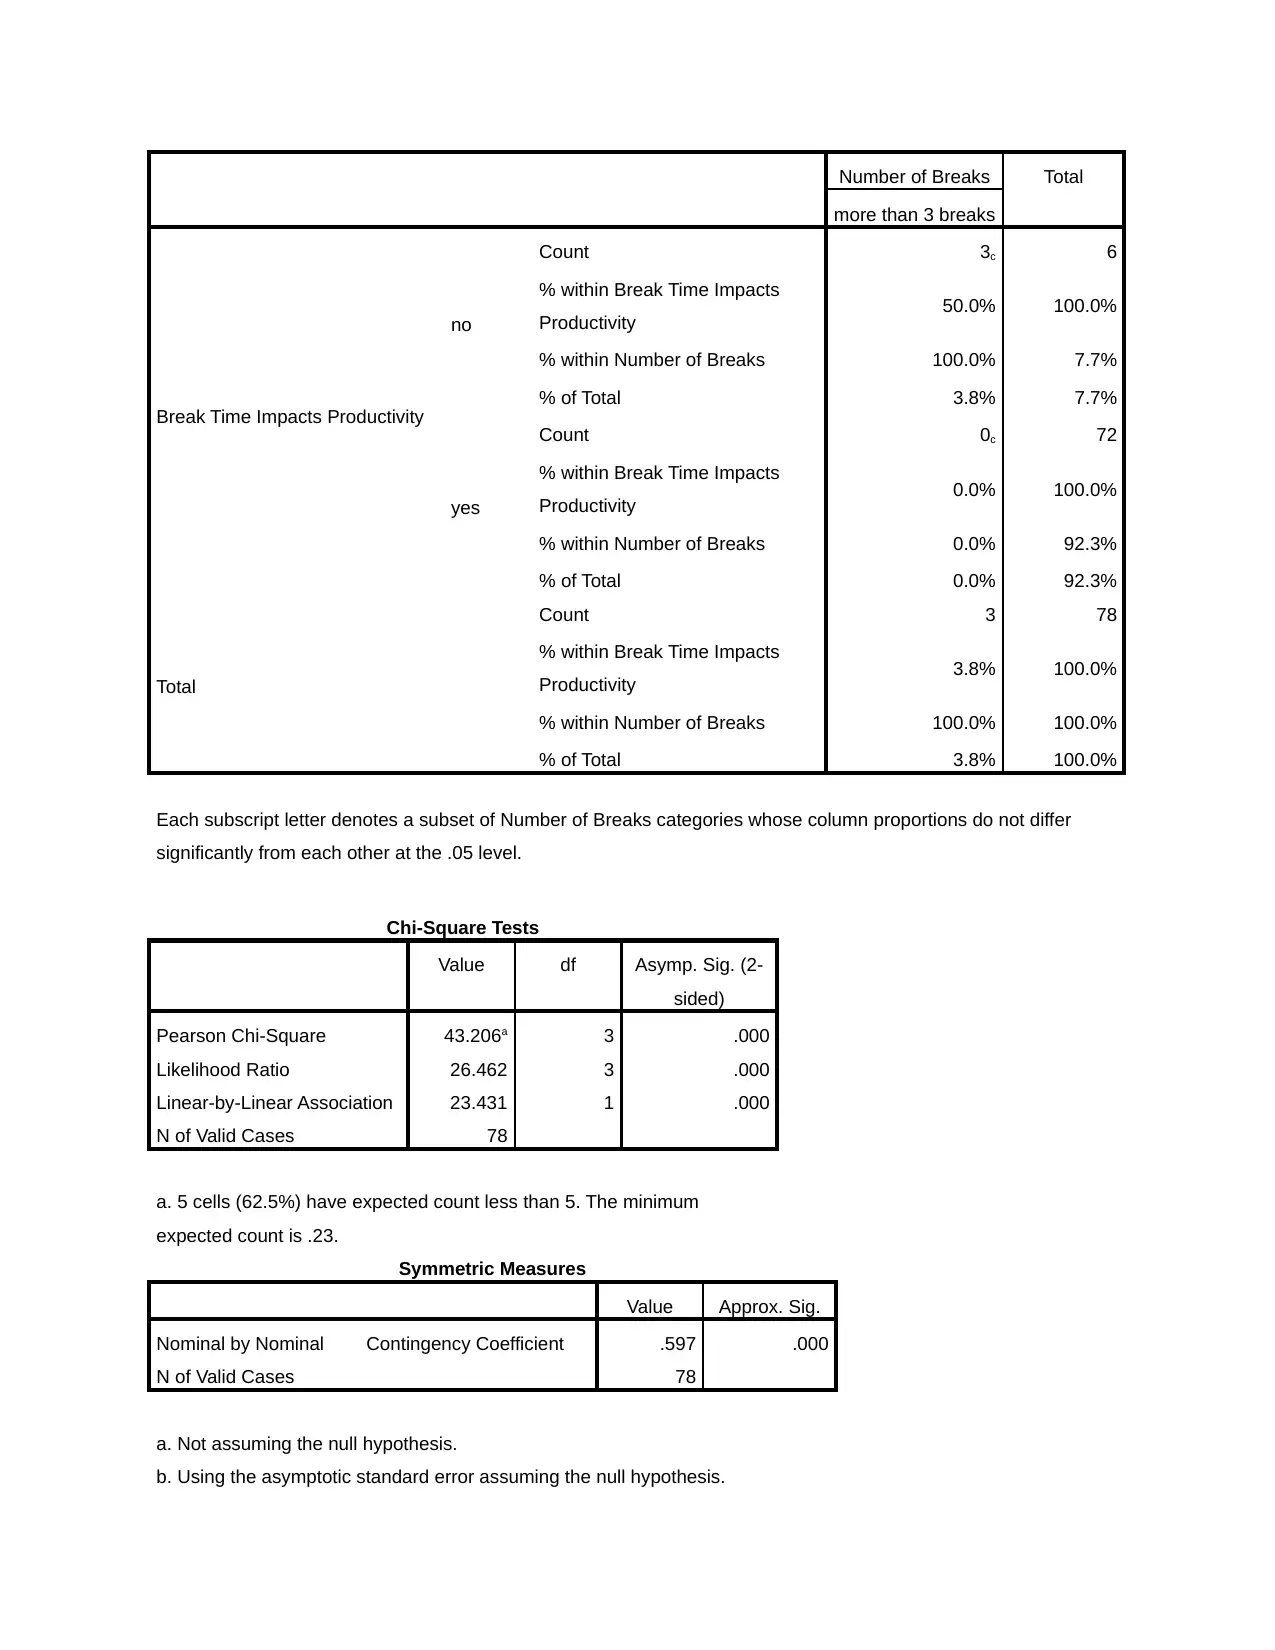
Number of Breaks Total
more than 3 breaks
Break Time Impacts Productivity
no
Count 3c 6
% within Break Time Impacts
Productivity 50.0% 100.0%
% within Number of Breaks 100.0% 7.7%
% of Total 3.8% 7.7%
yes
Count 0c 72
% within Break Time Impacts
Productivity 0.0% 100.0%
% within Number of Breaks 0.0% 92.3%
% of Total 0.0% 92.3%
Total
Count 3 78
% within Break Time Impacts
Productivity 3.8% 100.0%
% within Number of Breaks 100.0% 100.0%
% of Total 3.8% 100.0%
Each subscript letter denotes a subset of Number of Breaks categories whose column proportions do not differ
significantly from each other at the .05 level.
Chi-Square Tests
Value df Asymp. Sig. (2-
sided)
Pearson Chi-Square 43.206a 3 .000
Likelihood Ratio 26.462 3 .000
Linear-by-Linear Association 23.431 1 .000
N of Valid Cases 78
a. 5 cells (62.5%) have expected count less than 5. The minimum
expected count is .23.
Symmetric Measures
Value Approx. Sig.
Nominal by Nominal Contingency Coefficient .597 .000
N of Valid Cases 78
a. Not assuming the null hypothesis.
b. Using the asymptotic standard error assuming the null hypothesis.
Paraphrase This Document
Need a fresh take? Get an instant paraphrase of this document with our AI Paraphraser
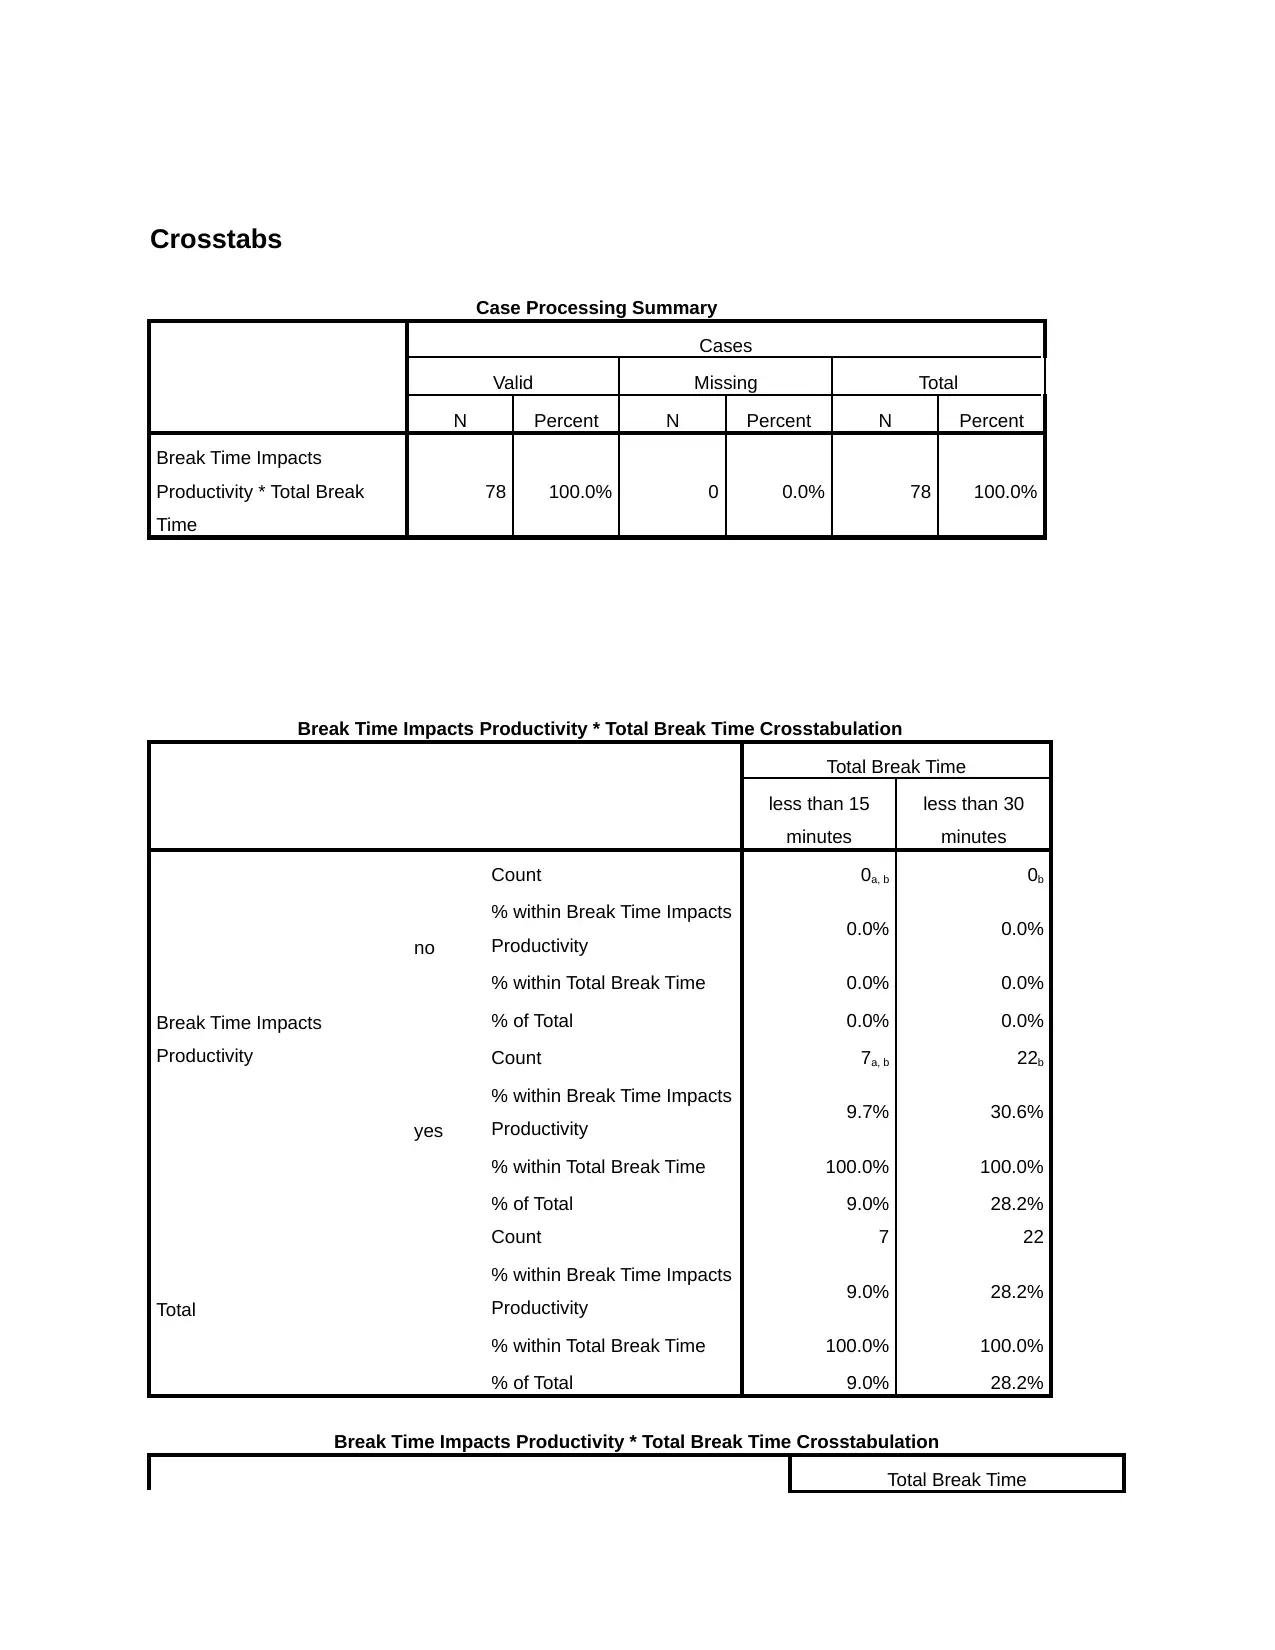
Crosstabs
Case Processing Summary
Cases
Valid Missing Total
N Percent N Percent N Percent
Break Time Impacts
Productivity * Total Break
Time
78 100.0% 0 0.0% 78 100.0%
Break Time Impacts Productivity * Total Break Time Crosstabulation
Total Break Time
less than 15
minutes
less than 30
minutes
Break Time Impacts
Productivity
no
Count 0a, b 0b
% within Break Time Impacts
Productivity 0.0% 0.0%
% within Total Break Time 0.0% 0.0%
% of Total 0.0% 0.0%
yes
Count 7a, b 22b
% within Break Time Impacts
Productivity 9.7% 30.6%
% within Total Break Time 100.0% 100.0%
% of Total 9.0% 28.2%
Total
Count 7 22
% within Break Time Impacts
Productivity 9.0% 28.2%
% within Total Break Time 100.0% 100.0%
% of Total 9.0% 28.2%
Break Time Impacts Productivity * Total Break Time Crosstabulation
Total Break Time
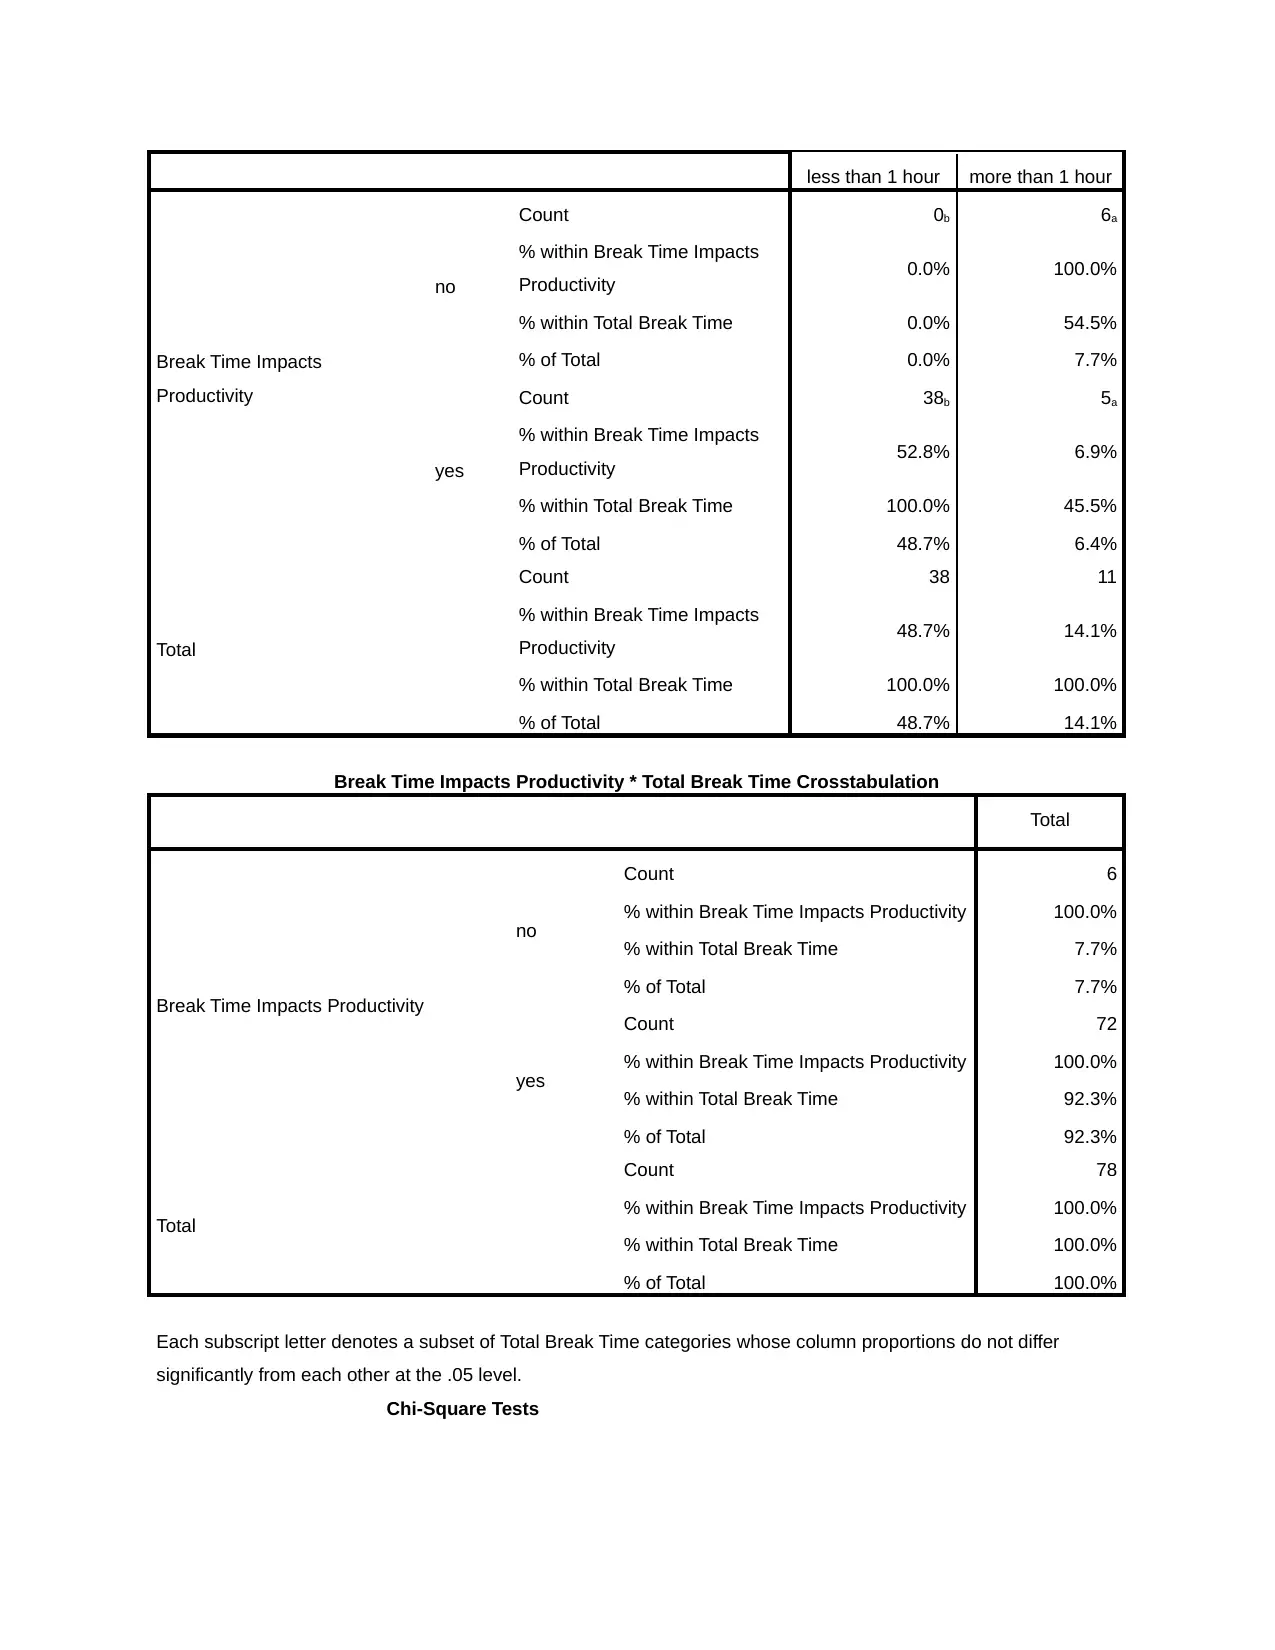
less than 1 hour more than 1 hour
Break Time Impacts
Productivity
no
Count 0b 6a
% within Break Time Impacts
Productivity 0.0% 100.0%
% within Total Break Time 0.0% 54.5%
% of Total 0.0% 7.7%
yes
Count 38b 5a
% within Break Time Impacts
Productivity 52.8% 6.9%
% within Total Break Time 100.0% 45.5%
% of Total 48.7% 6.4%
Total
Count 38 11
% within Break Time Impacts
Productivity 48.7% 14.1%
% within Total Break Time 100.0% 100.0%
% of Total 48.7% 14.1%
Break Time Impacts Productivity * Total Break Time Crosstabulation
Total
Break Time Impacts Productivity
no
Count 6
% within Break Time Impacts Productivity 100.0%
% within Total Break Time 7.7%
% of Total 7.7%
yes
Count 72
% within Break Time Impacts Productivity 100.0%
% within Total Break Time 92.3%
% of Total 92.3%
Total
Count 78
% within Break Time Impacts Productivity 100.0%
% within Total Break Time 100.0%
% of Total 100.0%
Each subscript letter denotes a subset of Total Break Time categories whose column proportions do not differ
significantly from each other at the .05 level.
Chi-Square Tests
⊘ This is a preview!⊘
Do you want full access?
Subscribe today to unlock all pages.
Trusted by 1+ million students worldwide
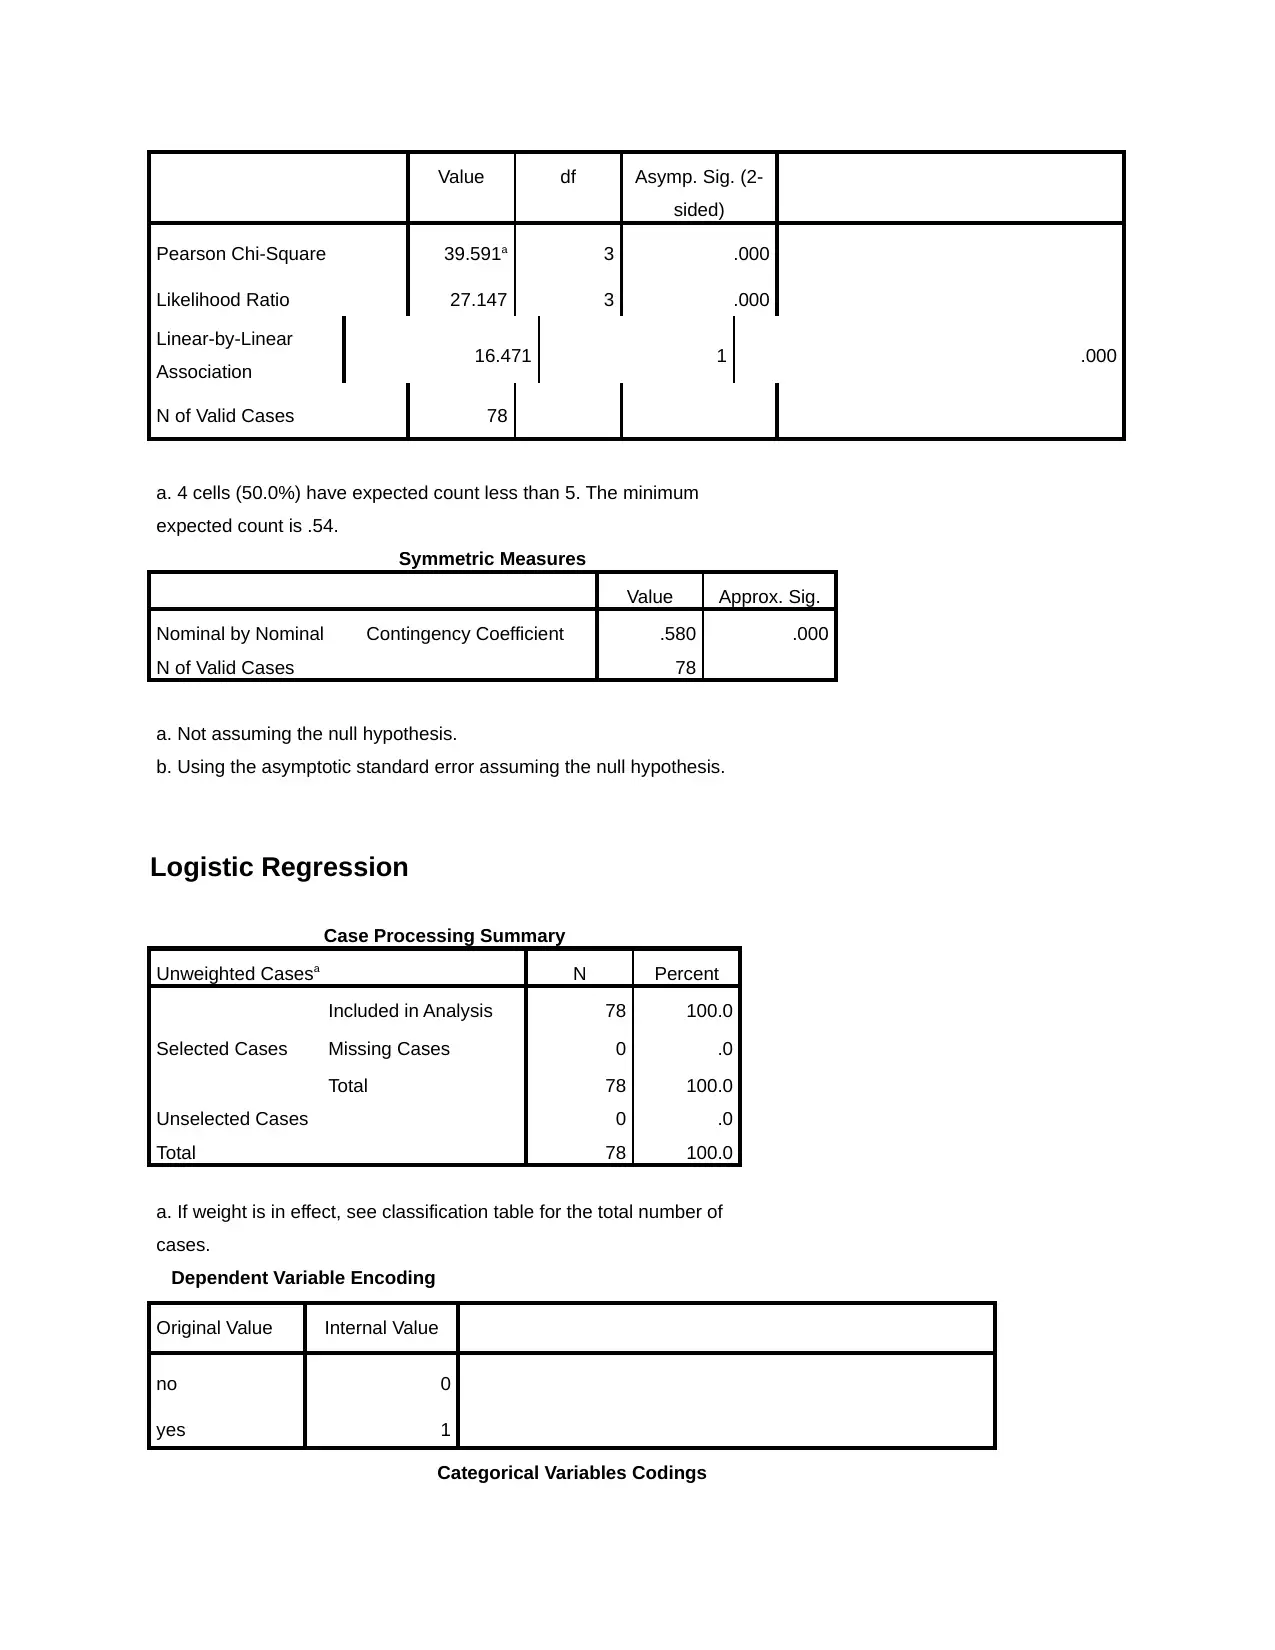
Value df Asymp. Sig. (2-
sided)
Pearson Chi-Square 39.591a 3 .000
Likelihood Ratio 27.147 3 .000
Linear-by-Linear
Association 16.471 1 .000
N of Valid Cases 78
a. 4 cells (50.0%) have expected count less than 5. The minimum
expected count is .54.
Symmetric Measures
Value Approx. Sig.
Nominal by Nominal Contingency Coefficient .580 .000
N of Valid Cases 78
a. Not assuming the null hypothesis.
b. Using the asymptotic standard error assuming the null hypothesis.
Logistic Regression
Case Processing Summary
Unweighted Casesa N Percent
Selected Cases
Included in Analysis 78 100.0
Missing Cases 0 .0
Total 78 100.0
Unselected Cases 0 .0
Total 78 100.0
a. If weight is in effect, see classification table for the total number of
cases.
Dependent Variable Encoding
Original Value Internal Value
no 0
yes 1
Categorical Variables Codings
Paraphrase This Document
Need a fresh take? Get an instant paraphrase of this document with our AI Paraphraser
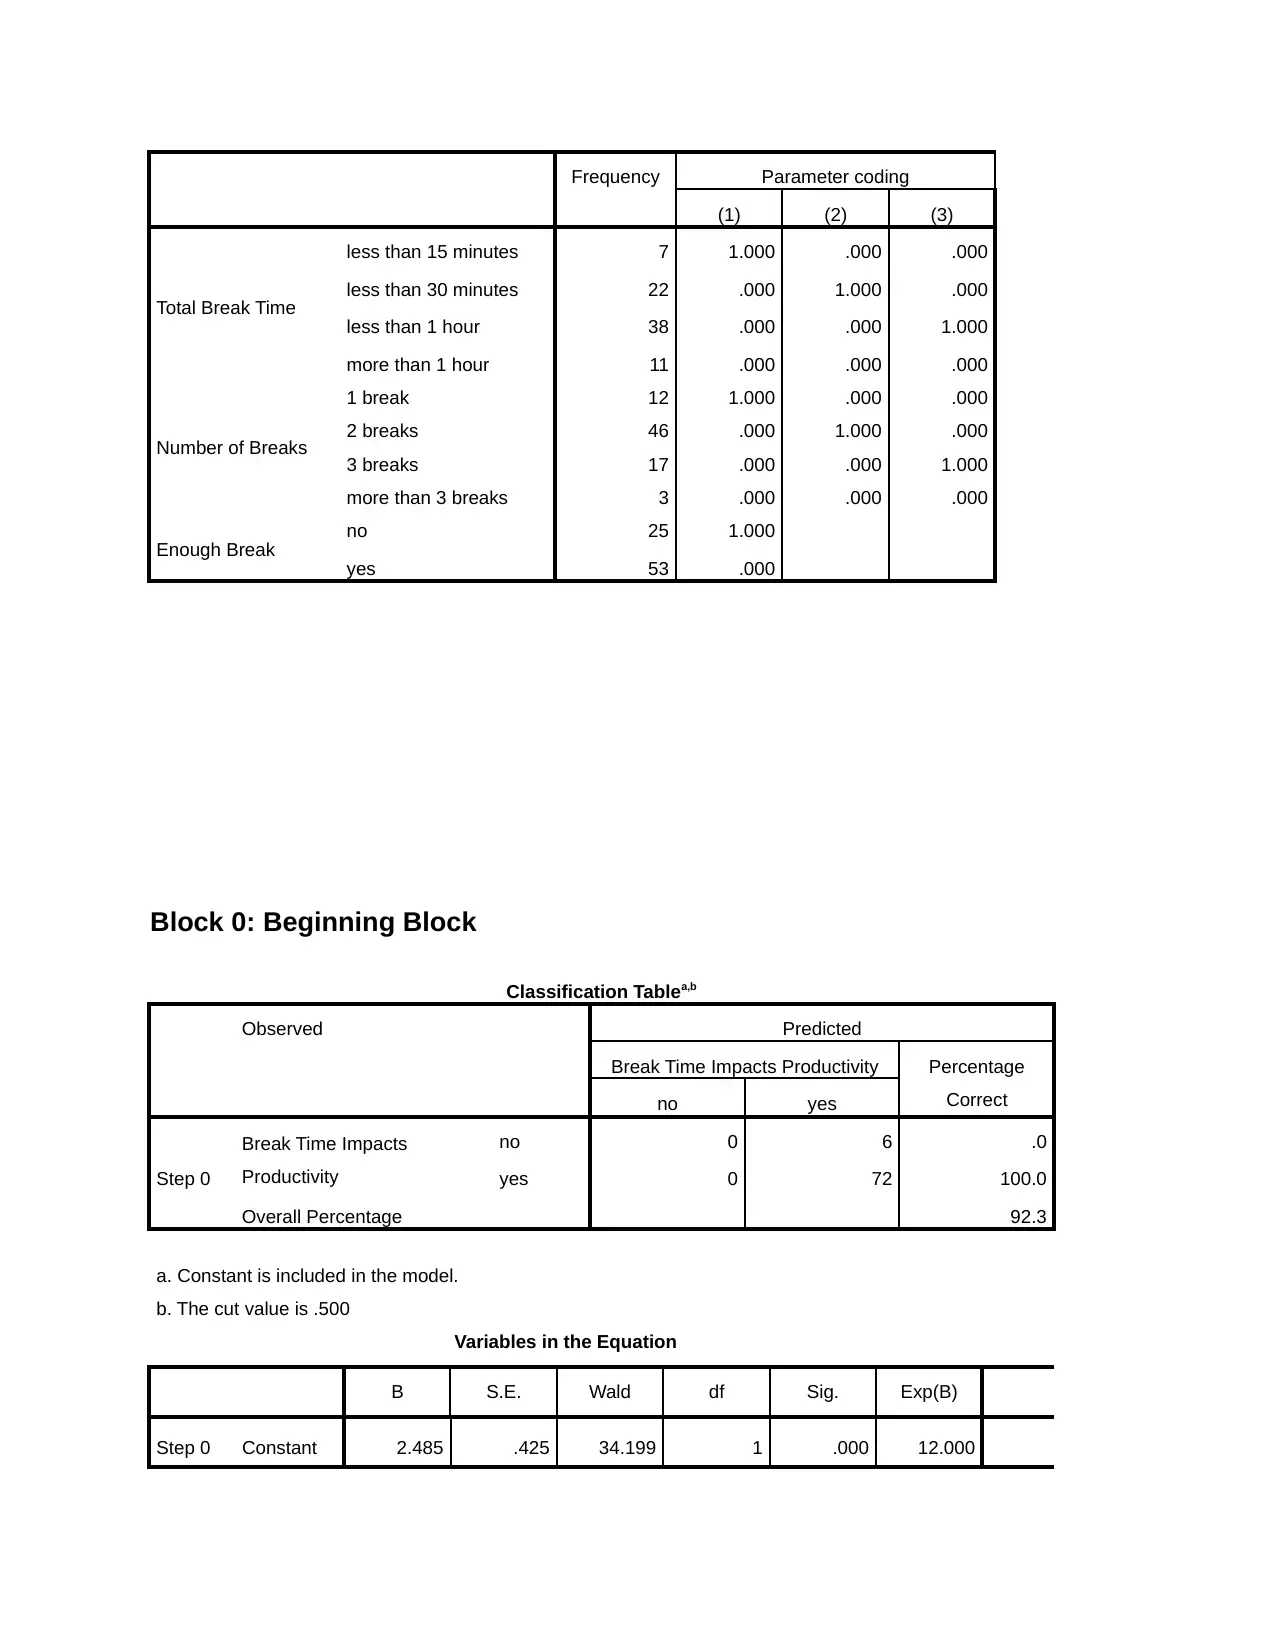
Frequency Parameter coding
(1) (2) (3)
Total Break Time
less than 15 minutes 7 1.000 .000 .000
less than 30 minutes 22 .000 1.000 .000
less than 1 hour 38 .000 .000 1.000
more than 1 hour 11 .000 .000 .000
Number of Breaks
1 break 12 1.000 .000 .000
2 breaks 46 .000 1.000 .000
3 breaks 17 .000 .000 1.000
more than 3 breaks 3 .000 .000 .000
Enough Break no 25 1.000
yes 53 .000
Block 0: Beginning Block
Classification Tablea,b
Observed Predicted
Break Time Impacts Productivity Percentage
Correctno yes
Step 0
Break Time Impacts
Productivity
no 0 6 .0
yes 0 72 100.0
Overall Percentage 92.3
a. Constant is included in the model.
b. The cut value is .500
Variables in the Equation
B S.E. Wald df Sig. Exp(B)
Step 0 Constant 2.485 .425 34.199 1 .000 12.000
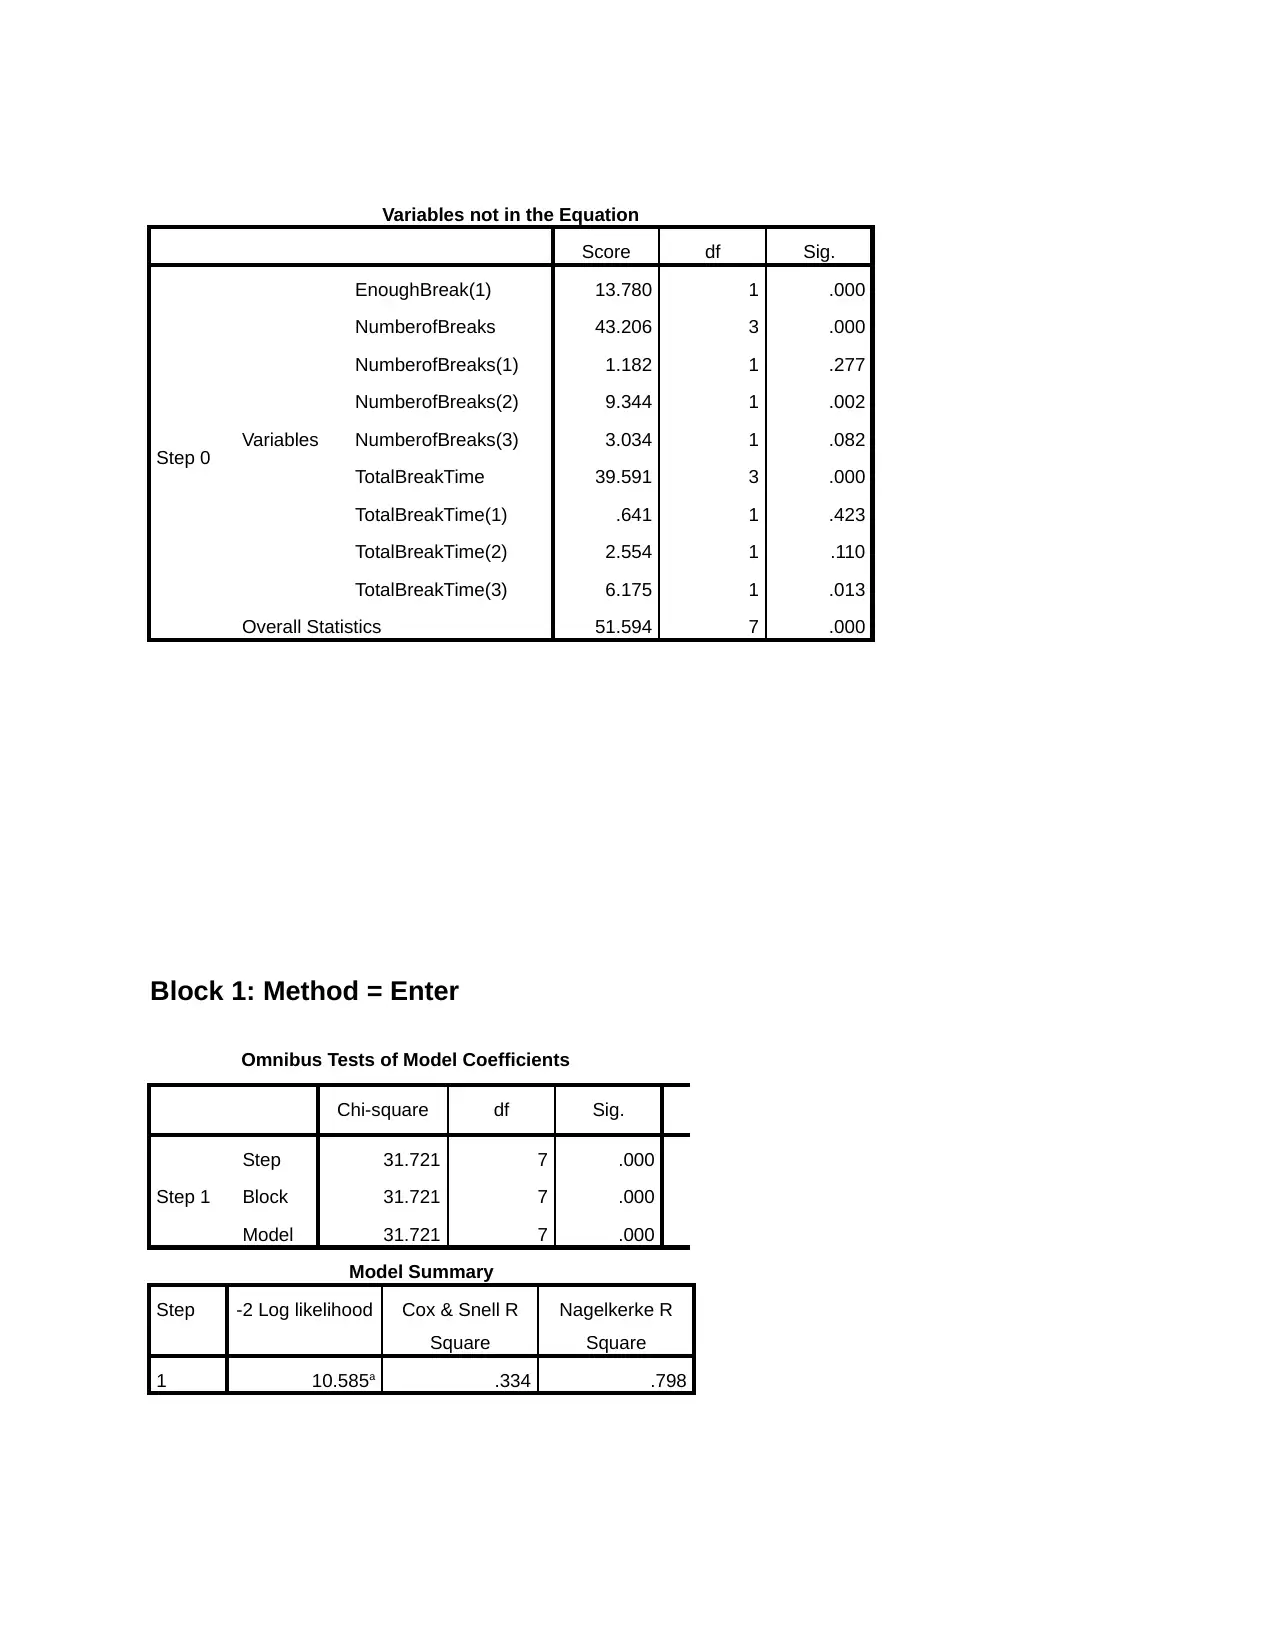
Variables not in the Equation
Score df Sig.
Step 0 Variables
EnoughBreak(1) 13.780 1 .000
NumberofBreaks 43.206 3 .000
NumberofBreaks(1) 1.182 1 .277
NumberofBreaks(2) 9.344 1 .002
NumberofBreaks(3) 3.034 1 .082
TotalBreakTime 39.591 3 .000
TotalBreakTime(1) .641 1 .423
TotalBreakTime(2) 2.554 1 .110
TotalBreakTime(3) 6.175 1 .013
Overall Statistics 51.594 7 .000
Block 1: Method = Enter
Omnibus Tests of Model Coefficients
Chi-square df Sig.
Step 1
Step 31.721 7 .000
Block 31.721 7 .000
Model 31.721 7 .000
Model Summary
Step -2 Log likelihood Cox & Snell R
Square
Nagelkerke R
Square
1 10.585a .334 .798
⊘ This is a preview!⊘
Do you want full access?
Subscribe today to unlock all pages.
Trusted by 1+ million students worldwide
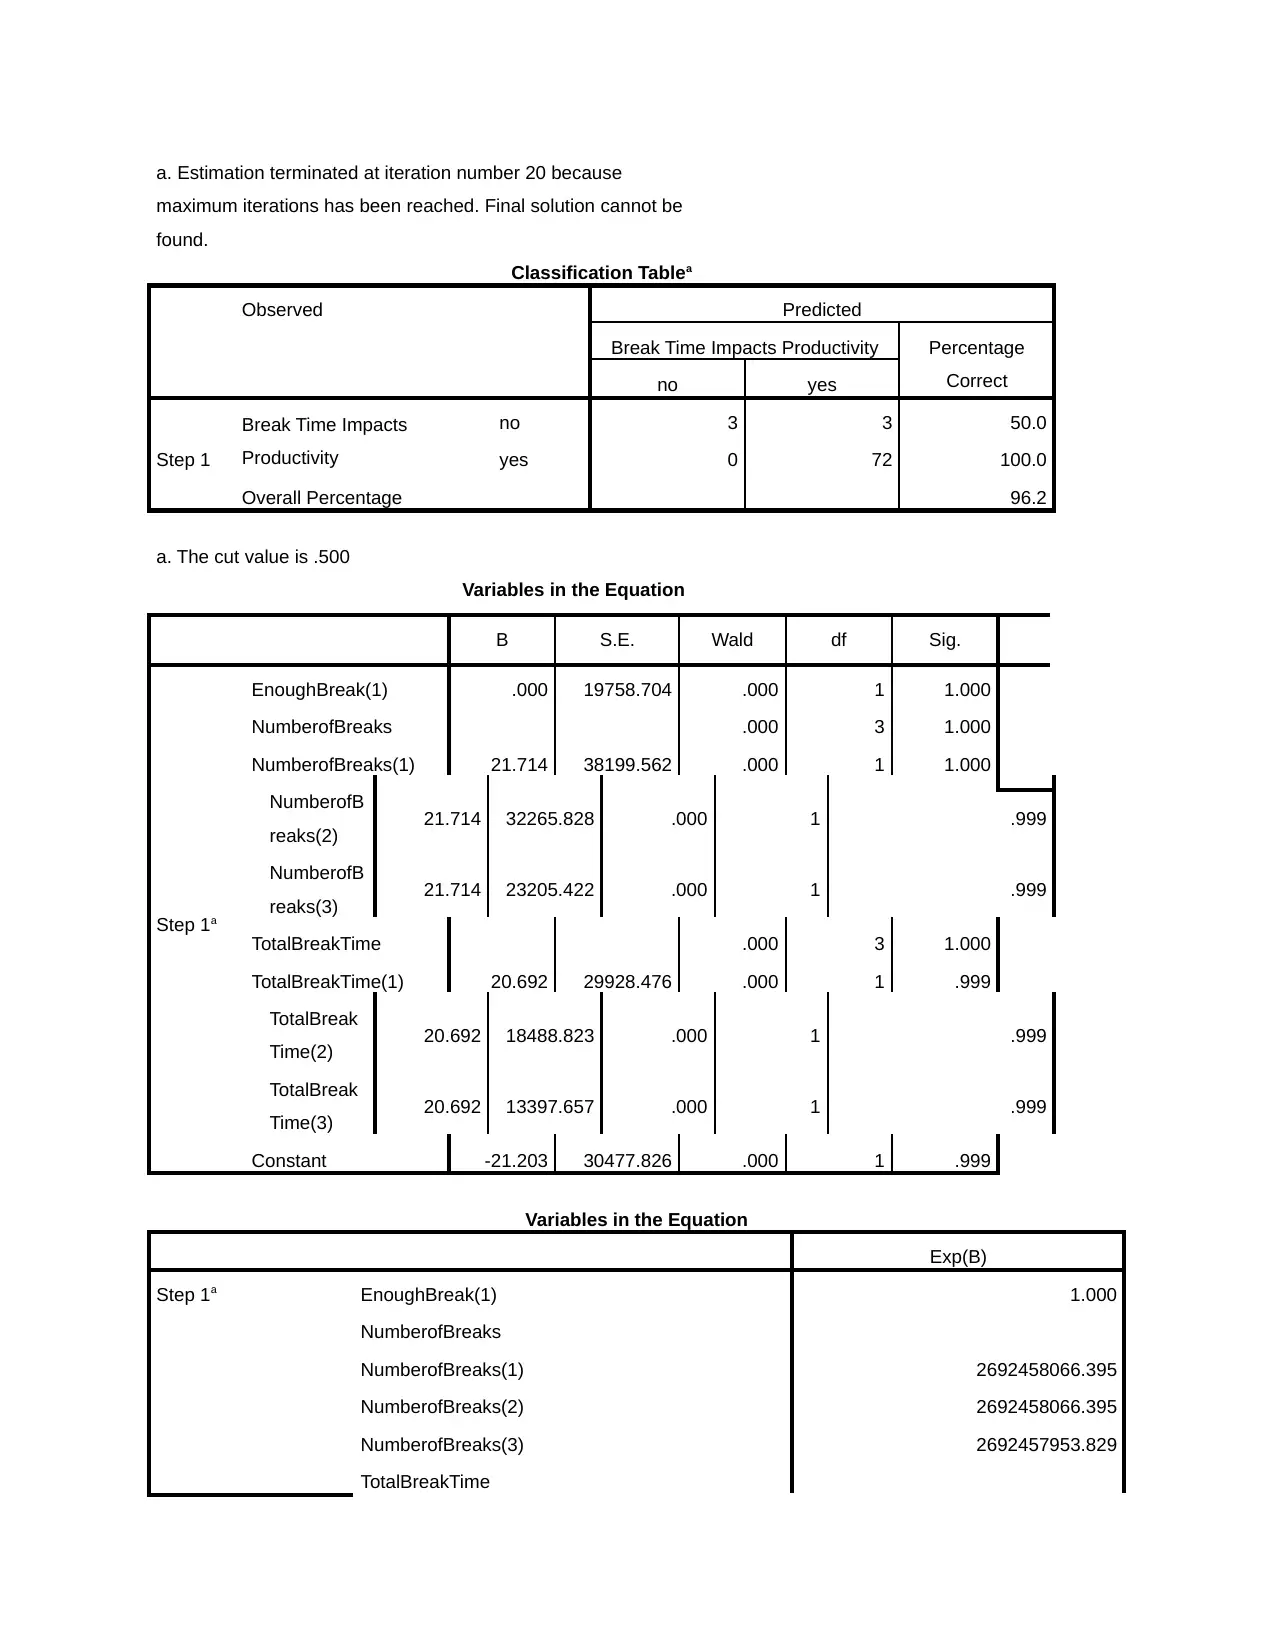
a. Estimation terminated at iteration number 20 because
maximum iterations has been reached. Final solution cannot be
found.
Classification Tablea
Observed Predicted
Break Time Impacts Productivity Percentage
Correctno yes
Step 1
Break Time Impacts
Productivity
no 3 3 50.0
yes 0 72 100.0
Overall Percentage 96.2
a. The cut value is .500
Variables in the Equation
B S.E. Wald df Sig.
Step 1a
EnoughBreak(1) .000 19758.704 .000 1 1.000
NumberofBreaks .000 3 1.000
NumberofBreaks(1) 21.714 38199.562 .000 1 1.000
NumberofB
reaks(2) 21.714 32265.828 .000 1 .999
NumberofB
reaks(3) 21.714 23205.422 .000 1 .999
TotalBreakTime .000 3 1.000
TotalBreakTime(1) 20.692 29928.476 .000 1 .999
TotalBreak
Time(2) 20.692 18488.823 .000 1 .999
TotalBreak
Time(3) 20.692 13397.657 .000 1 .999
Constant -21.203 30477.826 .000 1 .999
Variables in the Equation
Exp(B)
Step 1a EnoughBreak(1) 1.000
NumberofBreaks
NumberofBreaks(1) 2692458066.395
NumberofBreaks(2) 2692458066.395
NumberofBreaks(3) 2692457953.829
TotalBreakTime
Paraphrase This Document
Need a fresh take? Get an instant paraphrase of this document with our AI Paraphraser
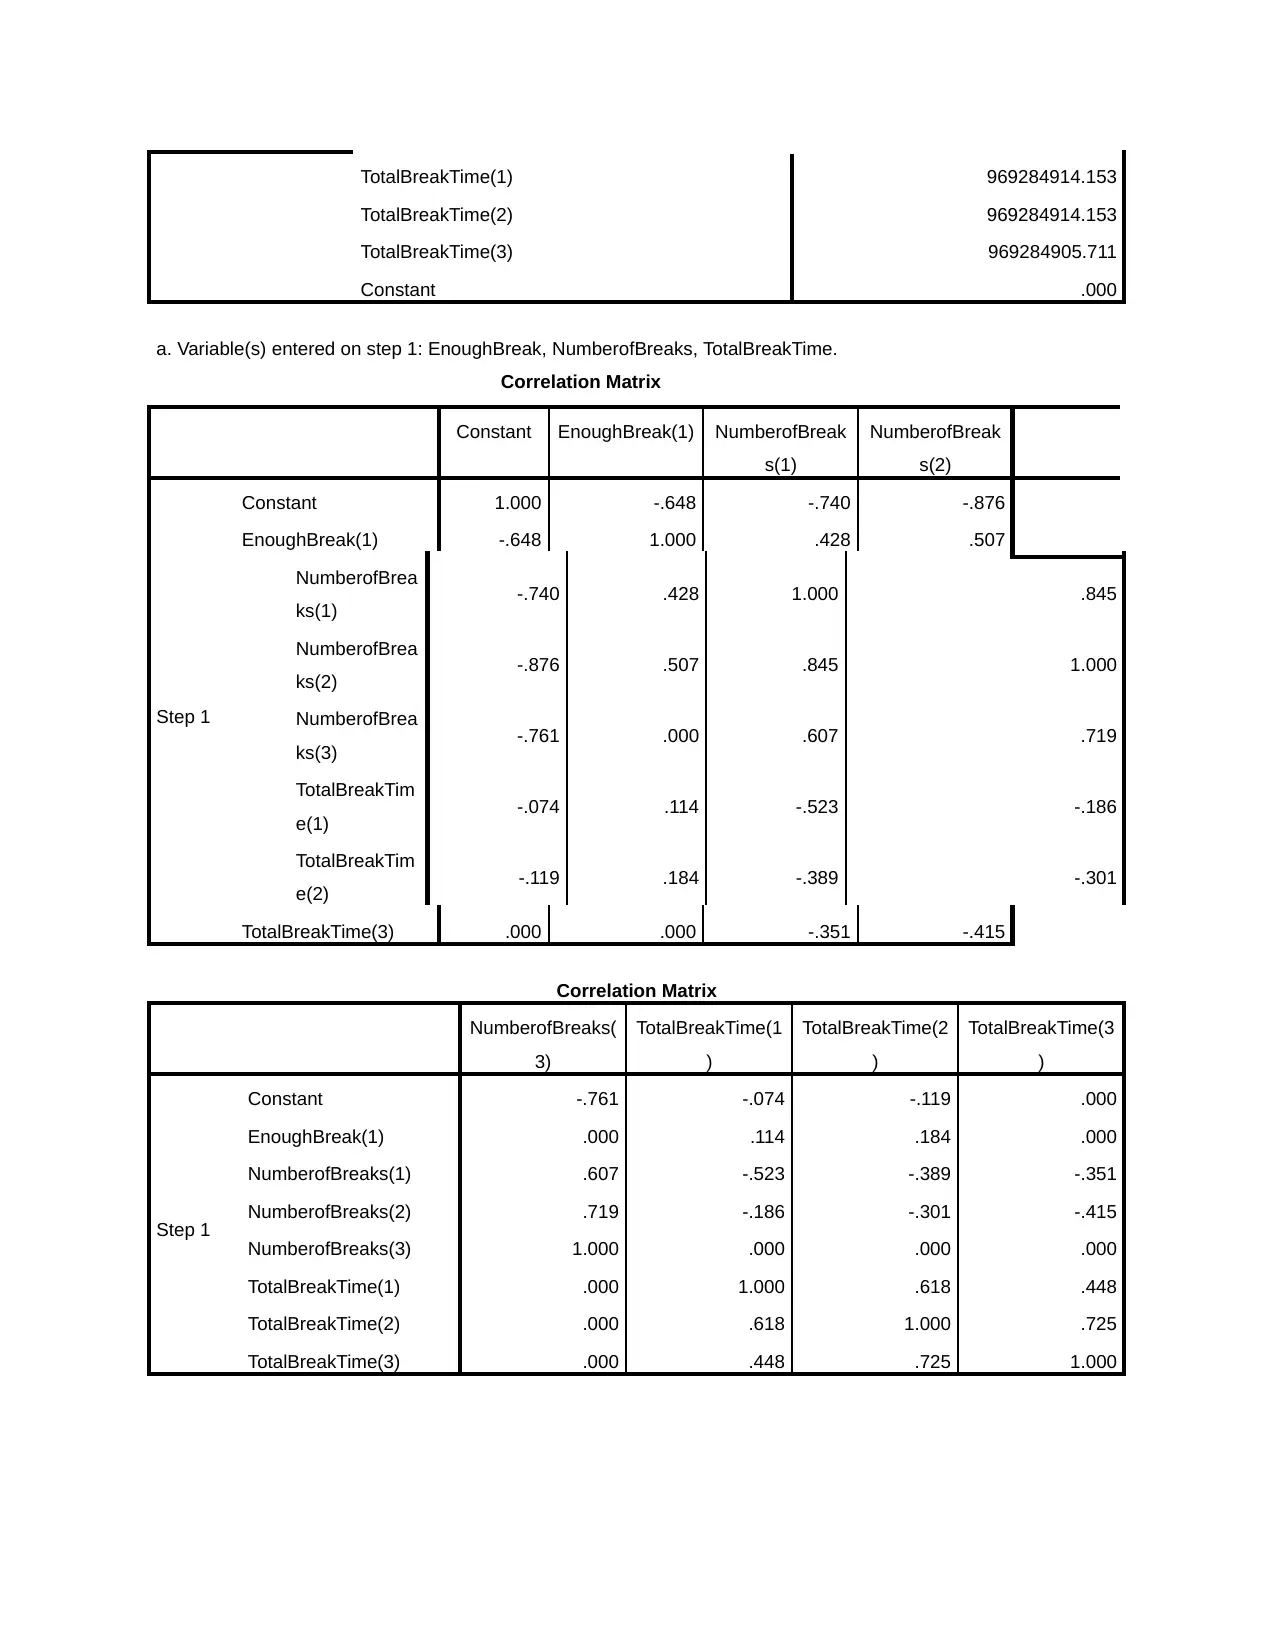
TotalBreakTime(1) 969284914.153
TotalBreakTime(2) 969284914.153
TotalBreakTime(3) 969284905.711
Constant .000
a. Variable(s) entered on step 1: EnoughBreak, NumberofBreaks, TotalBreakTime.
Correlation Matrix
Constant EnoughBreak(1) NumberofBreak
s(1)
NumberofBreak
s(2)
Step 1
Constant 1.000 -.648 -.740 -.876
EnoughBreak(1) -.648 1.000 .428 .507
NumberofBrea
ks(1) -.740 .428 1.000 .845
NumberofBrea
ks(2) -.876 .507 .845 1.000
NumberofBrea
ks(3) -.761 .000 .607 .719
TotalBreakTim
e(1) -.074 .114 -.523 -.186
TotalBreakTim
e(2) -.119 .184 -.389 -.301
TotalBreakTime(3) .000 .000 -.351 -.415
Correlation Matrix
NumberofBreaks(
3)
TotalBreakTime(1
)
TotalBreakTime(2
)
TotalBreakTime(3
)
Step 1
Constant -.761 -.074 -.119 .000
EnoughBreak(1) .000 .114 .184 .000
NumberofBreaks(1) .607 -.523 -.389 -.351
NumberofBreaks(2) .719 -.186 -.301 -.415
NumberofBreaks(3) 1.000 .000 .000 .000
TotalBreakTime(1) .000 1.000 .618 .448
TotalBreakTime(2) .000 .618 1.000 .725
TotalBreakTime(3) .000 .448 .725 1.000
1 out of 14
Related Documents


Your All-in-One AI-Powered Toolkit for Academic Success.
+13062052269
info@desklib.com
Available 24*7 on WhatsApp / Email
![[object Object]](/_next/static/media/star-bottom.7253800d.svg)
Unlock your academic potential
© 2024 | Zucol Services PVT LTD | All rights reserved.