Exploring Break Time and its Effects on Productivity Statistically
VerifiedAdded on 2023/05/29
|14
|2360
|437
Homework Assignment
AI Summary
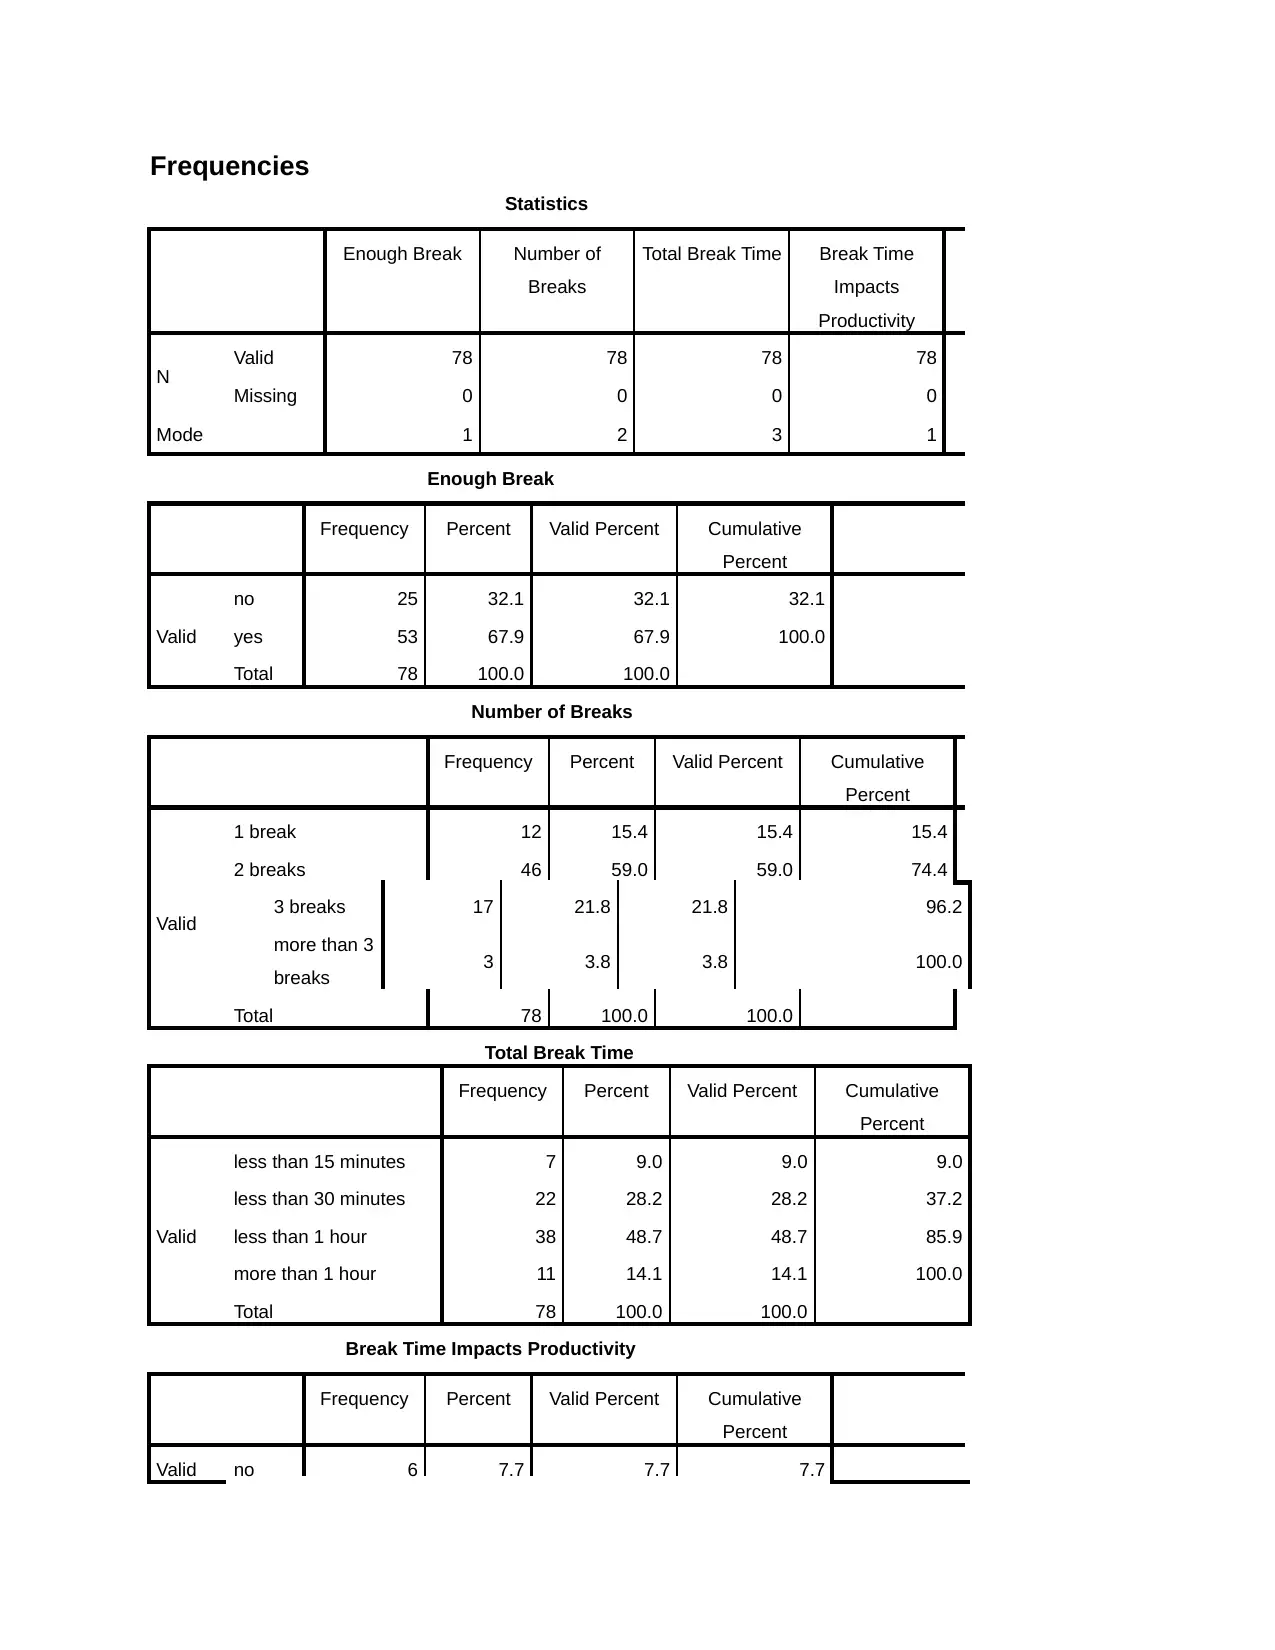
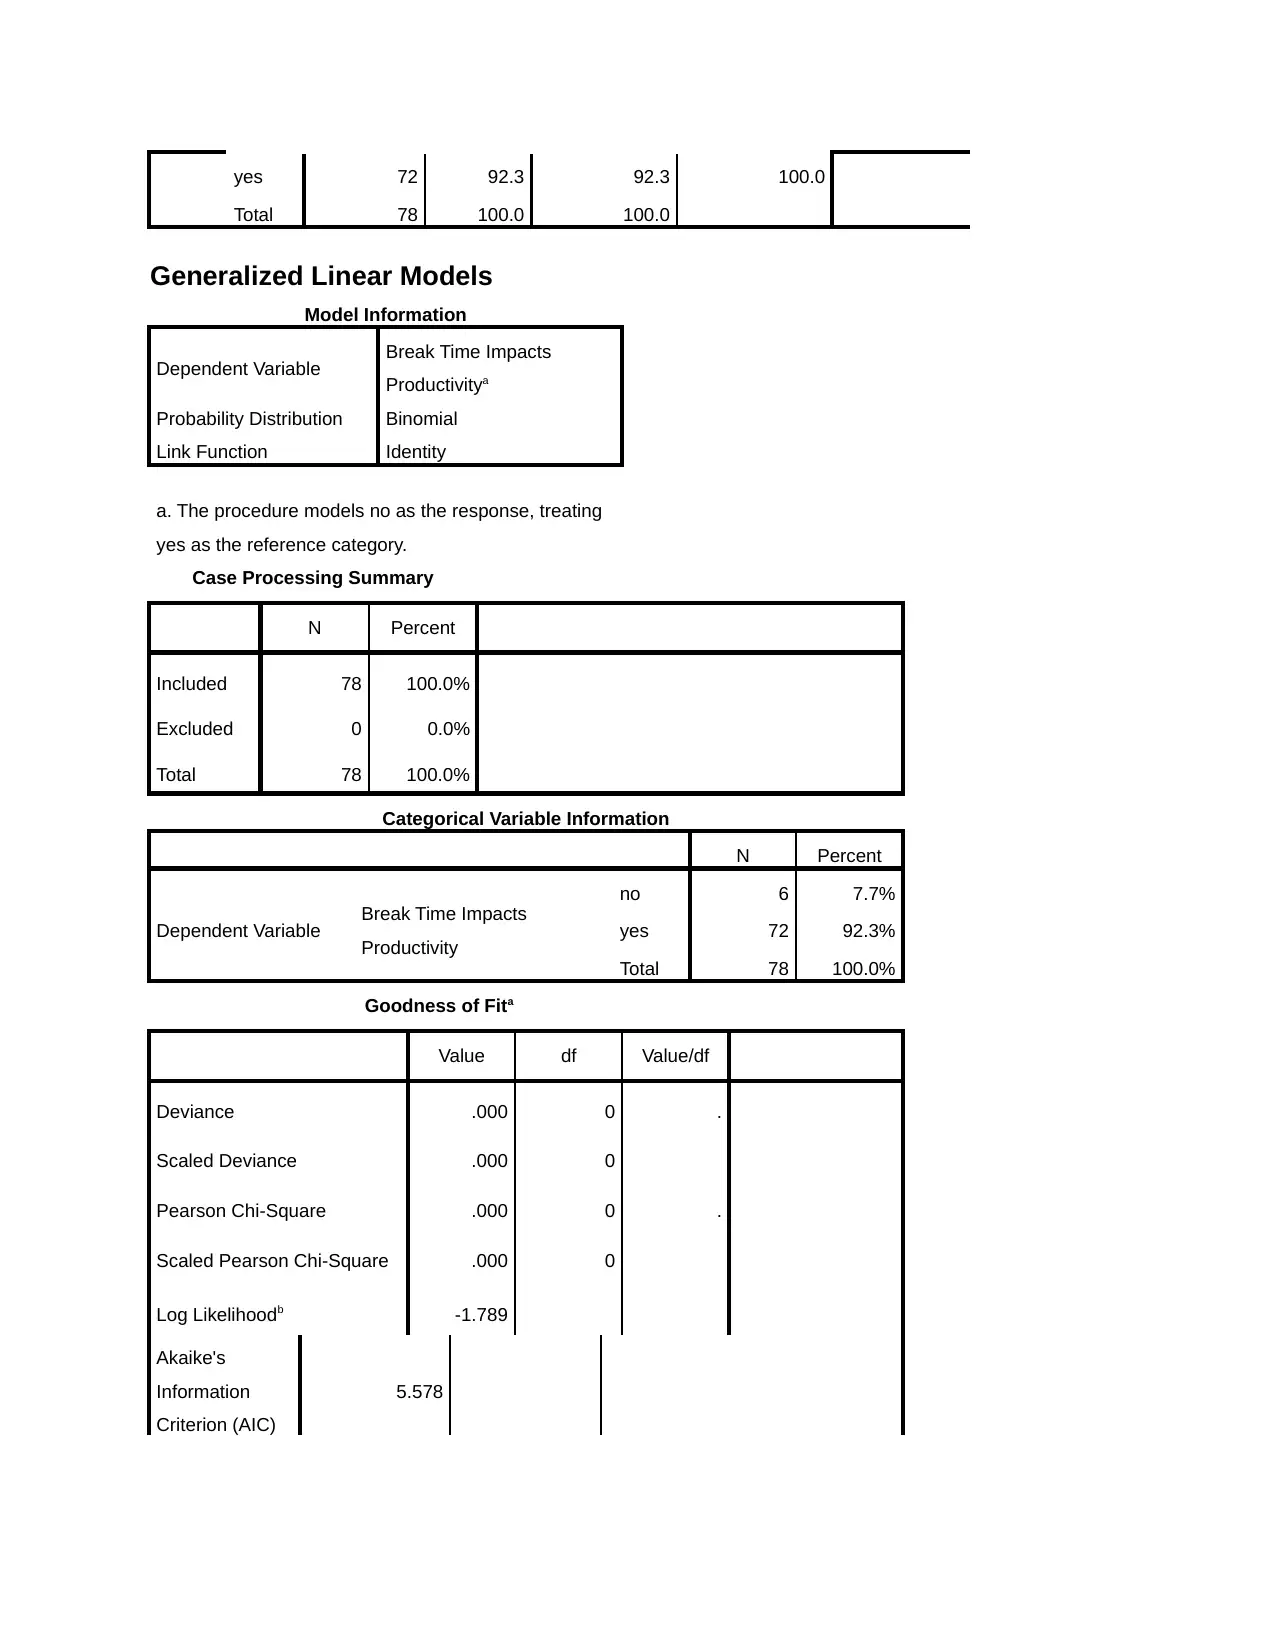
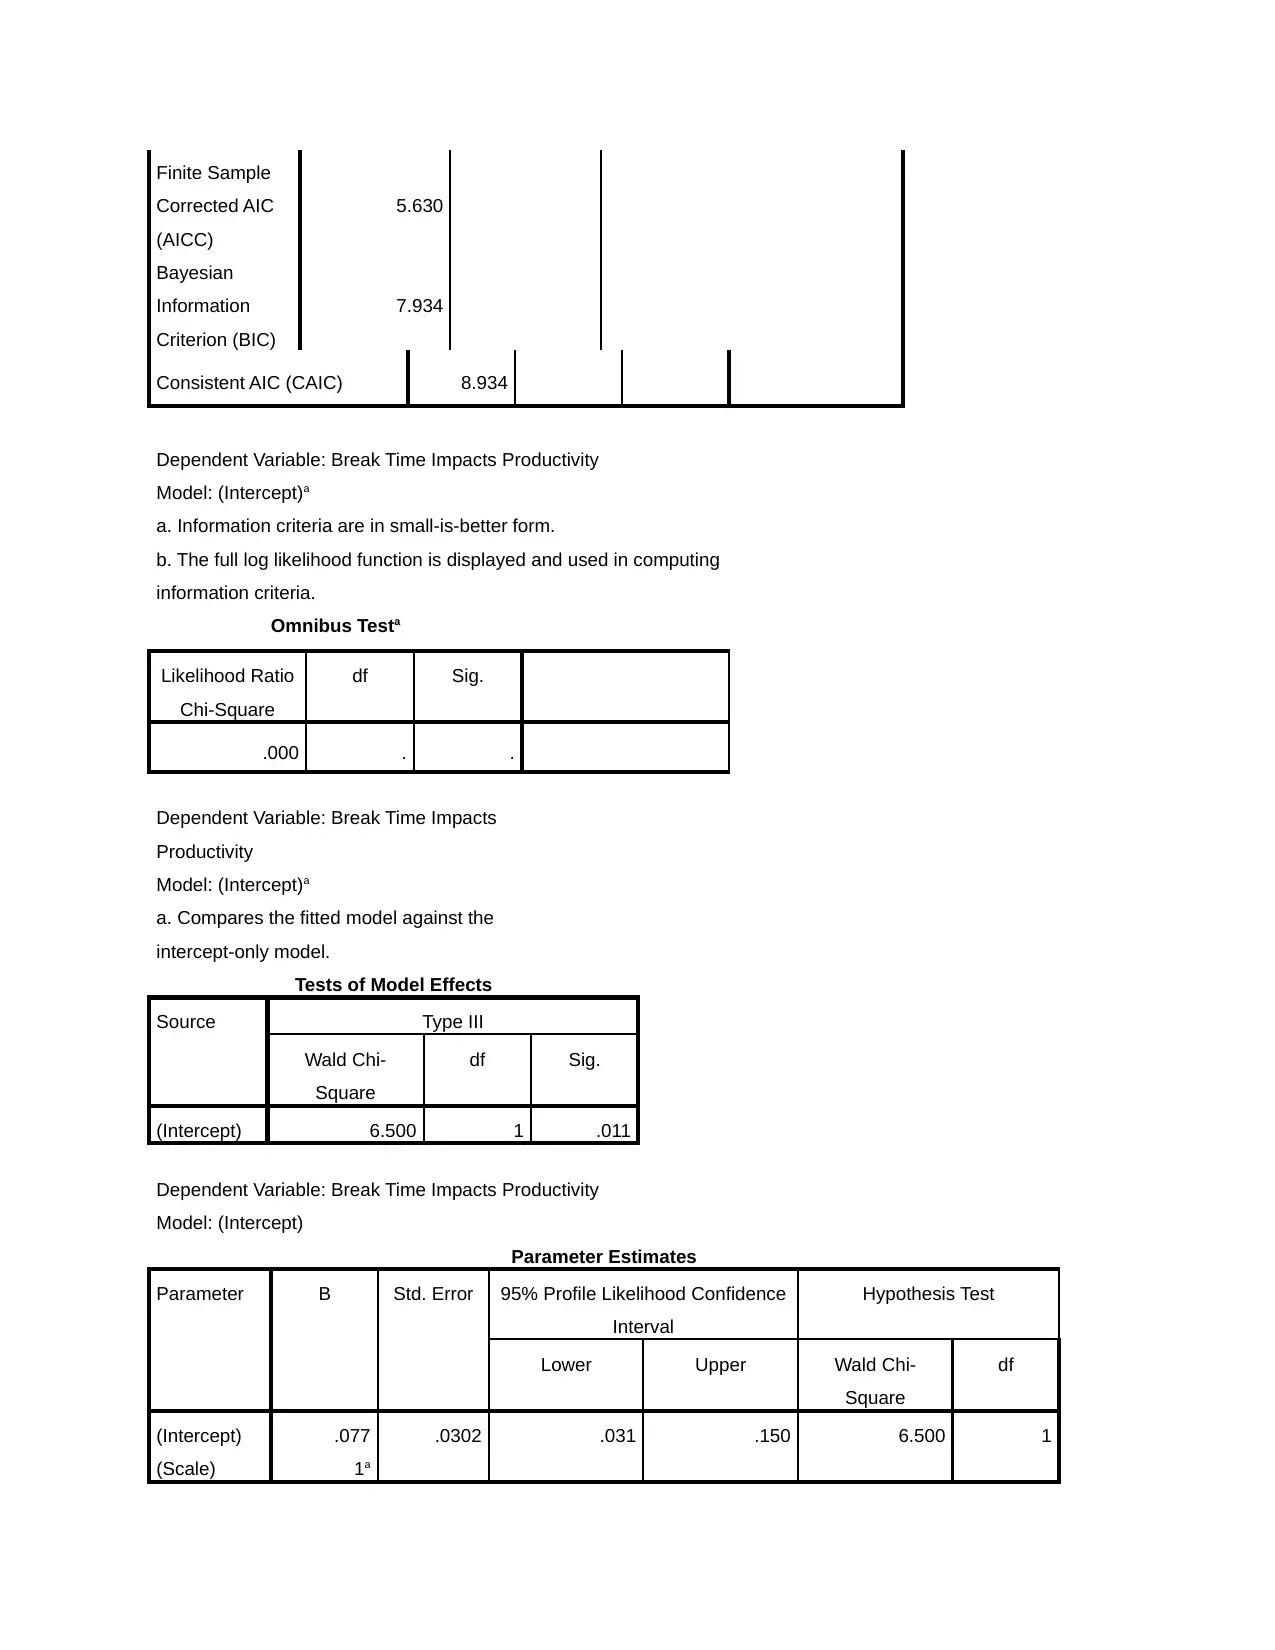
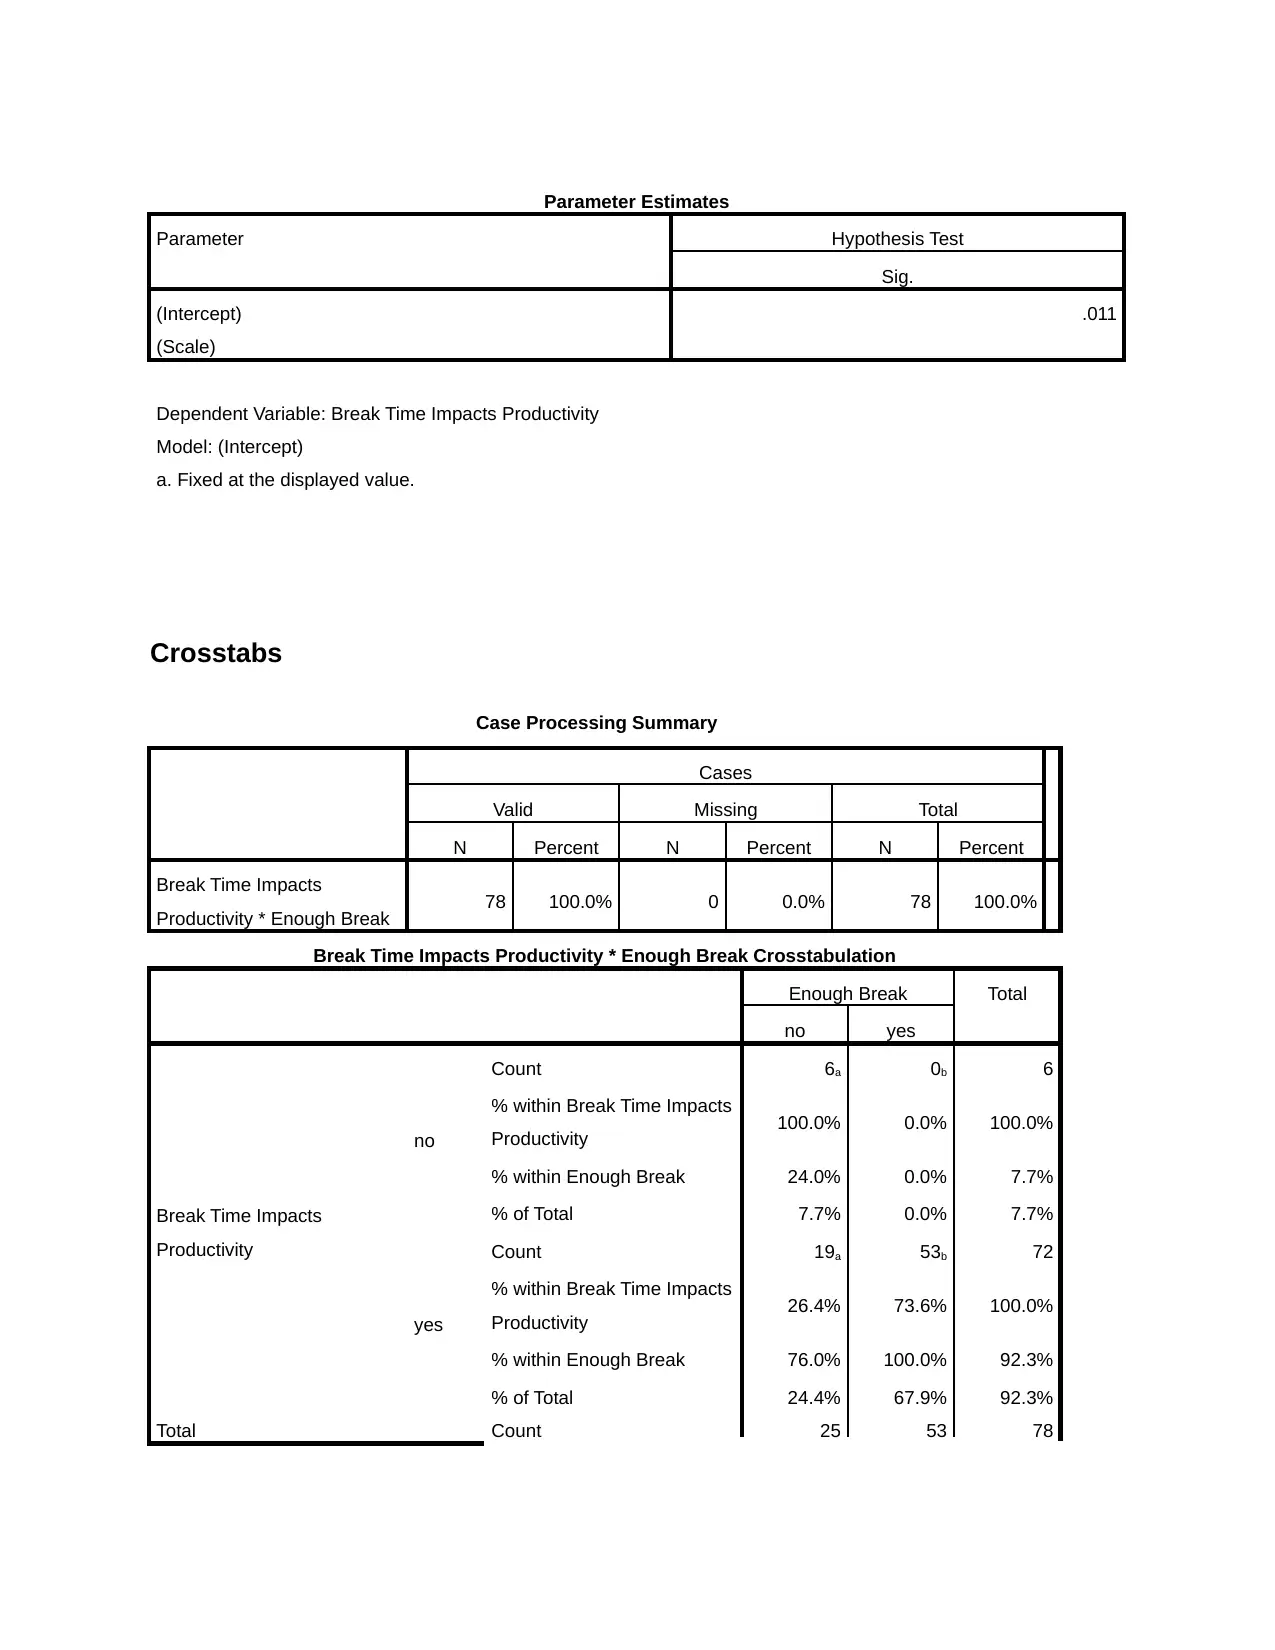
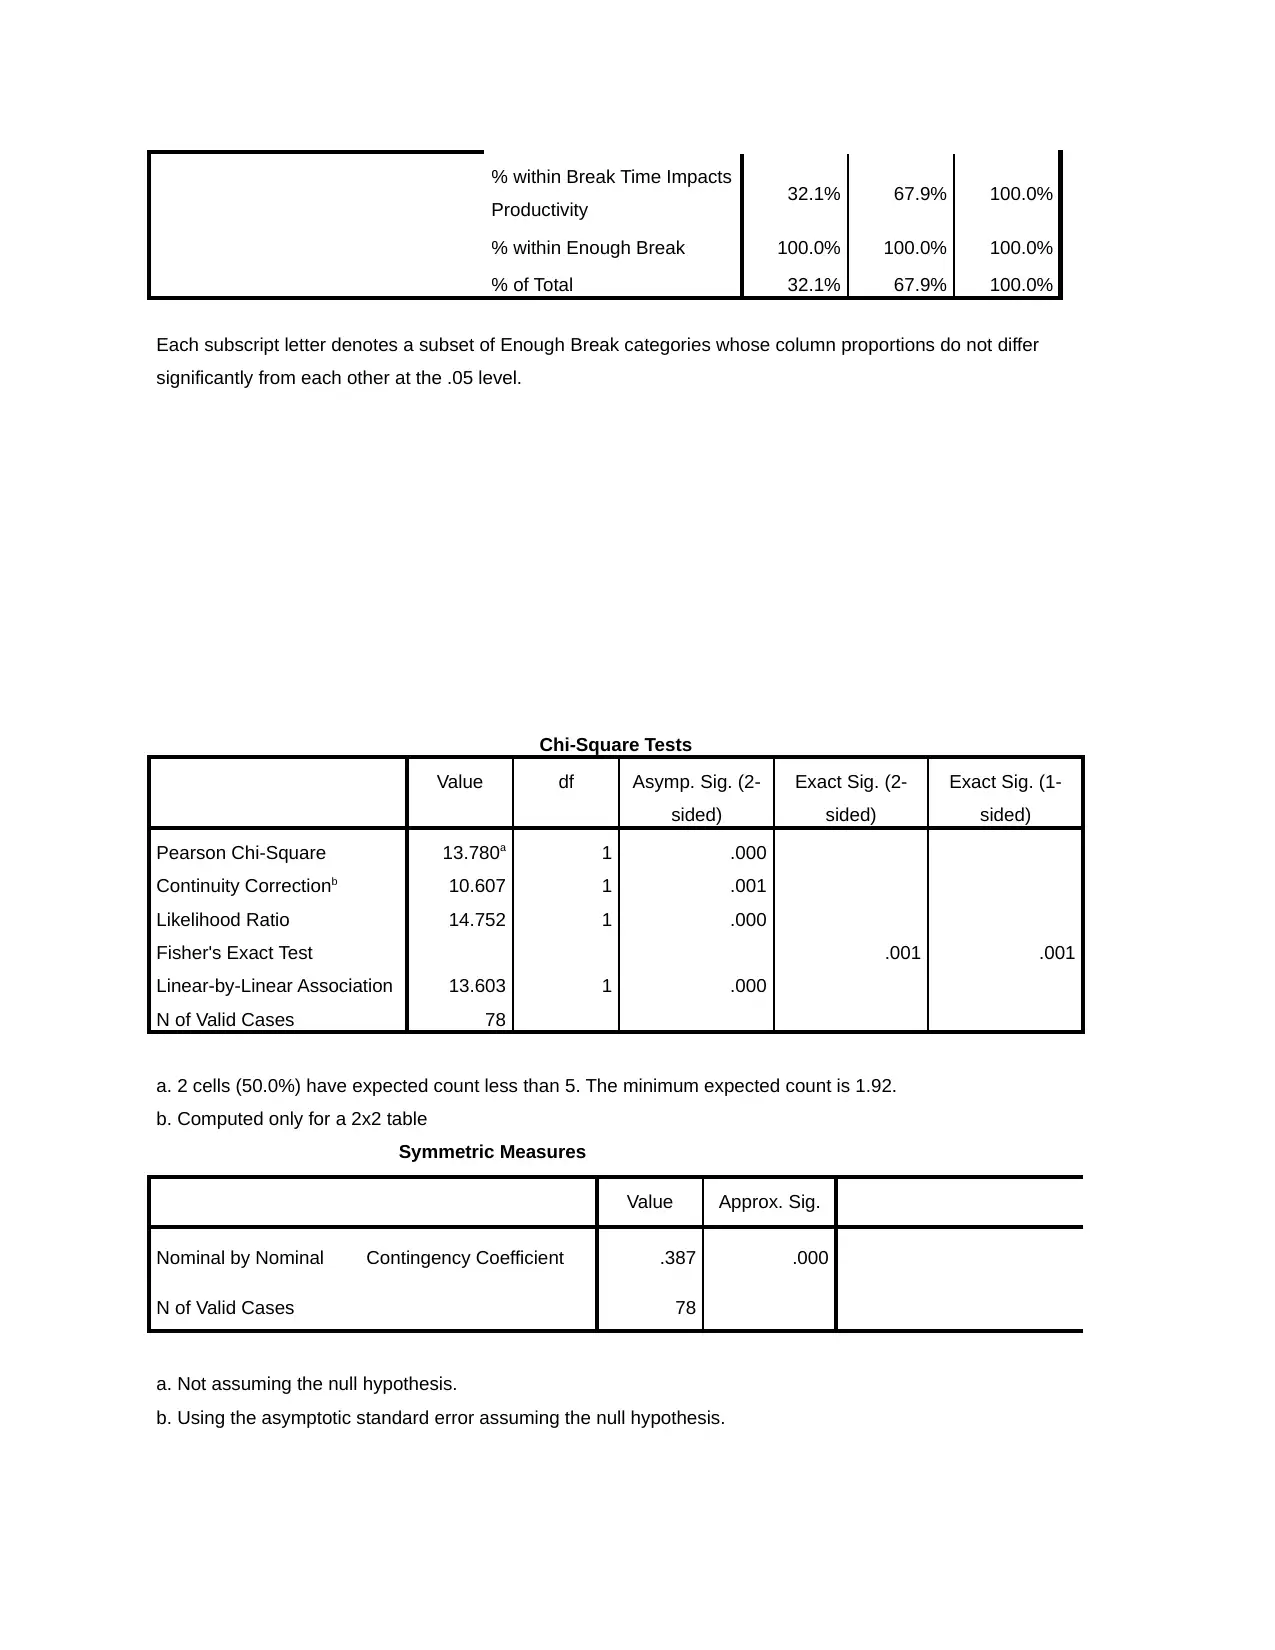
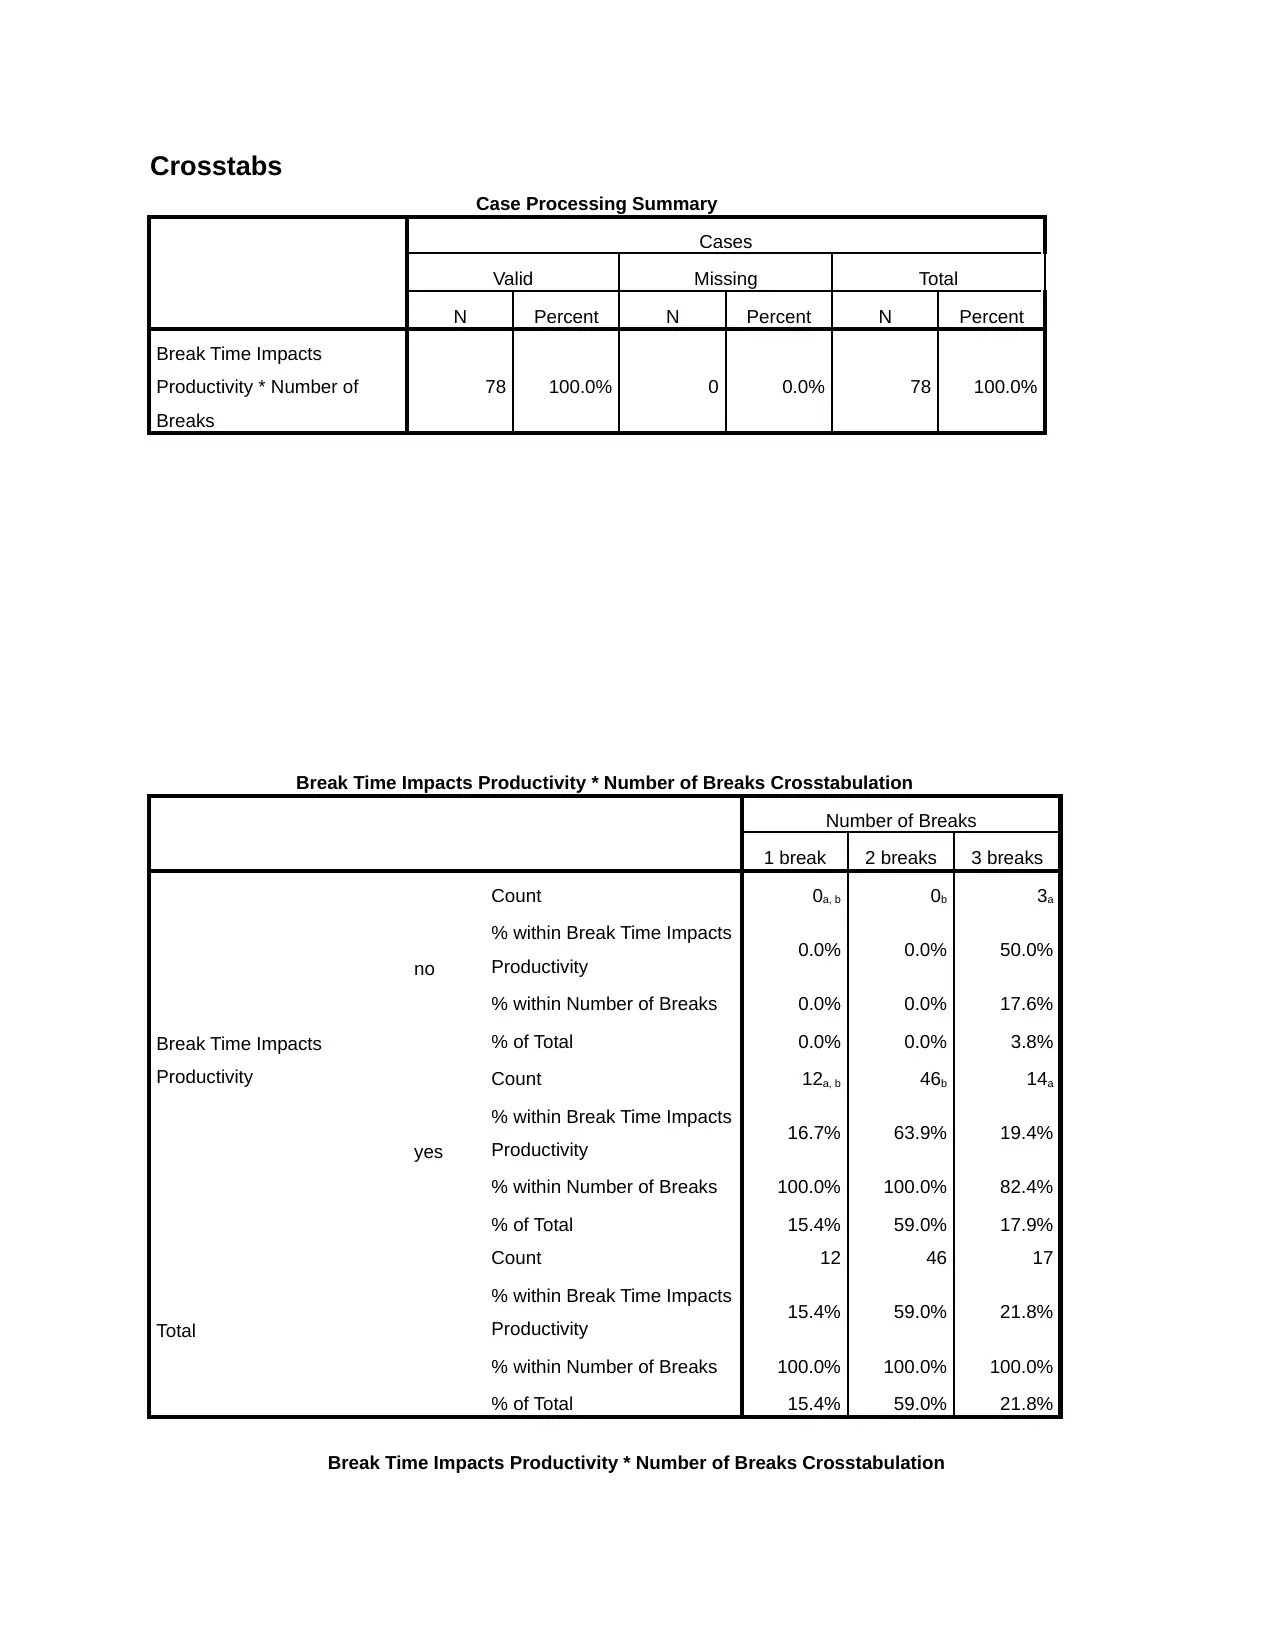
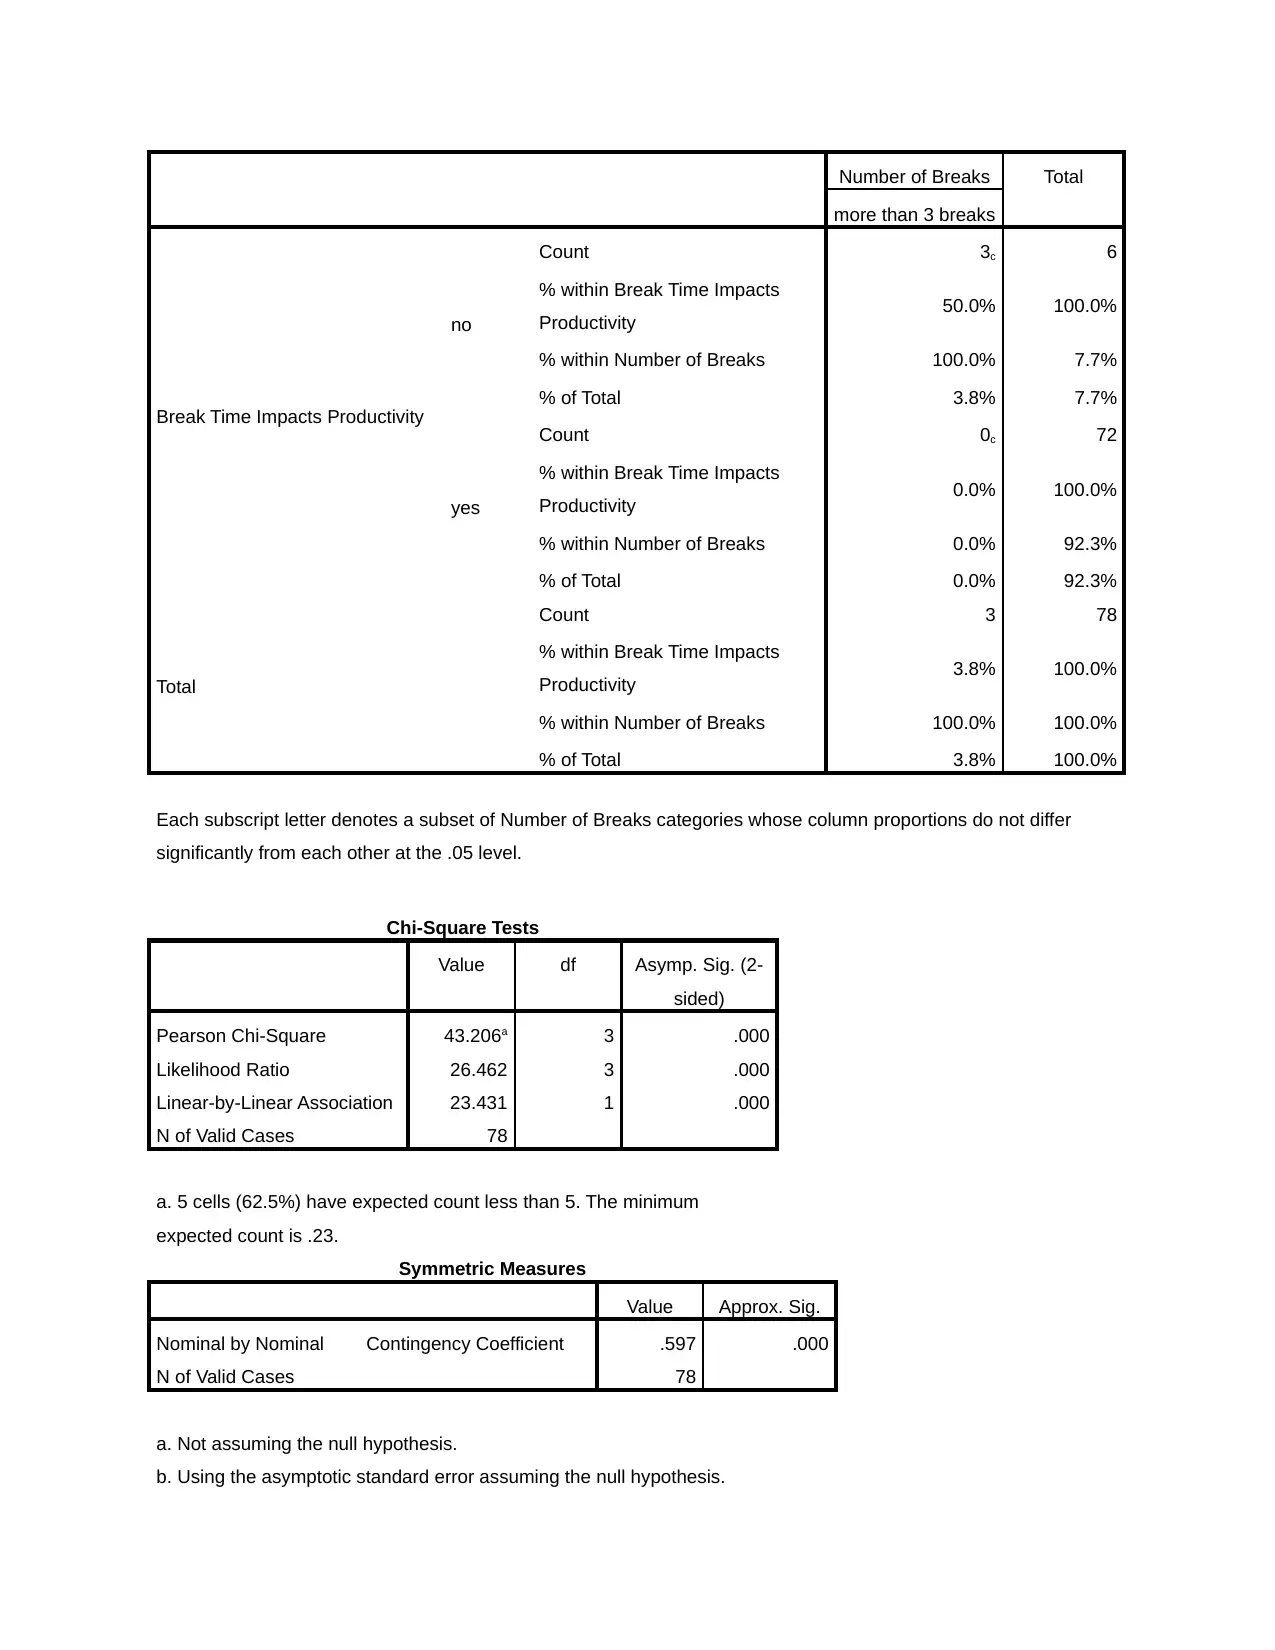
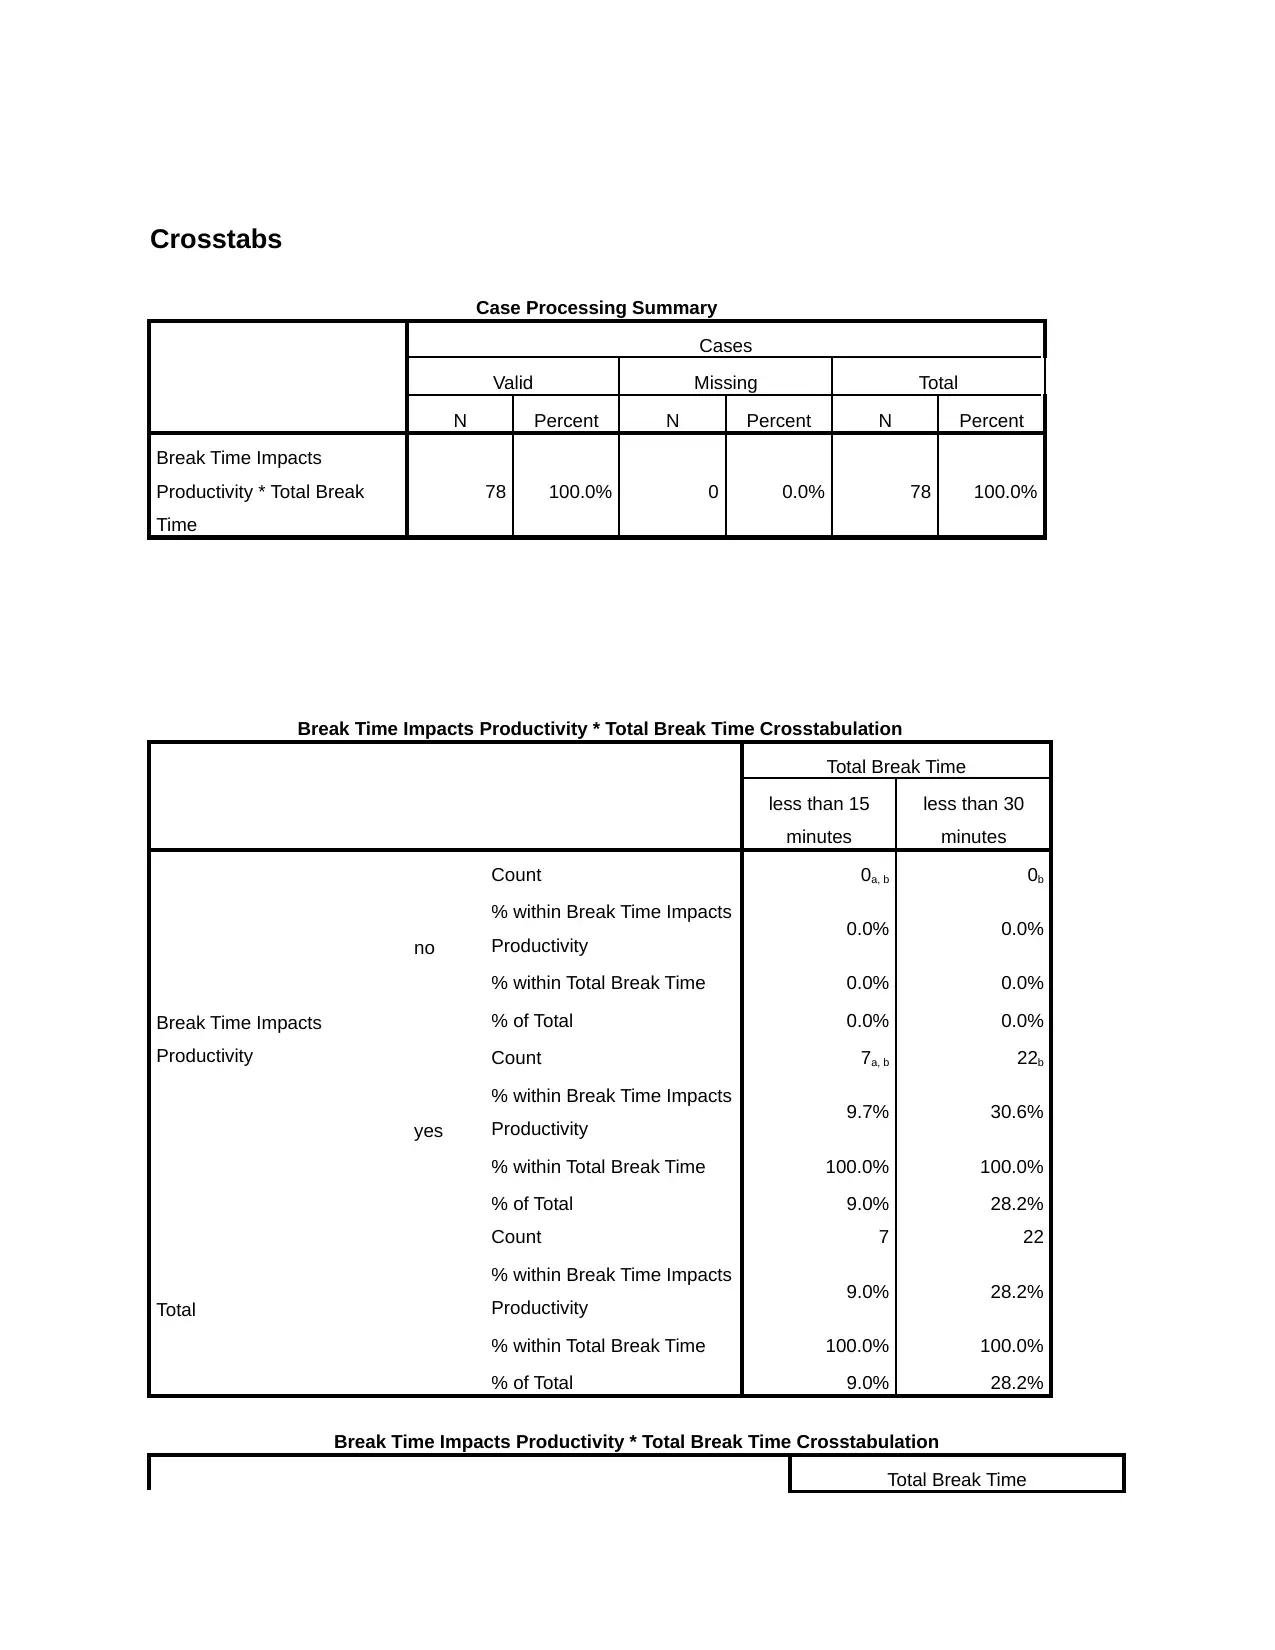
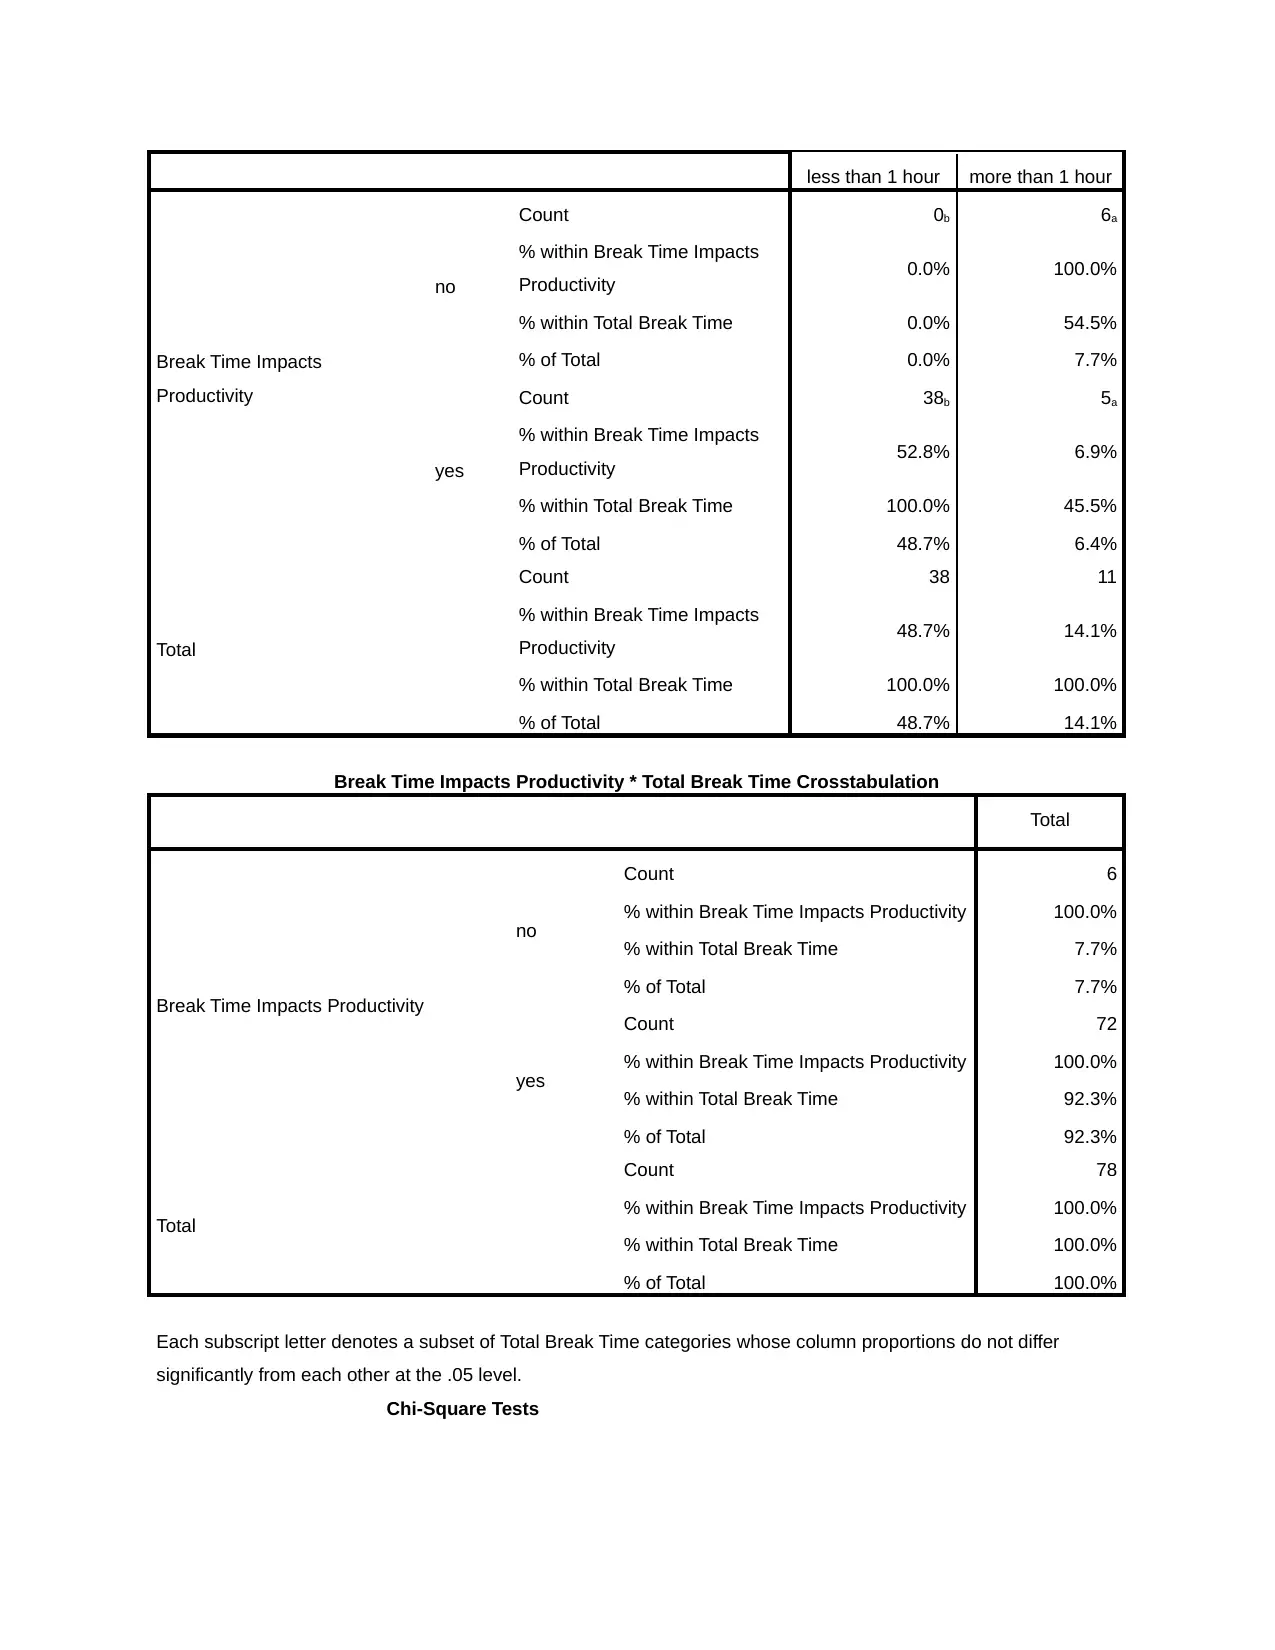
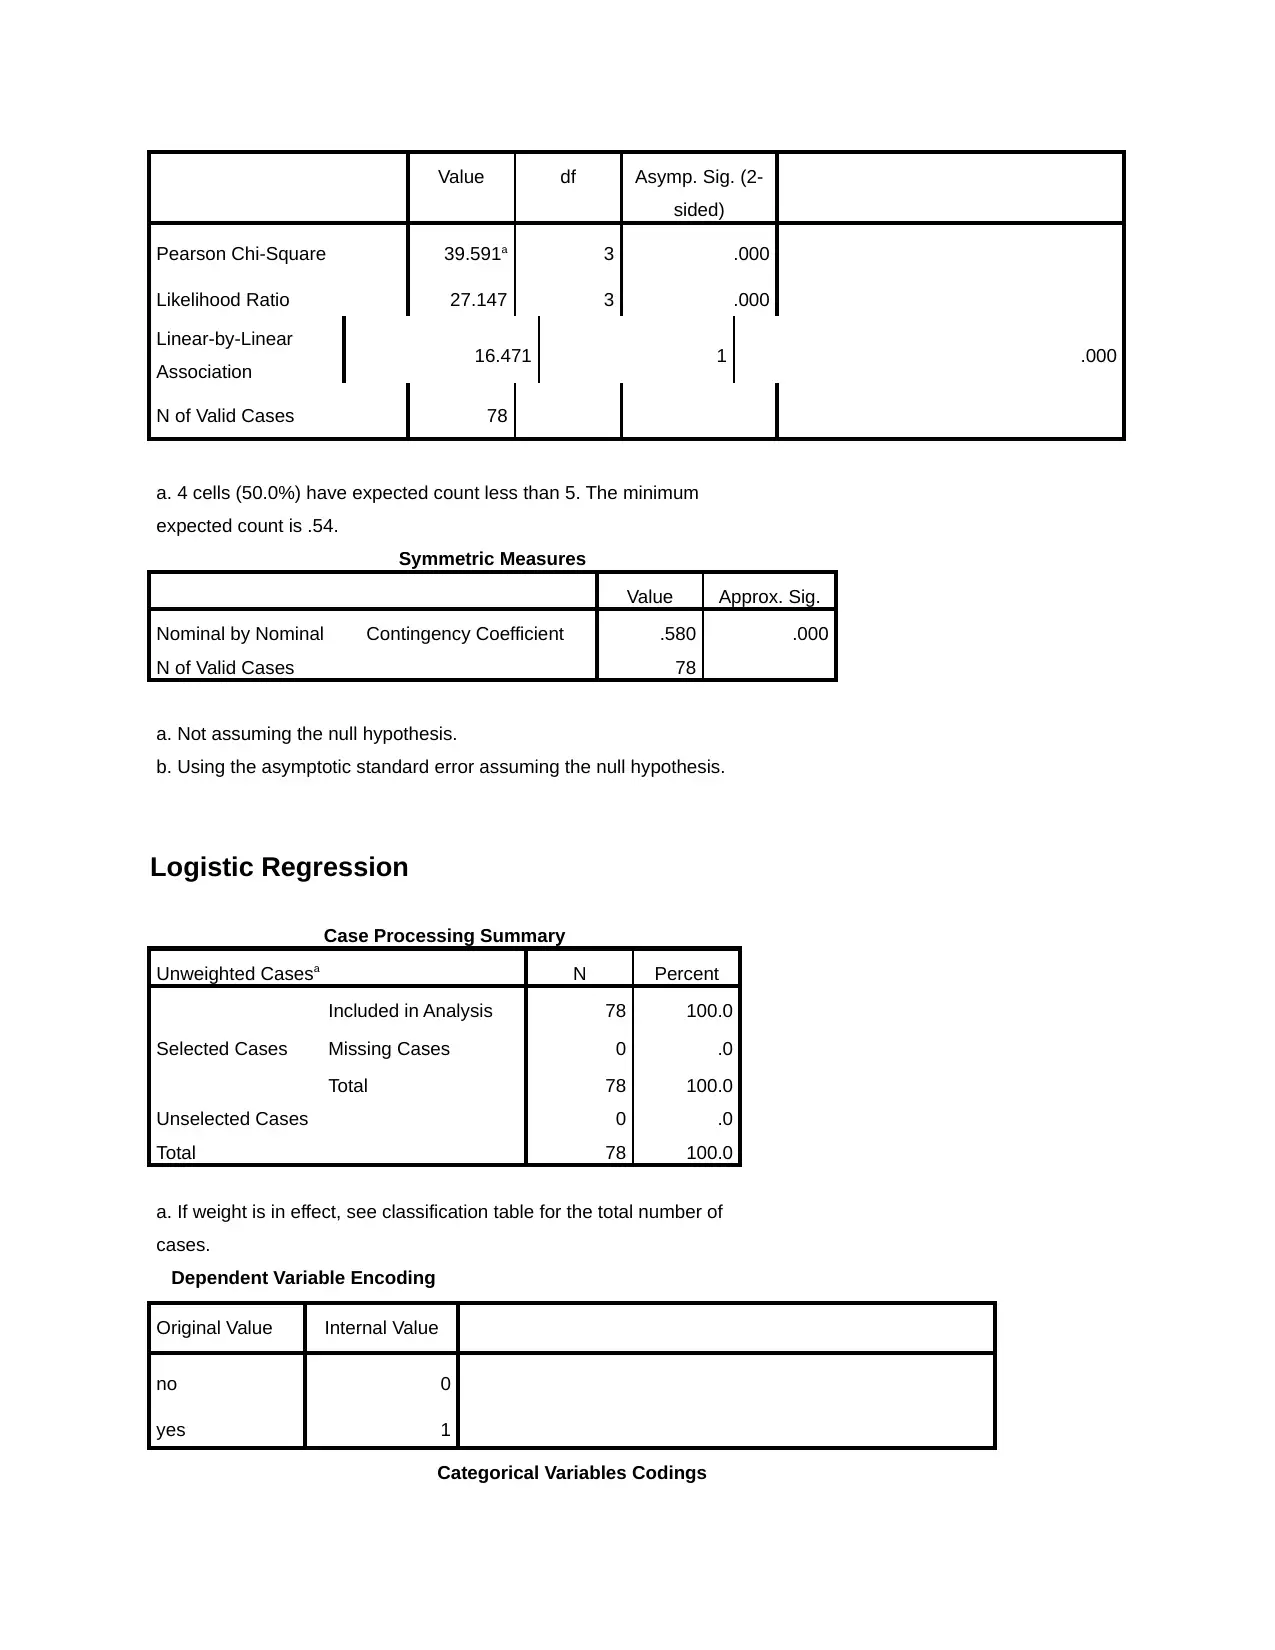
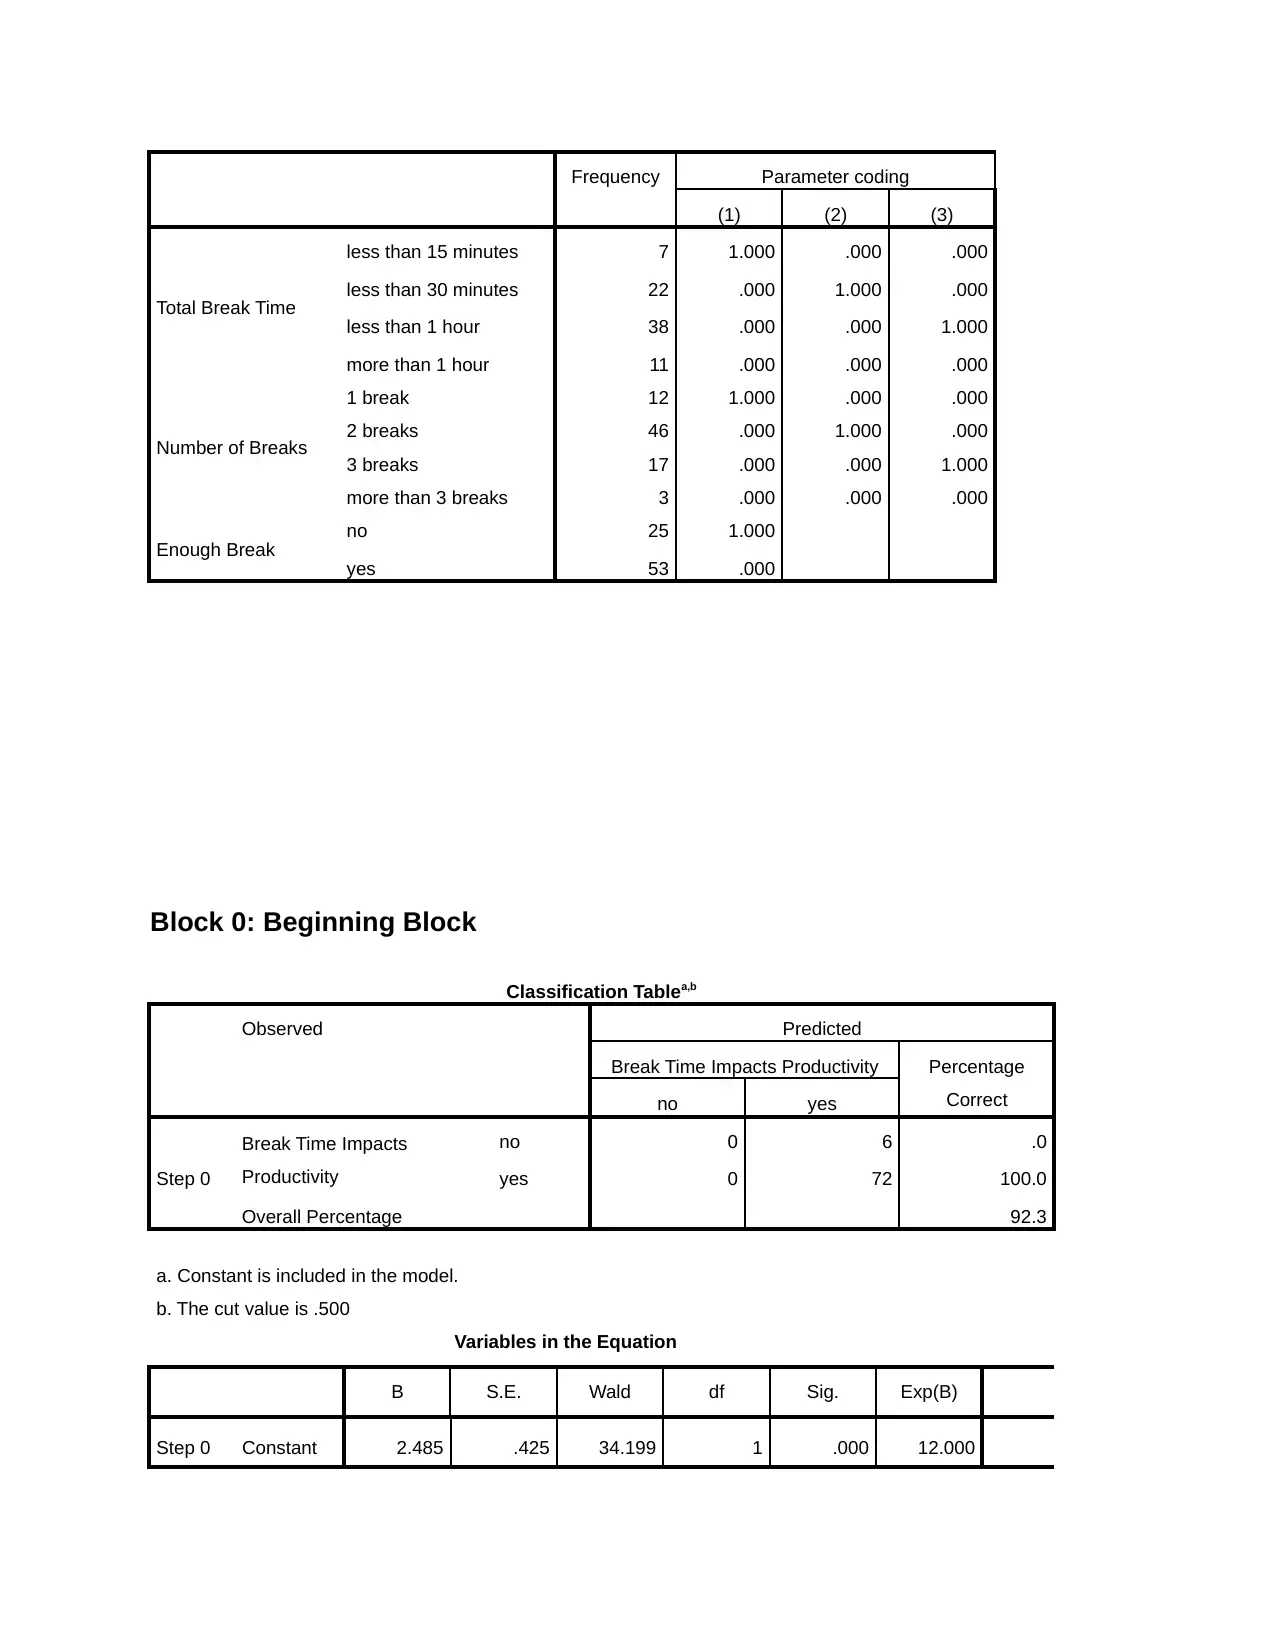
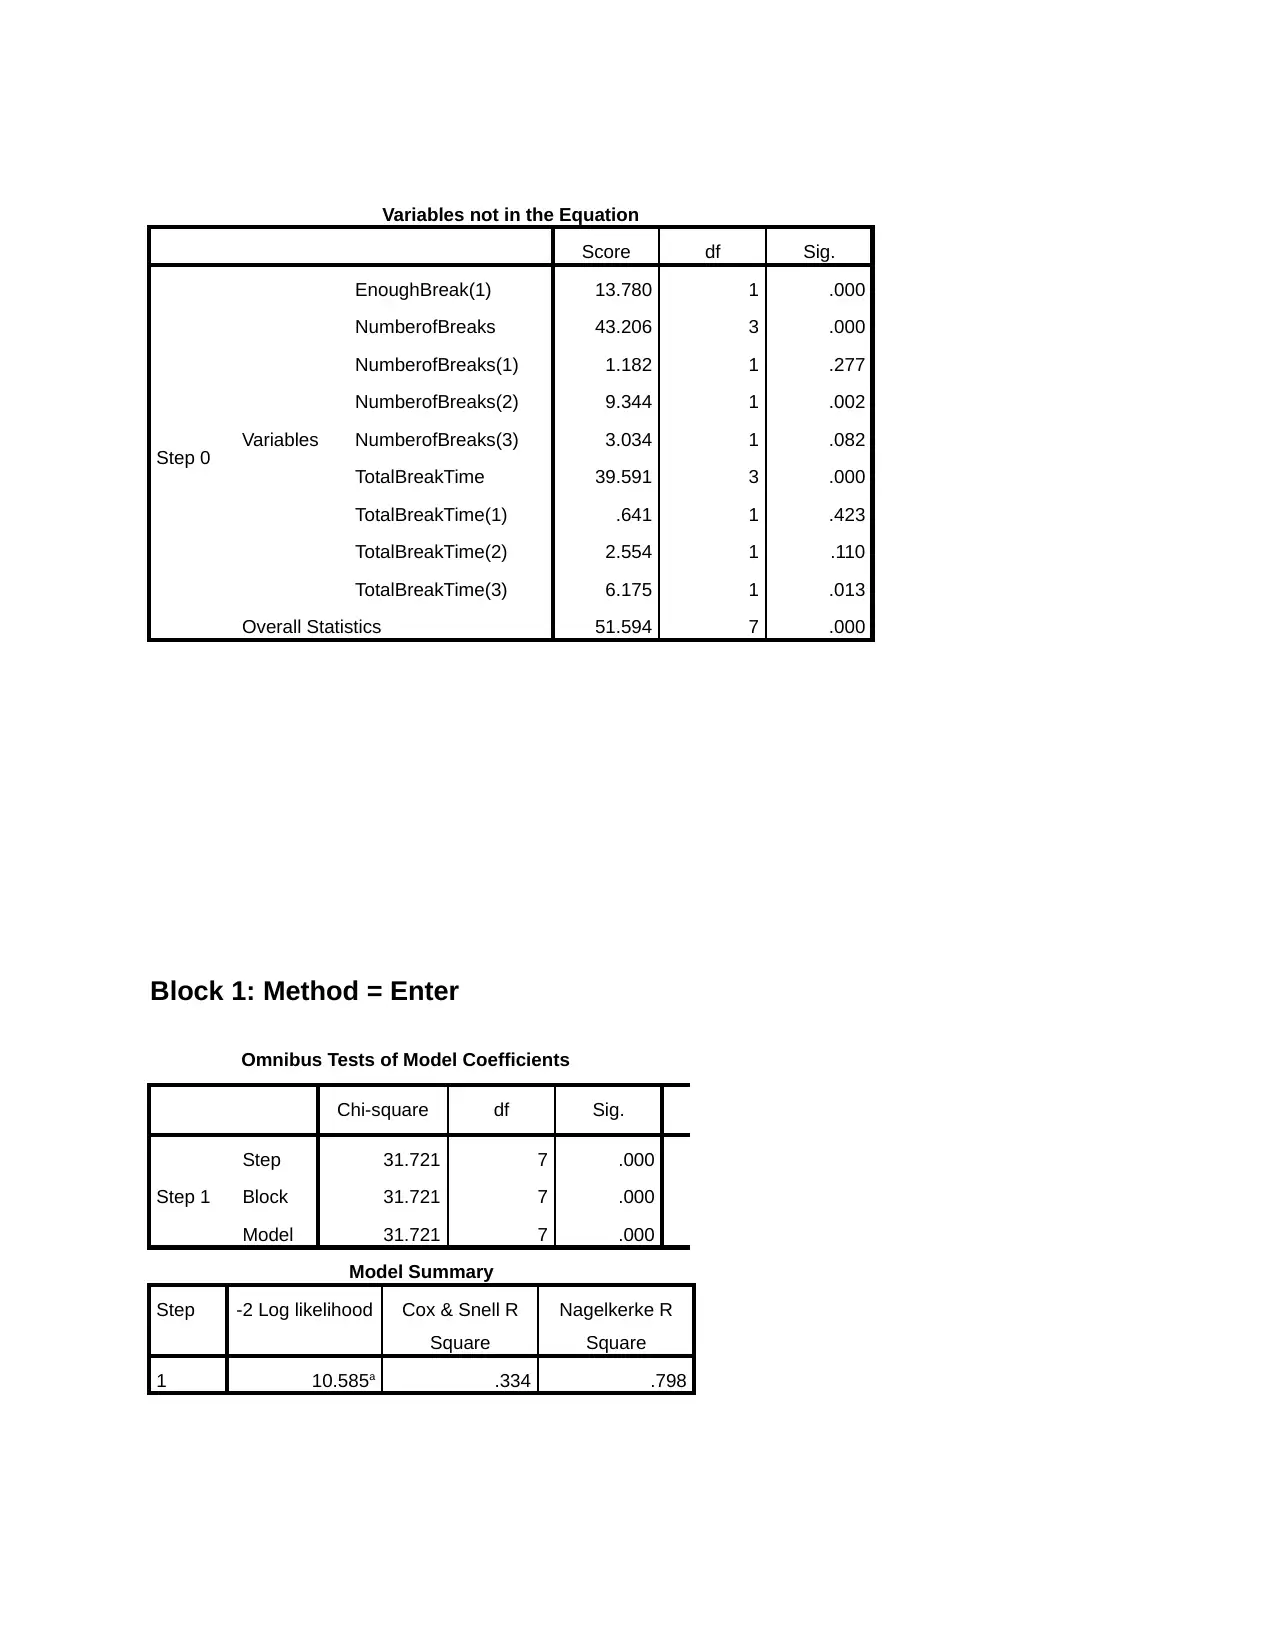
This assignment presents a statistical analysis of the relationship between break time and productivity, utilizing frequency statistics, generalized linear models, and cross-tabulations to explore the impact of break frequency and duration on perceived productivity. The analysis includes data on whether employees feel they have enough breaks, the number of breaks they take, the total break time, and whether they believe break time impacts their productivity. The results from Chi-Square tests and logistic regression models are used to determine the significance of these factors, revealing insights into how different break patterns correlate with productivity perceptions. The assignment concludes with a correlation matrix, further examining the relationships between the variables. Desklib offers a wealth of similar solved assignments and past papers to aid students in their studies.
1 out of 14
Related Documents


Your All-in-One AI-Powered Toolkit for Academic Success.
+13062052269
info@desklib.com
Available 24*7 on WhatsApp / Email
![[object Object]](/_next/static/media/star-bottom.7253800d.svg)
Copyright © 2020–2026 A2Z Services. All Rights Reserved. Developed and managed by ZUCOL.