Operational and Financial Analysis of BT Group and Vodafone in the Telecommunication Industry in Australia
Added on 2023-06-13
33 Pages3977 Words460 Views
Managing operations and finance
1
1
Chapter 1 – Operational Analysis
1.1 Introduction
This report will look at the performance of BT Group in recent years and the comparison of
company’s performance with the others. The financial performance of the company is shown
in the report by using the financial metrics and graphs. The operational analysis of the
company’s performance is described by comparing it with competitors.
1.2 Industry Analysis
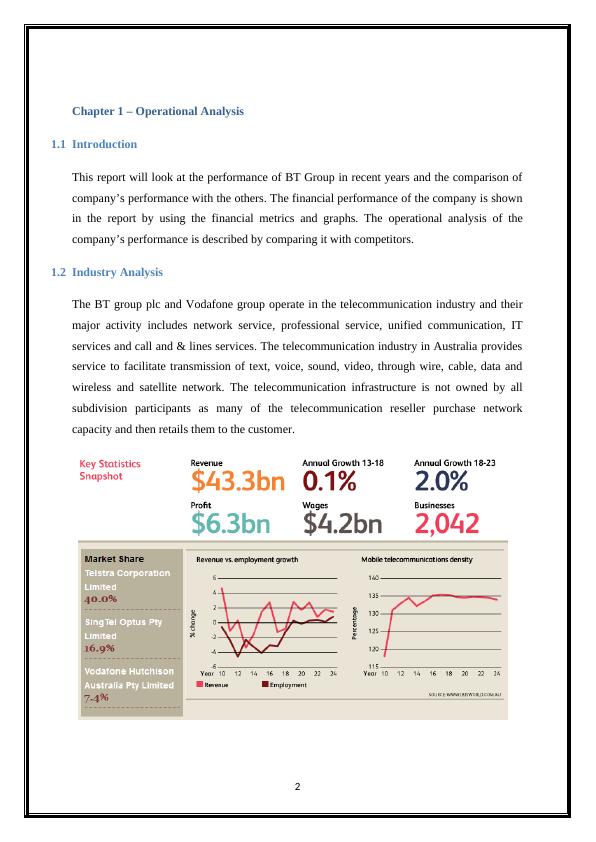
The BT group plc and Vodafone group operate in the telecommunication industry and their
major activity includes network service, professional service, unified communication, IT
services and call and & lines services. The telecommunication industry in Australia provides
service to facilitate transmission of text, voice, sound, video, through wire, cable, data and
wireless and satellite network. The telecommunication infrastructure is not owned by all
subdivision participants as many of the telecommunication reseller purchase network
capacity and then retails them to the customer.
2
1.1 Introduction
This report will look at the performance of BT Group in recent years and the comparison of
company’s performance with the others. The financial performance of the company is shown
in the report by using the financial metrics and graphs. The operational analysis of the
company’s performance is described by comparing it with competitors.
1.2 Industry Analysis
The BT group plc and Vodafone group operate in the telecommunication industry and their
major activity includes network service, professional service, unified communication, IT
services and call and & lines services. The telecommunication industry in Australia provides
service to facilitate transmission of text, voice, sound, video, through wire, cable, data and
wireless and satellite network. The telecommunication infrastructure is not owned by all
subdivision participants as many of the telecommunication reseller purchase network
capacity and then retails them to the customer.
2
The telecommunication sector in Australia has changed by providing increased connectivity
and telecommunication service usage has increased over the past 5 years which created
intense intra-subdivision and intra-industry that lead to the difficult trading environment for
many of the firms. As a result of fixed-to-mobile shift, there is expectation of rise in revenue
at an annual rate of 0.1% over the next 5 years from 2017-18 to reach $43.3 billion. The
profit of the subdivision has a possibility to decrease over the five year through 2017-18 due
to current price competition and accumulation of substantial losses from the development of
NBN.
Major companies
3
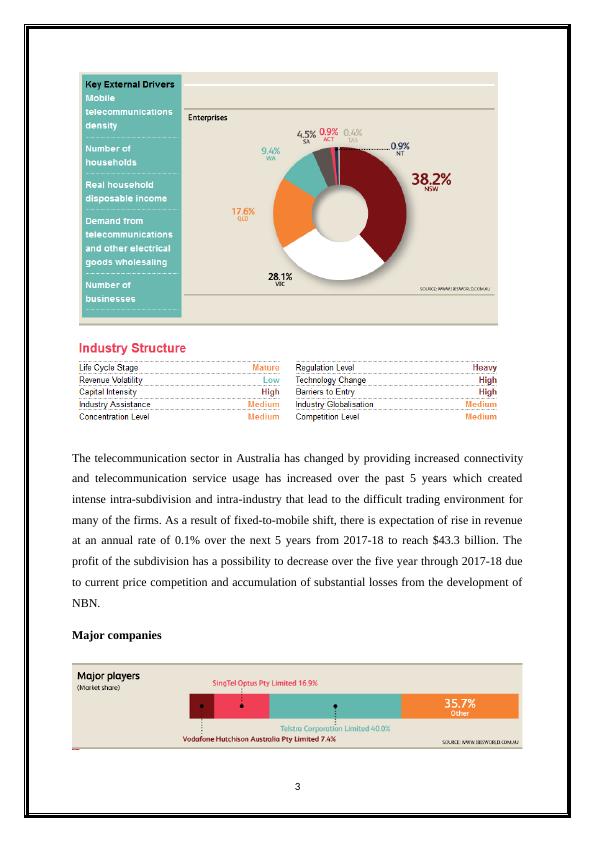
The major companies in the telecommunication industry in Australia are Telstra Corporation
Limited, Vodafone Hutchison Australia and SingTel Optus Pty Limited with the marketing
holding of 40%, 7.4% and 16.9% respectively. Rest of the 35.7% of the market share is held
by other companies which are TPG Telecom Limited, Vocus Communication limited and
NBN Co limited.
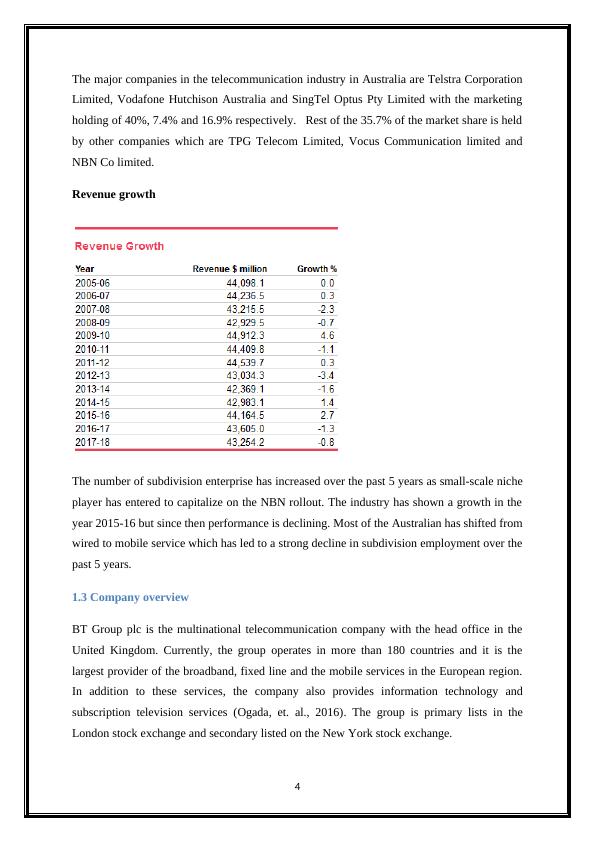
Revenue growth
The number of subdivision enterprise has increased over the past 5 years as small-scale niche
player has entered to capitalize on the NBN rollout. The industry has shown a growth in the
year 2015-16 but since then performance is declining. Most of the Australian has shifted from
wired to mobile service which has led to a strong decline in subdivision employment over the
past 5 years.
1.3 Company overview
BT Group plc is the multinational telecommunication company with the head office in the
United Kingdom. Currently, the group operates in more than 180 countries and it is the
largest provider of the broadband, fixed line and the mobile services in the European region.
In addition to these services, the company also provides information technology and
subscription television services (Ogada, et. al., 2016). The group is primary lists in the
London stock exchange and secondary listed on the New York stock exchange.
4
Limited, Vodafone Hutchison Australia and SingTel Optus Pty Limited with the marketing
holding of 40%, 7.4% and 16.9% respectively. Rest of the 35.7% of the market share is held
by other companies which are TPG Telecom Limited, Vocus Communication limited and
NBN Co limited.
Revenue growth
The number of subdivision enterprise has increased over the past 5 years as small-scale niche
player has entered to capitalize on the NBN rollout. The industry has shown a growth in the
year 2015-16 but since then performance is declining. Most of the Australian has shifted from
wired to mobile service which has led to a strong decline in subdivision employment over the
past 5 years.
1.3 Company overview
BT Group plc is the multinational telecommunication company with the head office in the
United Kingdom. Currently, the group operates in more than 180 countries and it is the
largest provider of the broadband, fixed line and the mobile services in the European region.
In addition to these services, the company also provides information technology and
subscription television services (Ogada, et. al., 2016). The group is primary lists in the
London stock exchange and secondary listed on the New York stock exchange.
4
Vodafone group is established in the year 1991 in London, England. The company is a
multinational telecommunication company which operates in the region of Europe, Asia,
Africa and Oceania (Marino, 2017). In the terms of revenue, the company ranked fifth in the
telecommunication industry in the world and ranked second in Asia. The company operated
the network in more than twenty-six different countries and they have partners in more than
fifty other countries. The company has more than 100,000 employees worldwide and it is the
eight largest companies listed on the stock exchange of England and it is secondary listed in
the NASDAQ. The name Vodafone came from the “voice data phone” which is selected by
the company in order to "reflect the provision of voice and data services over mobile
phones".
1.4 business strategy
The group has more than 18 billion customers in Great Britain and it operates a high number
of subsidiaries. The major subsidiaries of the company are plus net, EE limited BT global
services and open reach. The group acquired EE limited in the year 2015 for £12.5 billion.
This was the company acquired by the group in the recent years (Payne and Frow, 2014).
Vodafone invested £19 billion in the spring project in order to achieve the objective of rapid
growth and improving the quality of mobile services. In addition to this, the Vodafone is also
committed towards high standards of corporate governance which are critical for the integrity
of business of the company.
1.5 Operational analysis
The group powers the information technology and communication service of more than nine
lakh companies in Ireland and the United Kingdom. The major businesses of the company are
networking, voice solutions, broadband, and the cloud services. The aim of the BT group is
deepening and broadening the relationship with them as many customers as possible in order
to achieve the ultimate growth goal of the organization.
Vodafone provides a wide range of services including the messaging, voice and fixed
network services (Bany-Ariffin, et. al., 2016). The aim of Vodafone is to differentiate
5
themselves from their competitors in the industry by providing the customers a leading
network and by levering the advantages of the large scale. The company is investing a huge
amount in building high quality of telecommunication networks which can further sustain
high revenue generation and which can reward the stakeholders of Vodafone.
Chapter 2 -Evaluation of performance
2.1 Financial Performance
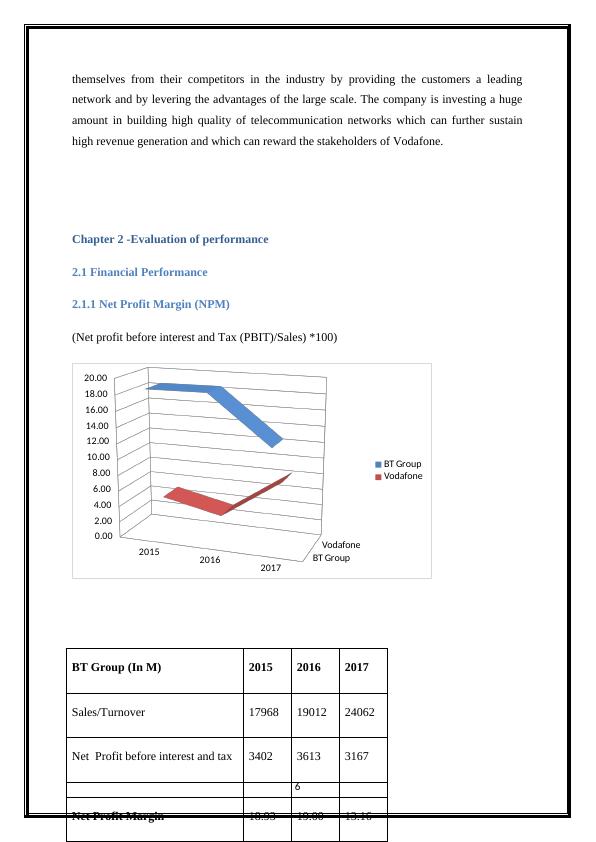
2.1.1 Net Profit Margin (NPM)
(Net profit before interest and Tax (PBIT)/Sales) *100)
2015 2016 2017
0.00
2.00
4.00
6.00
8.00
10.00
12.00
14.00
16.00
18.00
20.00
BT Group
Vodafone
BT Group
Vodafone
6
BT Group (In M) 2015 2016 2017
Sales/Turnover 17968 19012 24062
Net Profit before interest and tax 3402 3613 3167
Net Profit Margin 18.93 19.00 13.16
network and by levering the advantages of the large scale. The company is investing a huge
amount in building high quality of telecommunication networks which can further sustain
high revenue generation and which can reward the stakeholders of Vodafone.
Chapter 2 -Evaluation of performance
2.1 Financial Performance
2.1.1 Net Profit Margin (NPM)
(Net profit before interest and Tax (PBIT)/Sales) *100)
2015 2016 2017
0.00
2.00
4.00
6.00
8.00
10.00
12.00
14.00
16.00
18.00
20.00
BT Group
Vodafone
BT Group
Vodafone
6
BT Group (In M) 2015 2016 2017
Sales/Turnover 17968 19012 24062
Net Profit before interest and tax 3402 3613 3167
Net Profit Margin 18.93 19.00 13.16
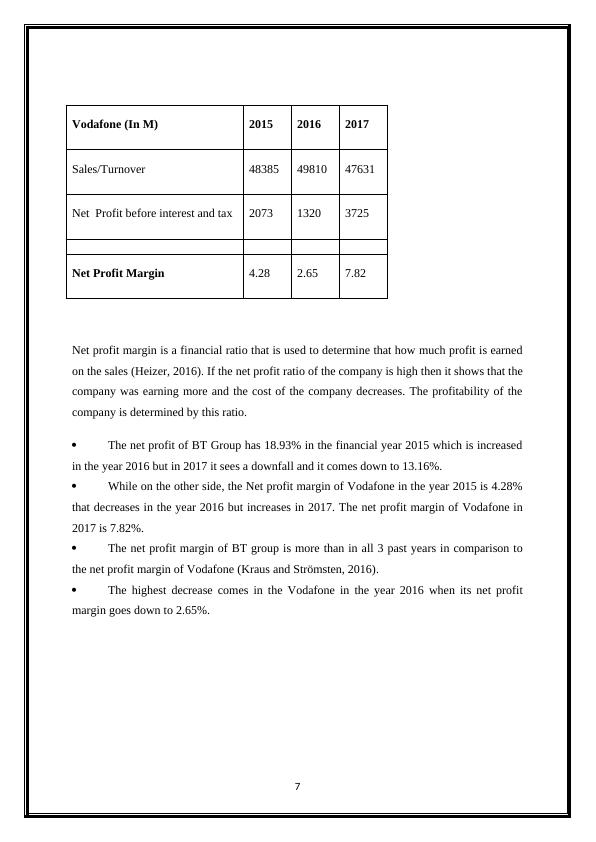
Vodafone (In M) 2015 2016 2017
Sales/Turnover 48385 49810 47631
Net Profit before interest and tax 2073 1320 3725
Net Profit Margin 4.28 2.65 7.82
Net profit margin is a financial ratio that is used to determine that how much profit is earned
on the sales (Heizer, 2016). If the net profit ratio of the company is high then it shows that the
company was earning more and the cost of the company decreases. The profitability of the
company is determined by this ratio.
The net profit of BT Group has 18.93% in the financial year 2015 which is increased
in the year 2016 but in 2017 it sees a downfall and it comes down to 13.16%.
While on the other side, the Net profit margin of Vodafone in the year 2015 is 4.28%
that decreases in the year 2016 but increases in 2017. The net profit margin of Vodafone in
2017 is 7.82%.
The net profit margin of BT group is more than in all 3 past years in comparison to
the net profit margin of Vodafone (Kraus and Strömsten, 2016).
The highest decrease comes in the Vodafone in the year 2016 when its net profit
margin goes down to 2.65%.
7
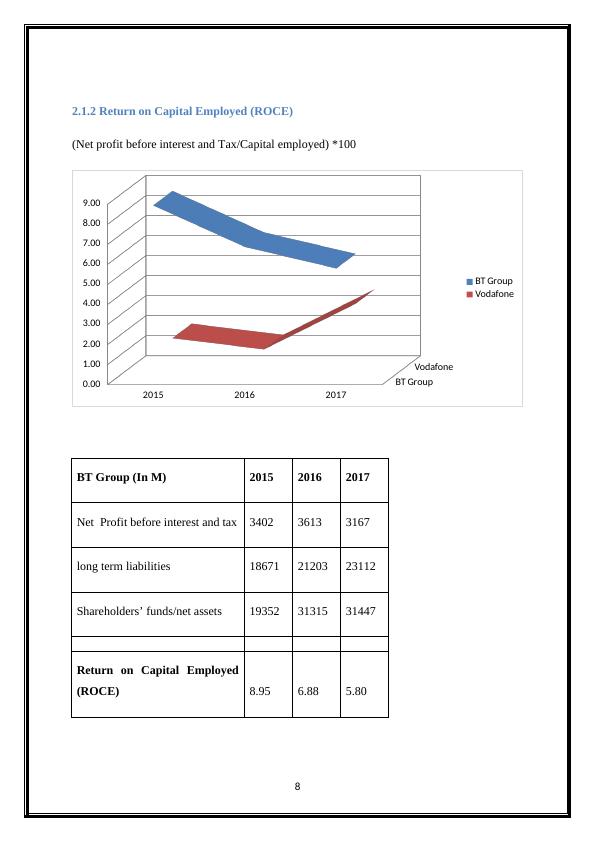
2.1.2 Return on Capital Employed (ROCE)
(Net profit before interest and Tax/Capital employed) *100
2015 2016 2017
0.00
1.00
2.00
3.00
4.00
5.00
6.00
7.00
8.00
9.00
BT Group
Vodafone
BT Group
Vodafone
BT Group (In M) 2015 2016 2017
Net Profit before interest and tax 3402 3613 3167
long term liabilities 18671 21203 23112
Shareholders’ funds/net assets 19352 31315 31447
Return on Capital Employed
(ROCE) 8.95 6.88 5.80
8
End of preview
Want to access all the pages? Upload your documents or become a member.
Related Documents
Financial Performance Analysis of Vodafone Plc and BT Group Plclg...
|25
|4029
|59
Economics: Overview of the Telecommunications Industrylg...
|14
|3233
|12
British Telecom(BT) | Case Studylg...
|23
|4095
|26
Financial Accounting and Auditing and Taxationlg...
|18
|4254
|135
Corporate Accounting for Telstra: Financial Performance, Sources of Finance, and Changes in Accounting Policieslg...
|13
|2580
|104
Telecommunication Infrastructure and Service Provision: A Case Study of BT Grouplg...
|10
|2938
|79