logo

Descriptive Statistics for Rental Properties

The assignment involves analyzing rental costs of one-bedroom accommodations near a university campus and presenting the findings in a Word document or PDF.

21 Pages2589 Words26 Views
   

Added on  2023-01-16

About This Document

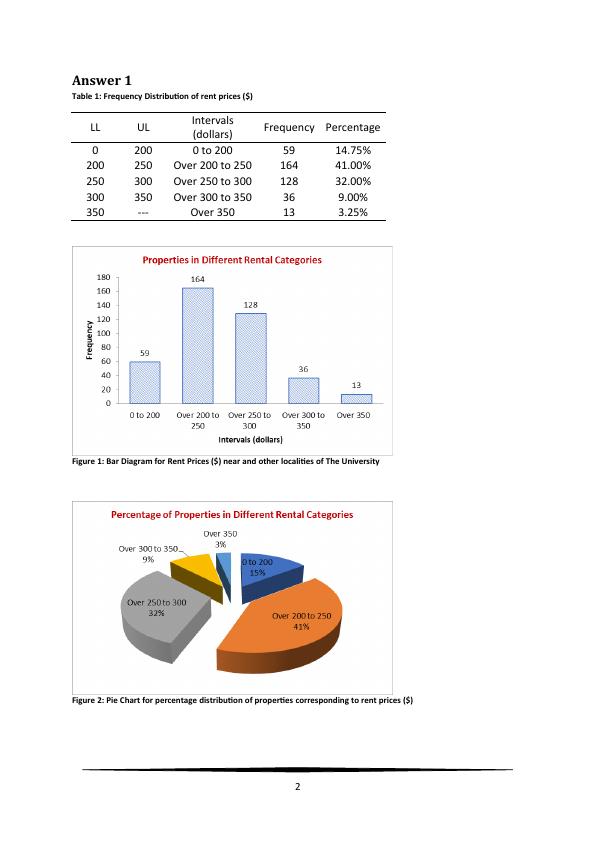
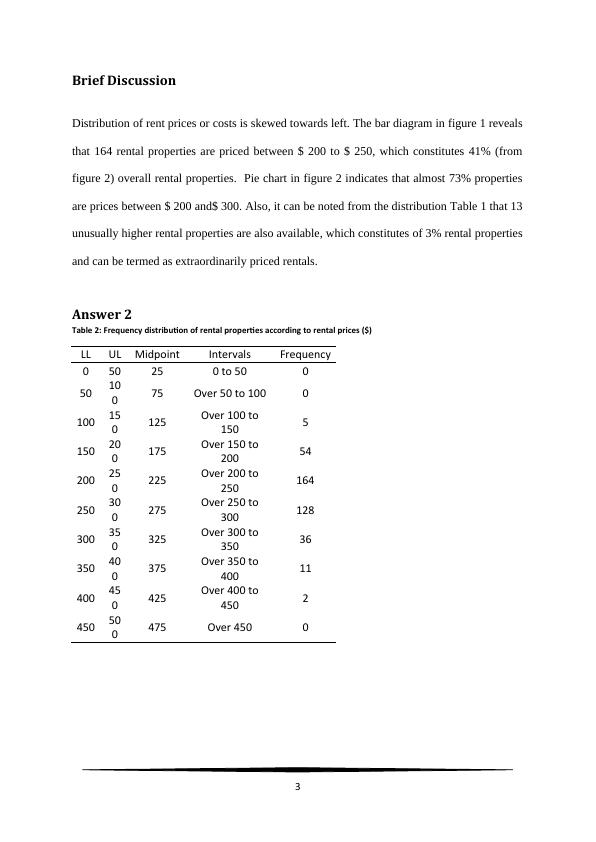
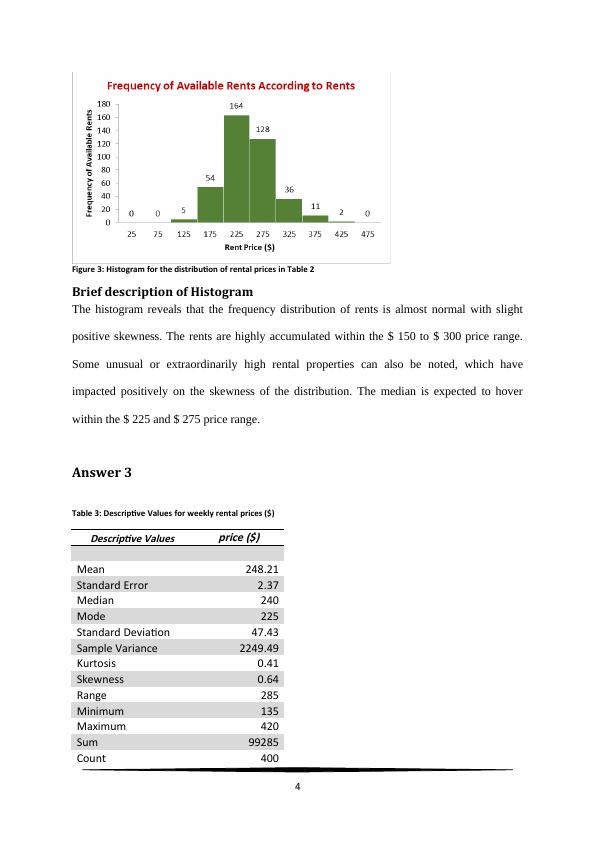
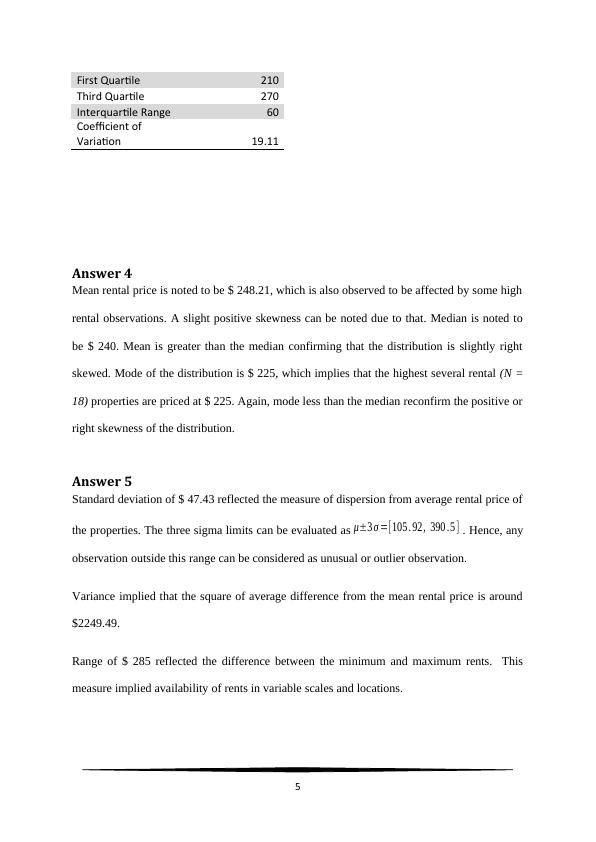
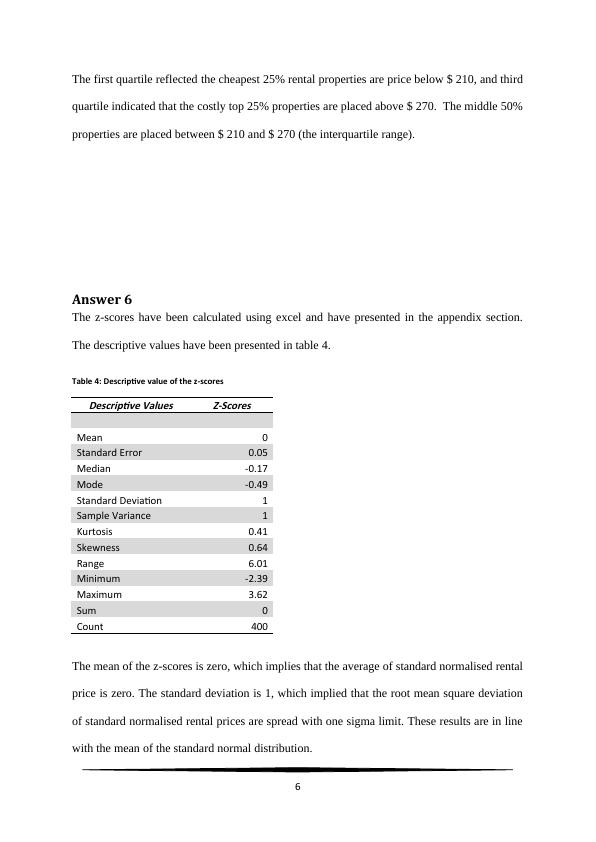
This document provides a comprehensive analysis of rental properties, focusing on descriptive statistics such as mean, median, mode, standard deviation, and variance. It includes frequency distribution tables and histograms for different price ranges. The document also compares rental properties near the university campus and in other areas, highlighting differences in central tendencies and variations.

Descriptive Statistics for Rental Properties

The assignment involves analyzing rental costs of one-bedroom accommodations near a university campus and presenting the findings in a Word document or PDF.

   Added on 2023-01-16

ShareRelated Documents
BUGEN1502 Business Statistics
Semester 1, 2019
Assignment 1: Descriptive statistics
1
Descriptive Statistics for Rental Properties_1
Answer 1
Table 1: Frequency Distribution of rent prices ($)
LL UL Intervals
(dollars) Frequency Percentage
0 200 0 to 200 59 14.75%
200 250 Over 200 to 250 164 41.00%
250 300 Over 250 to 300 128 32.00%
300 350 Over 300 to 350 36 9.00%
350 --- Over 350 13 3.25%
Figure 1: Bar Diagram for Rent Prices ($) near and other localities of The University
Figure 2: Pie Chart for percentage distribution of properties corresponding to rent prices ($)
2
Descriptive Statistics for Rental Properties_2
Brief Discussion
Distribution of rent prices or costs is skewed towards left. The bar diagram in figure 1 reveals
that 164 rental properties are priced between $ 200 to $ 250, which constitutes 41% (from
figure 2) overall rental properties. Pie chart in figure 2 indicates that almost 73% properties
are prices between $ 200 and$ 300. Also, it can be noted from the distribution Table 1 that 13
unusually higher rental properties are also available, which constitutes of 3% rental properties
and can be termed as extraordinarily priced rentals.
Answer 2
Table 2: Frequency distribution of rental properties according to rental prices ($)
LL UL Midpoint Intervals Frequency
0 50 25 0 to 50 0
50 10
0 75 Over 50 to 100 0
100 15
0 125 Over 100 to
150 5
150 20
0 175 Over 150 to
200 54
200 25
0 225 Over 200 to
250 164
250 30
0 275 Over 250 to
300 128
300 35
0 325 Over 300 to
350 36
350 40
0 375 Over 350 to
400 11
400 45
0 425 Over 400 to
450 2
450 50
0 475 Over 450 0
3
Descriptive Statistics for Rental Properties_3
Figure 3: Histogram for the distribution of rental prices in Table 2
Brief description of Histogram
The histogram reveals that the frequency distribution of rents is almost normal with slight
positive skewness. The rents are highly accumulated within the $ 150 to $ 300 price range.
Some unusual or extraordinarily high rental properties can also be noted, which have
impacted positively on the skewness of the distribution. The median is expected to hover
within the $ 225 and $ 275 price range.
Answer 3
Table 3: Descriptive Values for weekly rental prices ($)Descriptive Values
price ($)
Mean 248.21
Standard Error 2.37
Median 240
Mode 225
Standard Deviation 47.43
Sample Variance 2249.49
Kurtosis 0.41
Skewness 0.64
Range 285
Minimum 135
Maximum 420
Sum 99285
Count 400
4
Descriptive Statistics for Rental Properties_4
First Quartile 210
Third Quartile 270
Interquartile Range 60
Coefficient of
Variation 19.11
Answer 4
Mean rental price is noted to be $ 248.21, which is also observed to be affected by some high
rental observations. A slight positive skewness can be noted due to that. Median is noted to
be $ 240. Mean is greater than the median confirming that the distribution is slightly right
skewed. Mode of the distribution is $ 225, which implies that the highest several rental (N =
18) properties are priced at $ 225. Again, mode less than the median reconfirm the positive or
right skewness of the distribution.
Answer 5
Standard deviation of $ 47.43 reflected the measure of dispersion from average rental price of
the properties. The three sigma limits can be evaluated as μ±3 σ =[ 105 . 92, 390 .5 ] . Hence, any
observation outside this range can be considered as unusual or outlier observation.
Variance implied that the square of average difference from the mean rental price is around
$2249.49.
Range of $ 285 reflected the difference between the minimum and maximum rents. This
measure implied availability of rents in variable scales and locations.
5
Descriptive Statistics for Rental Properties_5
The first quartile reflected the cheapest 25% rental properties are price below $ 210, and third
quartile indicated that the costly top 25% properties are placed above $ 270. The middle 50%
properties are placed between $ 210 and $ 270 (the interquartile range).
Answer 6
The z-scores have been calculated using excel and have presented in the appendix section.
The descriptive values have been presented in table 4.
Table 4: Descriptive value of the z-scoresDescriptive Values Z-Scores
Mean 0
Standard Error 0.05
Median -0.17
Mode -0.49
Standard Deviation 1
Sample Variance 1
Kurtosis 0.41
Skewness 0.64
Range 6.01
Minimum -2.39
Maximum 3.62
Sum 0
Count 400
The mean of the z-scores is zero, which implies that the average of standard normalised rental
price is zero. The standard deviation is 1, which implied that the root mean square deviation
of standard normalised rental prices are spread with one sigma limit. These results are in line
with the mean of the standard normal distribution.
6
Descriptive Statistics for Rental Properties_6

End of preview

Want to access all the pages? Upload your documents or become a member.

Related Documents
BUGEN1502 | Statistical Charts
|6
|564
|15

Case Study Of Business Statistics Report
|9
|575
|15

HI6007: Statistics For Business Decisions
|7
|944
|488

Group Assignment – Statistics
|11
|1454
|90

Desklib - Online Library for Study Material with Solved Assignments, Essays, Dissertations
|6
|948
|347

Quantitative Analysis for Business
|9
|1616
|301