Burberry's Financial Performance, Strategic Position & Options
VerifiedAdded on 2023/06/12
|20
|3973
|216
Report
AI Summary
This report provides a detailed analysis of Burberry Group Plc's financial performance and strategic position in the UK fashion industry, comparing it with its competitor, Debenhams Plc. The analysis includes profitability ratios (gross margin, operating margin, and return on capital employed), liquidity ratios (current ratio and quick ratio), and financial ratios (interest cover ratio and gearing ratio). The findings indicate that Burberry maintains a stronger financial position and competitive advantage over Debenhams. Furthermore, the report evaluates potential strategic options for Burberry, considering factors such as market trends, brand image, and investment strategies, utilizing frameworks like the Ansoff matrix and Porter’s generic model. The report concludes by recommending a preferred strategic option aimed at enhancing profitability and global presence.
Running head: MANAGING STRATEGY
Managing Strategy
Name of the Student:
Name of the University:
Author’s Note:
Course ID:
Managing Strategy
Name of the Student:
Name of the University:
Author’s Note:
Course ID:
Paraphrase This Document
Need a fresh take? Get an instant paraphrase of this document with our AI Paraphraser
1MANAGING STRATEGY
Table of Contents
1. Financial performance and position of Burberry and its competitor, Debenhams:.....................2
1.1 Profitability analysis:.............................................................................................................2
1.2 Liquidity analysis:.................................................................................................................4
1.3 Financial ratio analysis:.........................................................................................................6
2. Strategic position of Burberry:....................................................................................................8
2.1 Evaluation of the strategic options available to the organisation:.........................................8
2.2 Preferred strategic option for the organisation:...................................................................12
References:....................................................................................................................................13
Appendices:...................................................................................................................................15
2MANAGING STRATEGY
1. Financial performance and position of Burberry and its competitor, Debenhams:
This section aims to evaluate the strategic position of an organisation in the context of the
changing business conditions in the fashion industry of UK. Hence, for fitting the purpose of this
assignment, Burberry Group Plc has been selected, which is one of the leading manufacturer and
distributor of trench coats, fashion accessories, sunglasses, ready-to-wear outwear, fragrances
and cosmetics (Burberry, 2018). In order to enhance the quality of the analysis further, its main
competitor, Debenhams Plc is taken into consideration for comparing with the financial
performance and position of Burberry. Debenhams is a British multinational retailer selling
various kinds of luxury fashion products in UK and Ireland having franchise stores in the other
global nations as well (Debenhams.com, 2018). The financial performance and position of both
the organisations have been analysed with the help of the following ratios, which are described
as follows:
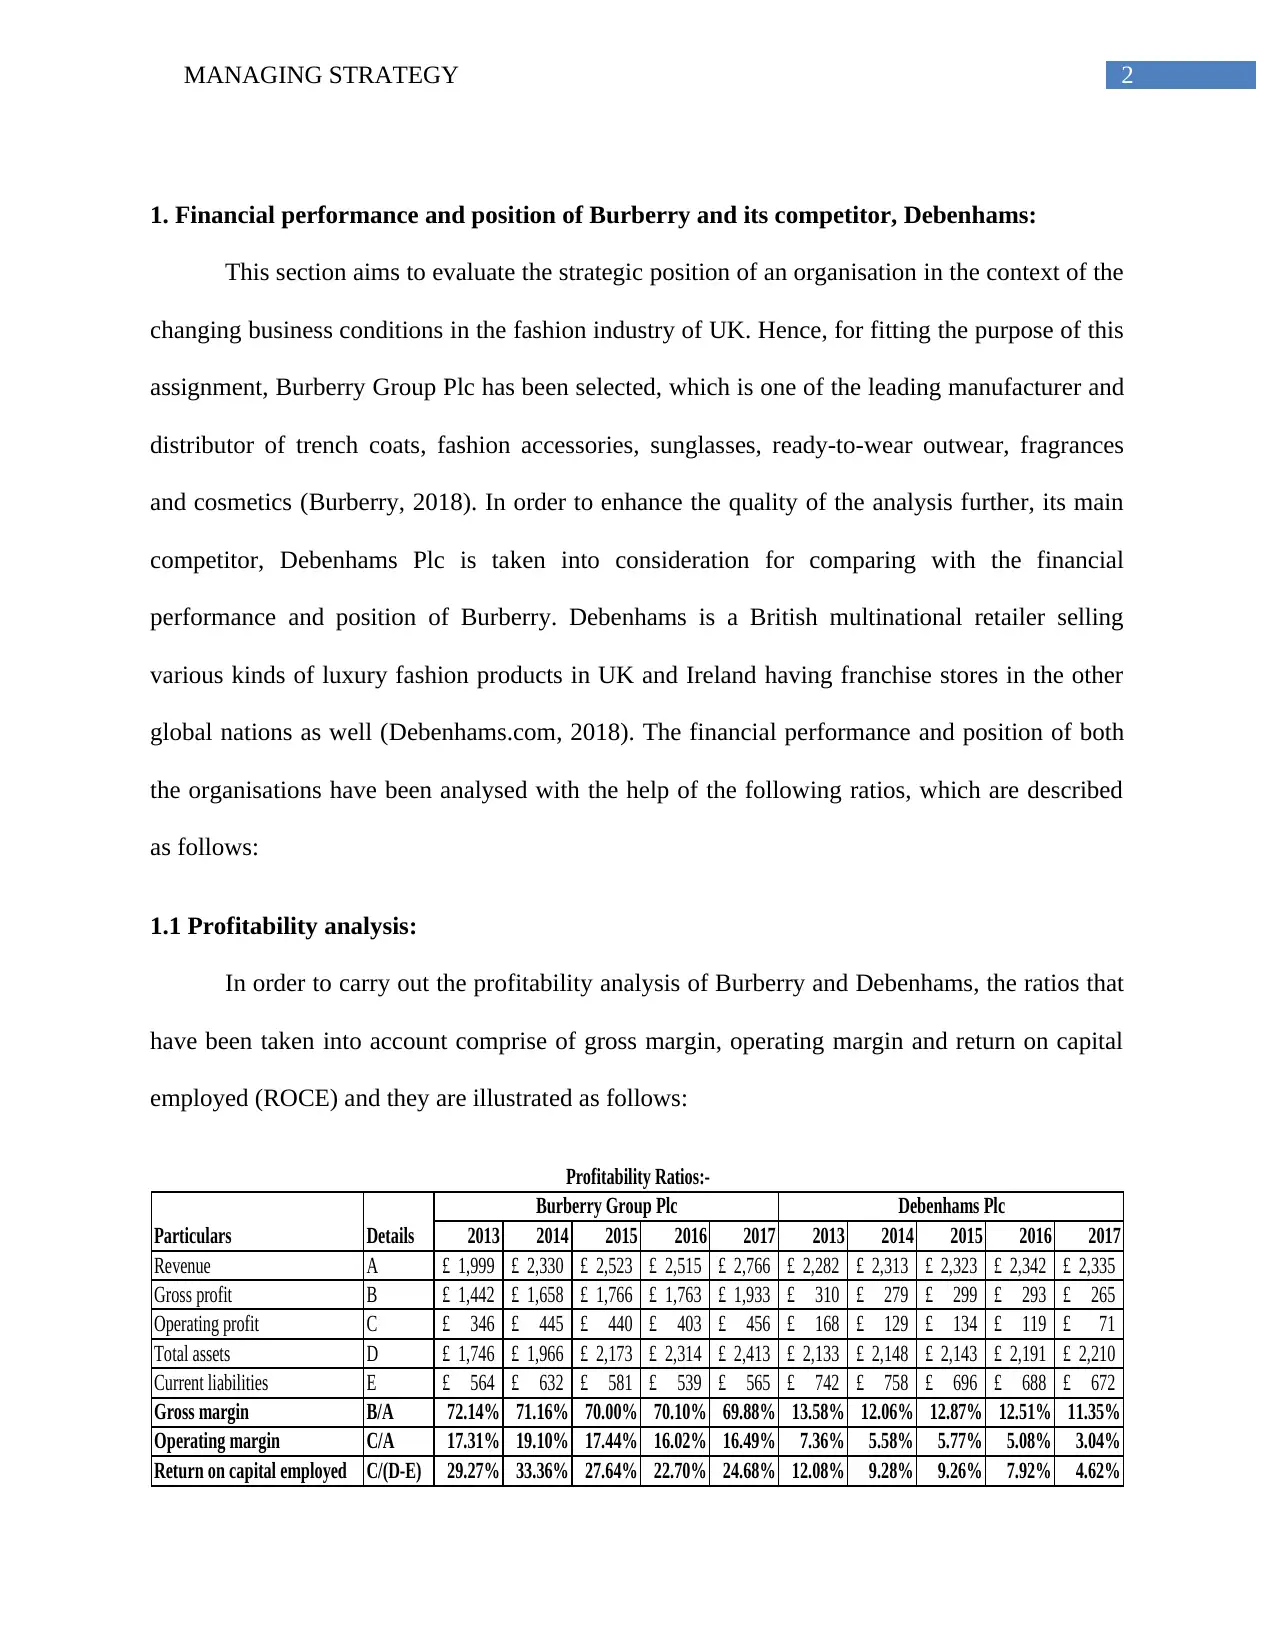
1.1 Profitability analysis:
In order to carry out the profitability analysis of Burberry and Debenhams, the ratios that
have been taken into account comprise of gross margin, operating margin and return on capital
employed (ROCE) and they are illustrated as follows:
2013 2014 2015 2016 2017 2013 2014 2015 2016 2017
Revenue A 1,999£ 2,330£ 2,523£ 2,515£ 2,766£ 2,282£ 2,313£ 2,323£ 2,342£ 2,335£
Gross profit B 1,442£ 1,658£ 1,766£ 1,763£ 1,933£ 310£ 279£ 299£ 293£ 265£
Operating profit C 346£ 445£ 440£ 403£ 456£ 168£ 129£ 134£ 119£ 71£
Total assets D 1,746£ 1,966£ 2,173£ 2,314£ 2,413£ 2,133£ 2,148£ 2,143£ 2,191£ 2,210£
Current liabilities E 564£ 632£ 581£ 539£ 565£ 742£ 758£ 696£ 688£ 672£
Gross margin B/A 72.14% 71.16% 70.00% 70.10% 69.88% 13.58% 12.06% 12.87% 12.51% 11.35%
Operating margin C/A 17.31% 19.10% 17.44% 16.02% 16.49% 7.36% 5.58% 5.77% 5.08% 3.04%
Return on capital employed C/(D-E) 29.27% 33.36% 27.64% 22.70% 24.68% 12.08% 9.28% 9.26% 7.92% 4.62%
Burberry Group Plc Debenhams Plc
Particulars Details
Profitability Ratios:-
1. Financial performance and position of Burberry and its competitor, Debenhams:
This section aims to evaluate the strategic position of an organisation in the context of the
changing business conditions in the fashion industry of UK. Hence, for fitting the purpose of this
assignment, Burberry Group Plc has been selected, which is one of the leading manufacturer and
distributor of trench coats, fashion accessories, sunglasses, ready-to-wear outwear, fragrances
and cosmetics (Burberry, 2018). In order to enhance the quality of the analysis further, its main
competitor, Debenhams Plc is taken into consideration for comparing with the financial
performance and position of Burberry. Debenhams is a British multinational retailer selling
various kinds of luxury fashion products in UK and Ireland having franchise stores in the other
global nations as well (Debenhams.com, 2018). The financial performance and position of both
the organisations have been analysed with the help of the following ratios, which are described
as follows:
1.1 Profitability analysis:
In order to carry out the profitability analysis of Burberry and Debenhams, the ratios that
have been taken into account comprise of gross margin, operating margin and return on capital
employed (ROCE) and they are illustrated as follows:
2013 2014 2015 2016 2017 2013 2014 2015 2016 2017
Revenue A 1,999£ 2,330£ 2,523£ 2,515£ 2,766£ 2,282£ 2,313£ 2,323£ 2,342£ 2,335£
Gross profit B 1,442£ 1,658£ 1,766£ 1,763£ 1,933£ 310£ 279£ 299£ 293£ 265£
Operating profit C 346£ 445£ 440£ 403£ 456£ 168£ 129£ 134£ 119£ 71£
Total assets D 1,746£ 1,966£ 2,173£ 2,314£ 2,413£ 2,133£ 2,148£ 2,143£ 2,191£ 2,210£
Current liabilities E 564£ 632£ 581£ 539£ 565£ 742£ 758£ 696£ 688£ 672£
Gross margin B/A 72.14% 71.16% 70.00% 70.10% 69.88% 13.58% 12.06% 12.87% 12.51% 11.35%
Operating margin C/A 17.31% 19.10% 17.44% 16.02% 16.49% 7.36% 5.58% 5.77% 5.08% 3.04%
Return on capital employed C/(D-E) 29.27% 33.36% 27.64% 22.70% 24.68% 12.08% 9.28% 9.26% 7.92% 4.62%
Burberry Group Plc Debenhams Plc
Particulars Details
Profitability Ratios:-
⊘ This is a preview!⊘
Do you want full access?
Subscribe today to unlock all pages.
Trusted by 1+ million students worldwide
3MANAGING STRATEGY
Table 1: Profitability ratios of Burberry Group Plc and Debenhams Plc for the years 2013-
2017
(Source: Uk.finance.yahoo.com, 2018)
2013 2014 2015 2016 2017 2013 2014 2015 2016 2017
Burberry Group Plc Debenhams Plc
0.00%
10.00%
20.00%
30.00%
40.00%
50.00%
60.00%
70.00%
80.00%
Profitability Ratios of Burberry and
Debenhams
Gross margin
Operating margin
Return on capital employed
Figure 1: Profitability ratios of Burberry Group Plc and Debenhams Plc for the years
2013-2017
(Source: Uk.finance.yahoo.com, 2018)
According to the above figure, it could be found that the gross margin of Burberry Plc
has fallen from 2013 to 2015 with a slight increase in 2016; however, the fall is inherent again in
2017. In case of Debenhams Plc, the gross margin has declined in 2014 followed by a slight
increase in 2015; however, it has continued to decline in the next two years. As commented by
Bryce (2017), gross profit is the amount earned after all the direct costs are deducted from the
overall revenues generated. Gross margin is obtained by dividing sales revenue with the gross
margin. In this case, the gross margin of Burberry is way too higher in contrast to that of
Paraphrase This Document
Need a fresh take? Get an instant paraphrase of this document with our AI Paraphraser
4MANAGING STRATEGY
Debenhams due to the fact that the former organisation might have obtained additional discounts
on volume of goods purchased. As a result, it has managed to keep its direct costs low and thus,
higher profits are earned, even though there is not much difference in the amount of revenues
generated.
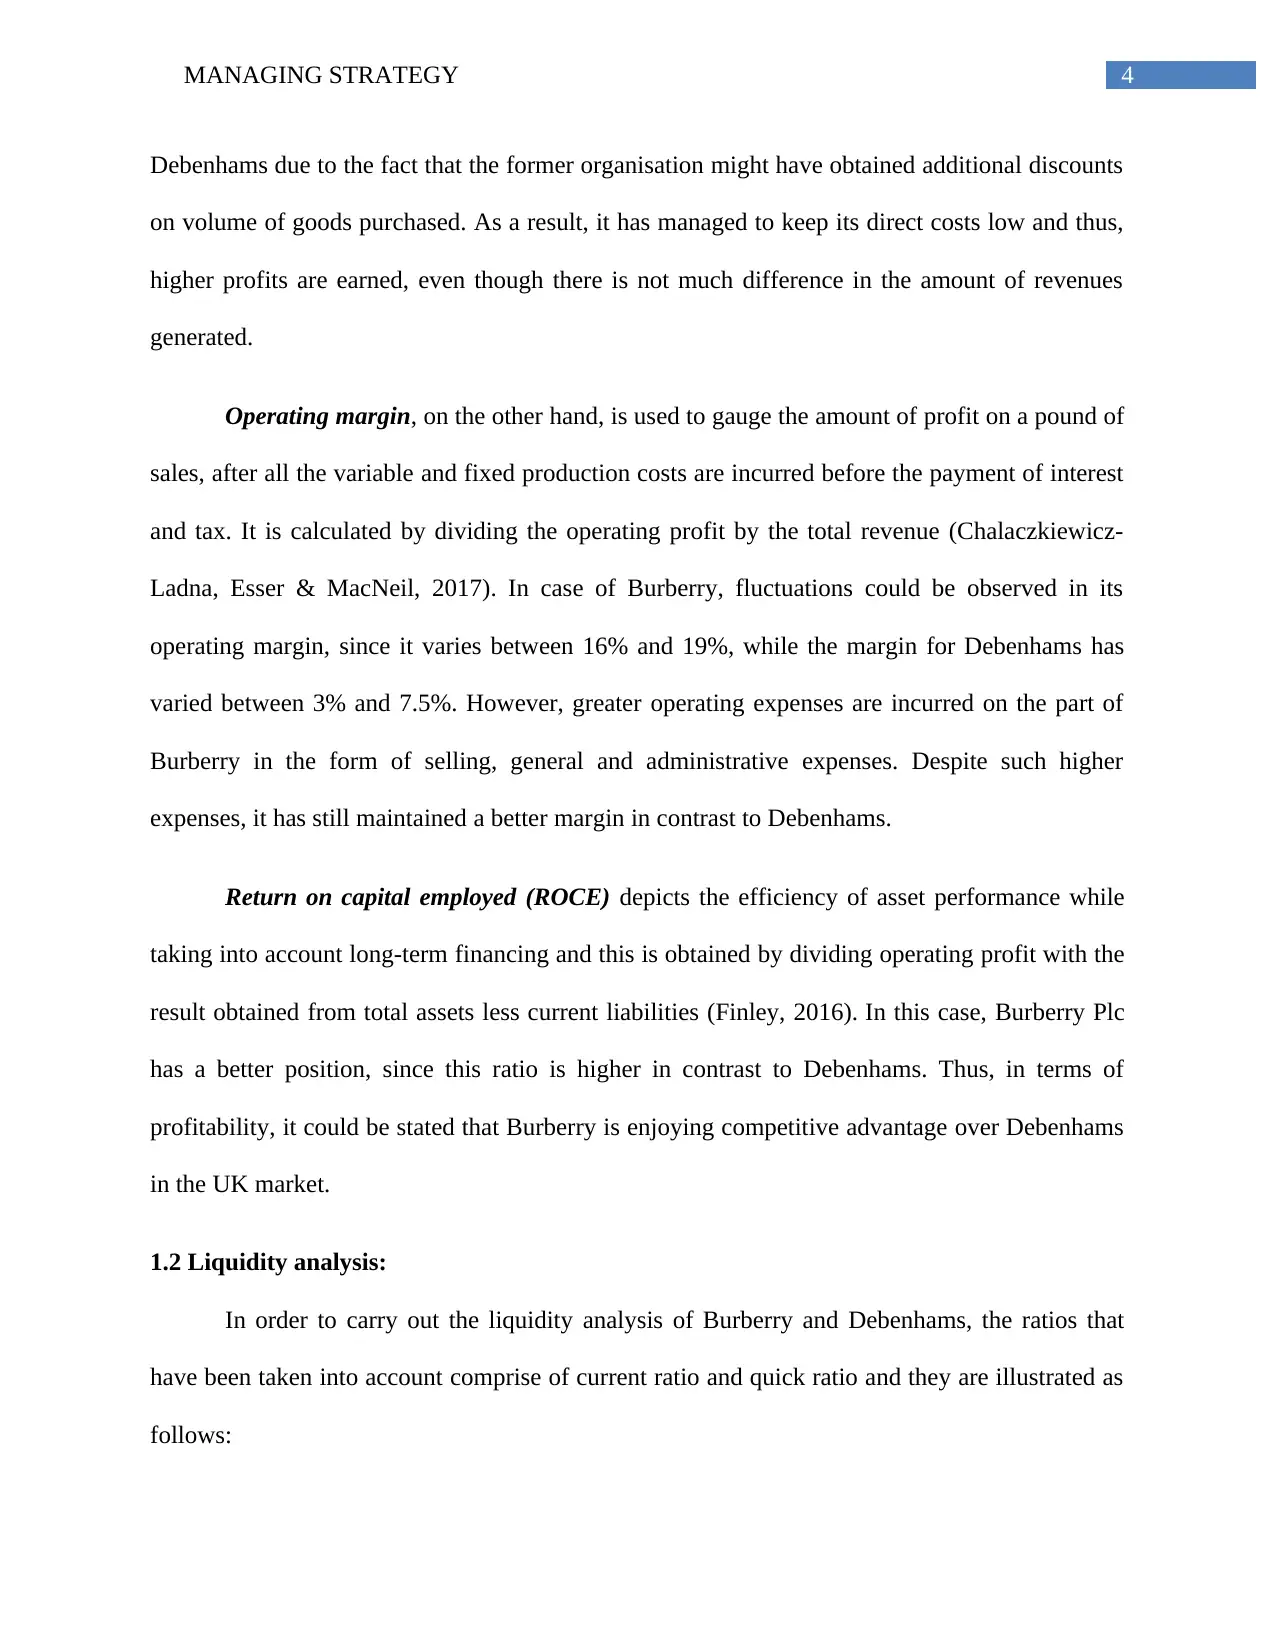
Operating margin, on the other hand, is used to gauge the amount of profit on a pound of
sales, after all the variable and fixed production costs are incurred before the payment of interest
and tax. It is calculated by dividing the operating profit by the total revenue (Chalaczkiewicz-
Ladna, Esser & MacNeil, 2017). In case of Burberry, fluctuations could be observed in its
operating margin, since it varies between 16% and 19%, while the margin for Debenhams has
varied between 3% and 7.5%. However, greater operating expenses are incurred on the part of
Burberry in the form of selling, general and administrative expenses. Despite such higher
expenses, it has still maintained a better margin in contrast to Debenhams.
Return on capital employed (ROCE) depicts the efficiency of asset performance while
taking into account long-term financing and this is obtained by dividing operating profit with the
result obtained from total assets less current liabilities (Finley, 2016). In this case, Burberry Plc
has a better position, since this ratio is higher in contrast to Debenhams. Thus, in terms of
profitability, it could be stated that Burberry is enjoying competitive advantage over Debenhams
in the UK market.
1.2 Liquidity analysis:
In order to carry out the liquidity analysis of Burberry and Debenhams, the ratios that
have been taken into account comprise of current ratio and quick ratio and they are illustrated as
follows:
Debenhams due to the fact that the former organisation might have obtained additional discounts
on volume of goods purchased. As a result, it has managed to keep its direct costs low and thus,
higher profits are earned, even though there is not much difference in the amount of revenues
generated.
Operating margin, on the other hand, is used to gauge the amount of profit on a pound of
sales, after all the variable and fixed production costs are incurred before the payment of interest
and tax. It is calculated by dividing the operating profit by the total revenue (Chalaczkiewicz-
Ladna, Esser & MacNeil, 2017). In case of Burberry, fluctuations could be observed in its
operating margin, since it varies between 16% and 19%, while the margin for Debenhams has
varied between 3% and 7.5%. However, greater operating expenses are incurred on the part of
Burberry in the form of selling, general and administrative expenses. Despite such higher
expenses, it has still maintained a better margin in contrast to Debenhams.
Return on capital employed (ROCE) depicts the efficiency of asset performance while
taking into account long-term financing and this is obtained by dividing operating profit with the
result obtained from total assets less current liabilities (Finley, 2016). In this case, Burberry Plc
has a better position, since this ratio is higher in contrast to Debenhams. Thus, in terms of
profitability, it could be stated that Burberry is enjoying competitive advantage over Debenhams
in the UK market.
1.2 Liquidity analysis:
In order to carry out the liquidity analysis of Burberry and Debenhams, the ratios that
have been taken into account comprise of current ratio and quick ratio and they are illustrated as
follows:
5MANAGING STRATEGY
2013 2014 2015 2016 2017 2013 2014 2015 2016 2017
Current assets A 966£ 1,210£ 1,334£ 1,495£ 1,639£ 470£ 486£ 460£ 503£ 446£
Inventories B 351£ 420£ 437£ 487£ 505£ 358£ 346£ 332£ 326£ 318£
Current liabilities C 564£ 632£ 581£ 539£ 565£ 742£ 758£ 696£ 688£ 672£
Current ratio A/C 1.71 1.91 2.30 2.77 2.90 0.63 0.64 0.66 0.73 0.66
Quick ratio (A-B)/C 1.09 1.25 1.54 1.87 2.01 0.15 0.18 0.18 0.26 0.19
Liquidity Ratios:-
Particulars Details
Burberry Group Plc Debenhams Plc
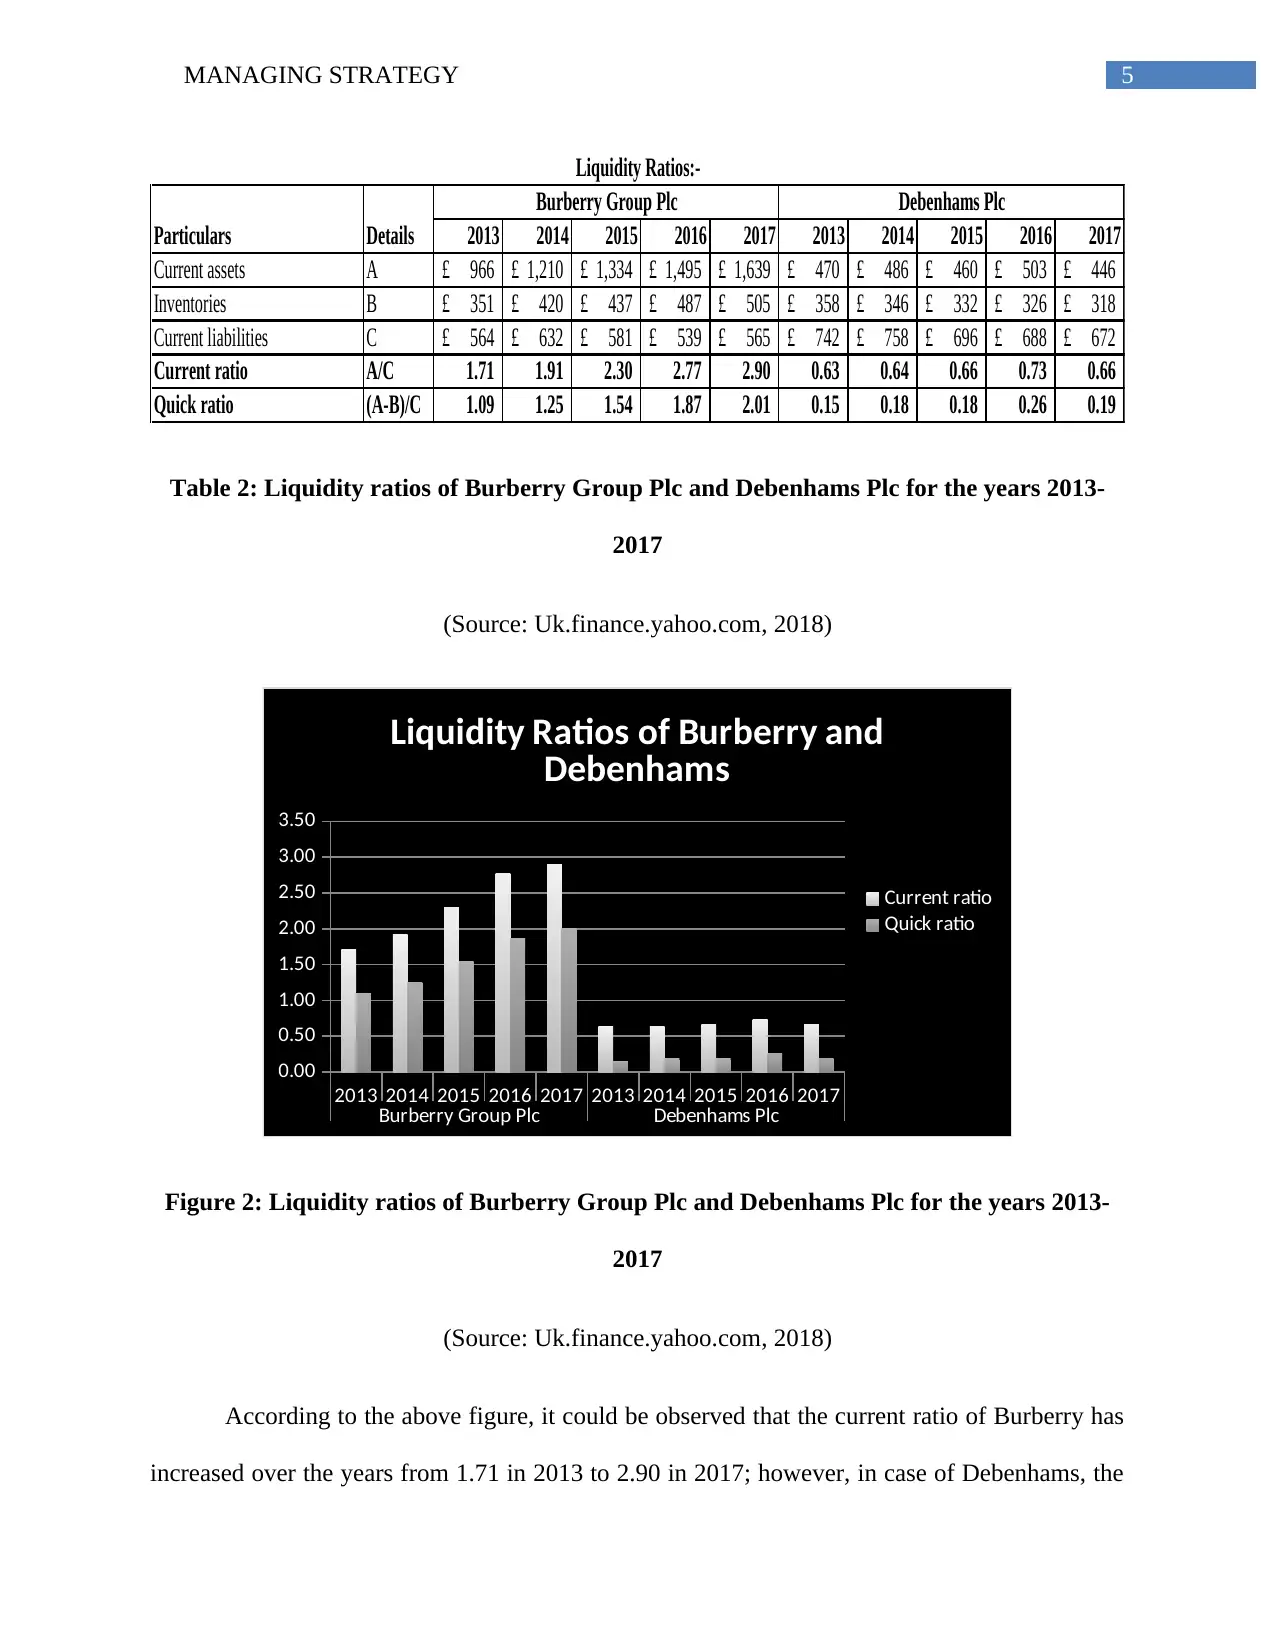
Table 2: Liquidity ratios of Burberry Group Plc and Debenhams Plc for the years 2013-
2017
(Source: Uk.finance.yahoo.com, 2018)
2013 2014 2015 2016 2017 2013 2014 2015 2016 2017
Burberry Group Plc Debenhams Plc
0.00
0.50
1.00
1.50
2.00
2.50
3.00
3.50
Liquidity Ratios of Burberry and
Debenhams
Current ratio
Quick ratio
Figure 2: Liquidity ratios of Burberry Group Plc and Debenhams Plc for the years 2013-
2017
(Source: Uk.finance.yahoo.com, 2018)
According to the above figure, it could be observed that the current ratio of Burberry has
increased over the years from 1.71 in 2013 to 2.90 in 2017; however, in case of Debenhams, the
2013 2014 2015 2016 2017 2013 2014 2015 2016 2017
Current assets A 966£ 1,210£ 1,334£ 1,495£ 1,639£ 470£ 486£ 460£ 503£ 446£
Inventories B 351£ 420£ 437£ 487£ 505£ 358£ 346£ 332£ 326£ 318£
Current liabilities C 564£ 632£ 581£ 539£ 565£ 742£ 758£ 696£ 688£ 672£
Current ratio A/C 1.71 1.91 2.30 2.77 2.90 0.63 0.64 0.66 0.73 0.66
Quick ratio (A-B)/C 1.09 1.25 1.54 1.87 2.01 0.15 0.18 0.18 0.26 0.19
Liquidity Ratios:-
Particulars Details
Burberry Group Plc Debenhams Plc
Table 2: Liquidity ratios of Burberry Group Plc and Debenhams Plc for the years 2013-
2017
(Source: Uk.finance.yahoo.com, 2018)
2013 2014 2015 2016 2017 2013 2014 2015 2016 2017
Burberry Group Plc Debenhams Plc
0.00
0.50
1.00
1.50
2.00
2.50
3.00
3.50
Liquidity Ratios of Burberry and
Debenhams
Current ratio
Quick ratio
Figure 2: Liquidity ratios of Burberry Group Plc and Debenhams Plc for the years 2013-
2017
(Source: Uk.finance.yahoo.com, 2018)
According to the above figure, it could be observed that the current ratio of Burberry has
increased over the years from 1.71 in 2013 to 2.90 in 2017; however, in case of Debenhams, the
⊘ This is a preview!⊘
Do you want full access?
Subscribe today to unlock all pages.
Trusted by 1+ million students worldwide
6MANAGING STRATEGY
ratio has been below 1 in all the five years. The current ratio is obtained by dividing current
assets by current liabilities (Gill, 2018). On the other hand, quick ratio is a measure of liquidity
as well and it denotes the ability of the organisation in meeting its short-term dues with the short-
term asset base available. However, for computing this ratio, inventory is deducted from current
assets and the result is divided by current liabilities (Hussey & Ong, 2017). The quick ratio has
similar trend like that of current ratio for both the organisations, which denote that Burberry is
highly capable of clearing its existing dues and obligations, while the situation is just the reverse
for Debenhams.
1.3 Financial ratio analysis:
2013 2014 2015 2016 2017 2013 2014 2015 2016 2017
Operating income A 346£ 445£ 440£ 403£ 456£ 168£ 129£ 134£ 119£ 71£
Interest expense B 4£ 3£ 2£ 2£ 2£ 11£ 14£ 17£ 14£ 11£
Non-current liabilities C 130£ 126£ 141£ 154£ 150£ 646£ 623£ 594£ 619£ 620£
Shareholders' equity D 1,017£ 1,165£ 1,401£ 1,565£ 1,692£ 744£ 767£ 853£ 884£ 918£
Interest cover ratio A/B 86.50 148.33 220.00 201.50 228.00 15.27 9.21 7.88 8.50 6.45
Gearing ratio C/(C+D) 0.11 0.10 0.09 0.09 0.08 0.46 0.45 0.41 0.41 0.40
Financial Ratios:-
Particulars Details
Burberry Group Plc Debenhams Plc
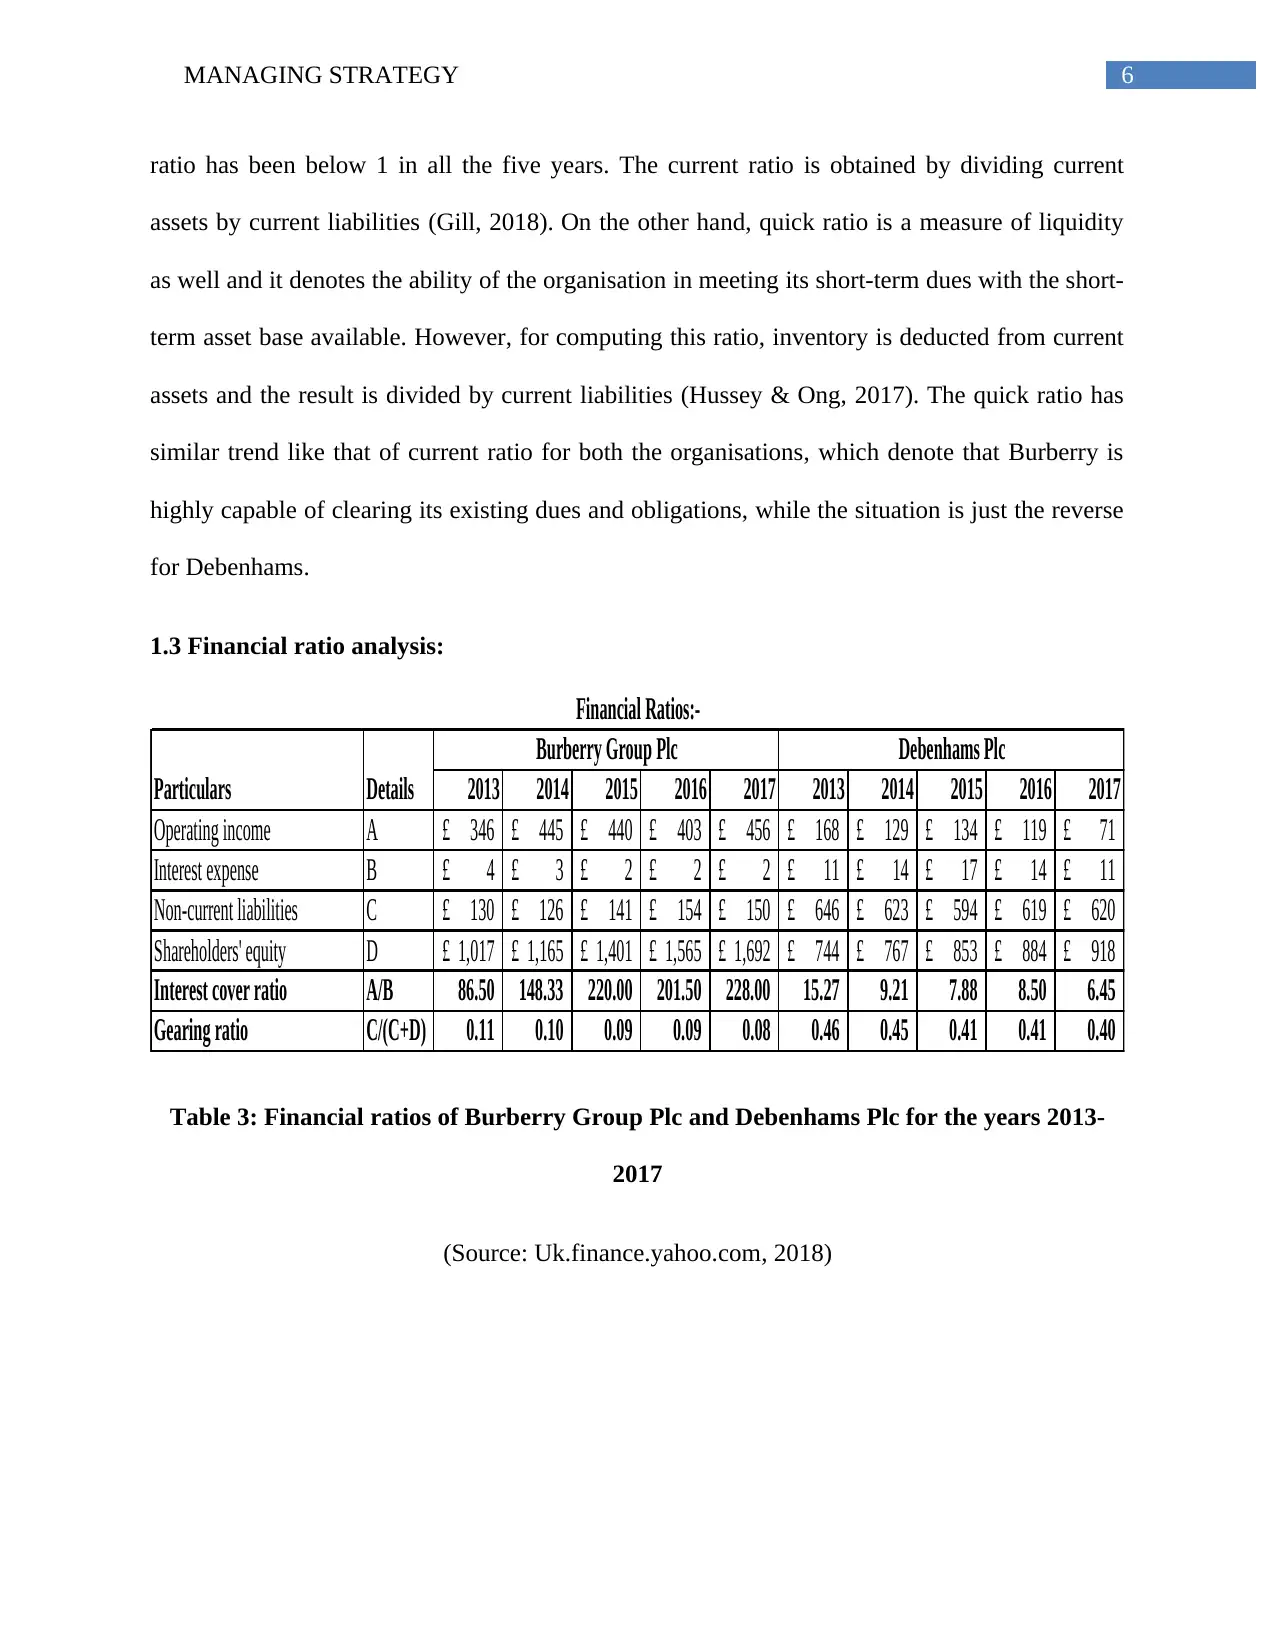
Table 3: Financial ratios of Burberry Group Plc and Debenhams Plc for the years 2013-
2017
(Source: Uk.finance.yahoo.com, 2018)
ratio has been below 1 in all the five years. The current ratio is obtained by dividing current
assets by current liabilities (Gill, 2018). On the other hand, quick ratio is a measure of liquidity
as well and it denotes the ability of the organisation in meeting its short-term dues with the short-
term asset base available. However, for computing this ratio, inventory is deducted from current
assets and the result is divided by current liabilities (Hussey & Ong, 2017). The quick ratio has
similar trend like that of current ratio for both the organisations, which denote that Burberry is
highly capable of clearing its existing dues and obligations, while the situation is just the reverse
for Debenhams.
1.3 Financial ratio analysis:
2013 2014 2015 2016 2017 2013 2014 2015 2016 2017
Operating income A 346£ 445£ 440£ 403£ 456£ 168£ 129£ 134£ 119£ 71£
Interest expense B 4£ 3£ 2£ 2£ 2£ 11£ 14£ 17£ 14£ 11£
Non-current liabilities C 130£ 126£ 141£ 154£ 150£ 646£ 623£ 594£ 619£ 620£
Shareholders' equity D 1,017£ 1,165£ 1,401£ 1,565£ 1,692£ 744£ 767£ 853£ 884£ 918£
Interest cover ratio A/B 86.50 148.33 220.00 201.50 228.00 15.27 9.21 7.88 8.50 6.45
Gearing ratio C/(C+D) 0.11 0.10 0.09 0.09 0.08 0.46 0.45 0.41 0.41 0.40
Financial Ratios:-
Particulars Details
Burberry Group Plc Debenhams Plc
Table 3: Financial ratios of Burberry Group Plc and Debenhams Plc for the years 2013-
2017
(Source: Uk.finance.yahoo.com, 2018)
Paraphrase This Document
Need a fresh take? Get an instant paraphrase of this document with our AI Paraphraser
7MANAGING STRATEGY
2013
2014
2015
2016
2017
2013
2014
2015
2016
2017
Burberry Group Plc Debenhams Plc
-
50.00
100.00
150.00
200.00
250.00
Financial Ratios of Burberry and
Debenhams
Interest cover ratio
Gearing ratio
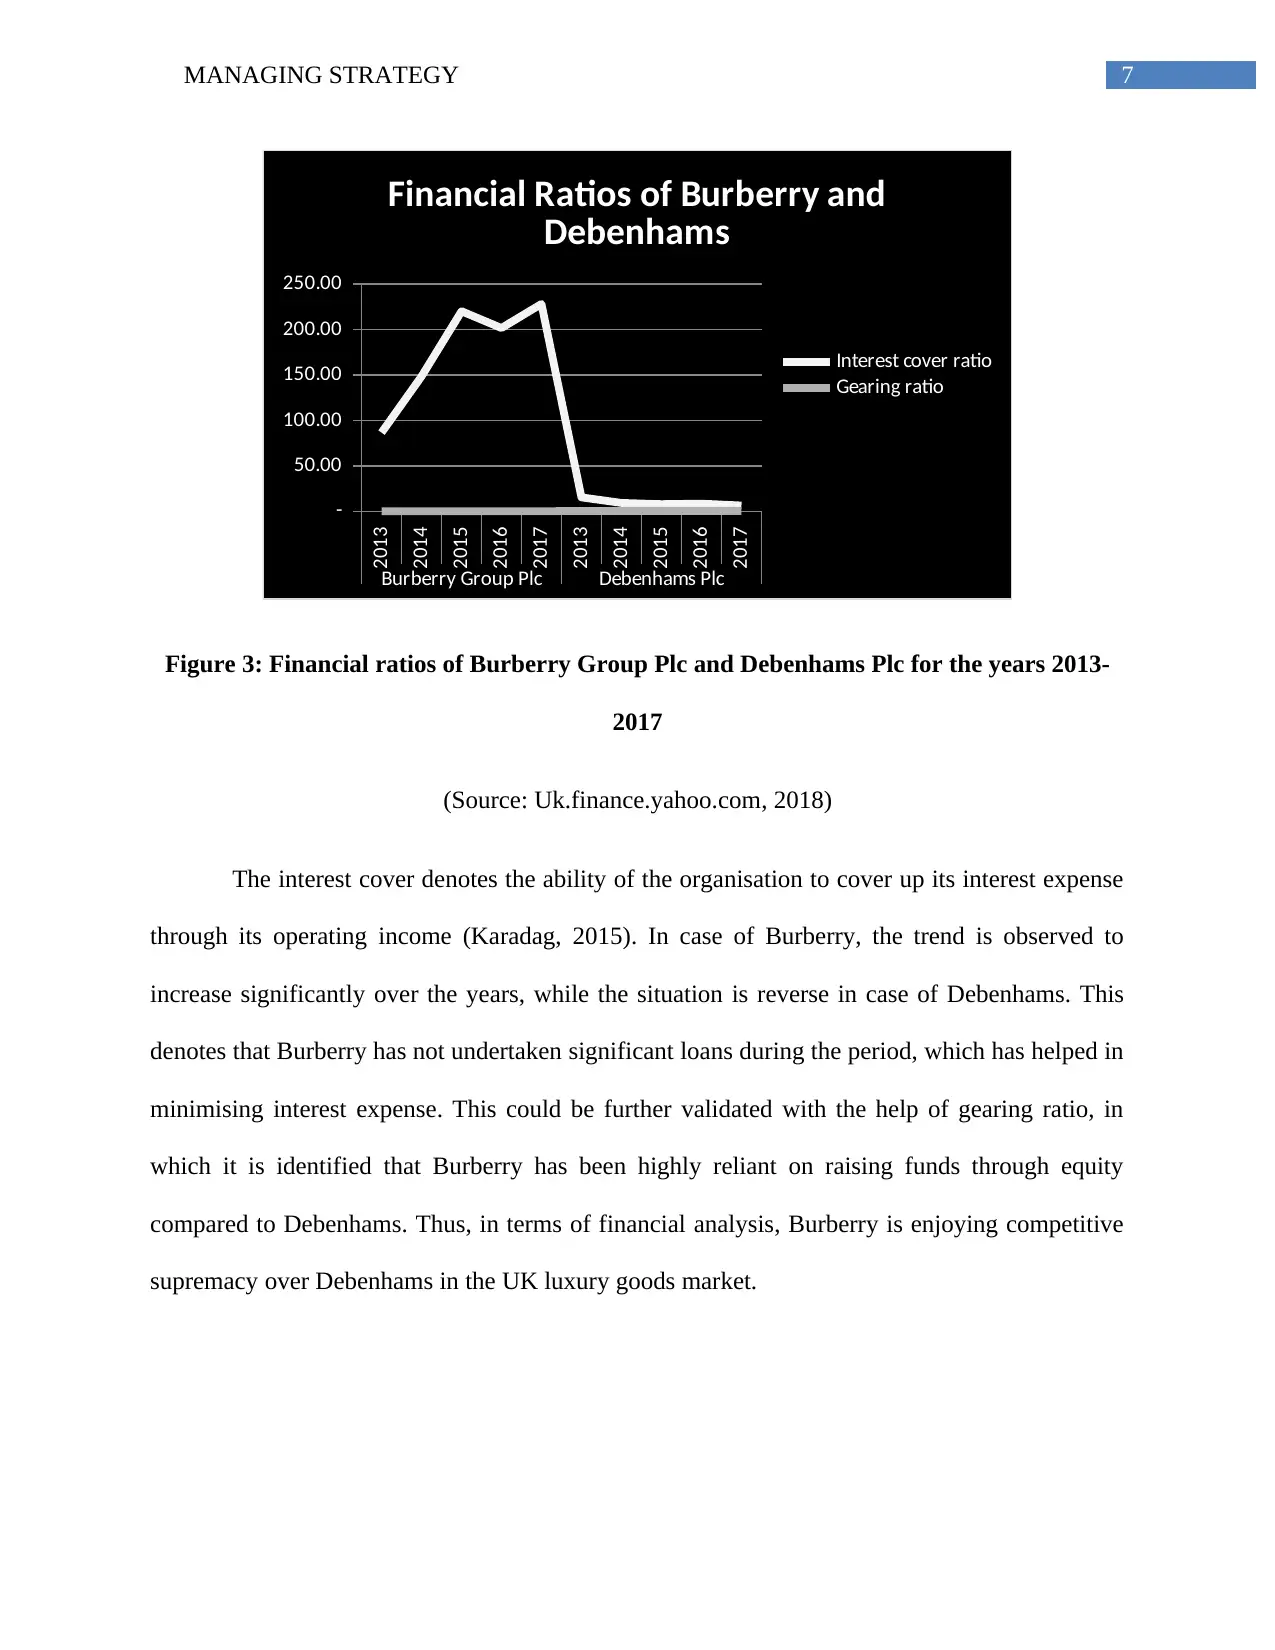
Figure 3: Financial ratios of Burberry Group Plc and Debenhams Plc for the years 2013-
2017
(Source: Uk.finance.yahoo.com, 2018)
The interest cover denotes the ability of the organisation to cover up its interest expense
through its operating income (Karadag, 2015). In case of Burberry, the trend is observed to
increase significantly over the years, while the situation is reverse in case of Debenhams. This
denotes that Burberry has not undertaken significant loans during the period, which has helped in
minimising interest expense. This could be further validated with the help of gearing ratio, in
which it is identified that Burberry has been highly reliant on raising funds through equity
compared to Debenhams. Thus, in terms of financial analysis, Burberry is enjoying competitive
supremacy over Debenhams in the UK luxury goods market.
2013
2014
2015
2016
2017
2013
2014
2015
2016
2017
Burberry Group Plc Debenhams Plc
-
50.00
100.00
150.00
200.00
250.00
Financial Ratios of Burberry and
Debenhams
Interest cover ratio
Gearing ratio
Figure 3: Financial ratios of Burberry Group Plc and Debenhams Plc for the years 2013-
2017
(Source: Uk.finance.yahoo.com, 2018)
The interest cover denotes the ability of the organisation to cover up its interest expense
through its operating income (Karadag, 2015). In case of Burberry, the trend is observed to
increase significantly over the years, while the situation is reverse in case of Debenhams. This
denotes that Burberry has not undertaken significant loans during the period, which has helped in
minimising interest expense. This could be further validated with the help of gearing ratio, in
which it is identified that Burberry has been highly reliant on raising funds through equity
compared to Debenhams. Thus, in terms of financial analysis, Burberry is enjoying competitive
supremacy over Debenhams in the UK luxury goods market.
8MANAGING STRATEGY
2. Strategic position of Burberry:
Based on the above evaluation, it is highly evident that Burberry Plc is maintaining a
better financial position by performing effectively in the fashion industry of UK in contrast to
Debenhams in all the above-stated aspects. It has already been identified that Burberry obtains
huge discounts on bulk orders from its suppliers due to positive brand image in the market and
its debt burden is significantly low, since it has managed to attract additional investors by paying
higher return on investment and dividend. By taking into consideration its positive financial
aspects, Burberry could take into account certain strategic options for increasing its profit margin
and global presence.
2.1 Evaluation of the strategic options available to the organisation:
The strategic options that are available to Burberry comprise of the following and this
could be evaluated with the help of Ansoff matrix and Porter’s generic model:
Strategy 1:
Burberry has history of 156 years and thus, the brand is synonymous with the British
fashion. However, the tough economic times have tightened the belts of UK. The individuals
have started to minimise their spending on luxury and fashion items like trench coats and others
(Osadchy & Akhmetshin, 2015). The biggest problem is that these products are not designed for
daily use. The market for purchasers affording these products is shading, as the purchasers need
to have greater disposable income for purchasing luxury and fashion goods. There have been
additions in the product lines, which have gained immense popularity among the younger crowd.
The organisation has announced its new market strategy, which is targeting men. In
addition, it is planning to diversify its market base for sustaining in the competitive economy.
⊘ This is a preview!⊘
Do you want full access?
Subscribe today to unlock all pages.
Trusted by 1+ million students worldwide
9MANAGING STRATEGY
The problem with this approach is that it does not fit the culture of Burberry. Even though men
are leaning towards buying fashion products, the demand is yet to reach its peak in the UK
market. Hence, this would be an investment in production that might prove costly for Burberry in
the long-run. If the intention is to increase business growth, it needs to avoid investing additional
capital in production and new operations.
Strategy 2:
Another strategic option that is available to Burberry Group Plc is the three-year
prolonged plan of including additional leather products and newness to its collections along with
narrowing distribution by scaling back the lower-end wholesale partnerships. In addition, the
plan of the organisation includes the refurbishment of stores and using its goodwill in the form of
digital innovator for better communication of product offering transformation as well. The
primary objective behind this plan is to compete with the top European brands, in which greater
prices, wider margins and stable growth could be observed (Strangmueller, 2017).
This strategic option could be viable for the organisation, as it has a strong reputation in
the market for selling quality products to the customers. However, it is to be borne in mind that
Burberry charges premium prices from its customers in order to cover up the cost incurred in
production and distribution facilities. In fact, it charges greater prices from its customers and
hence, it could be said that the organisation does not follow competitive pricing strategy. This is
evident from the lower cost of sales identified in the above section, which is that it obtains
adequate discounts from its suppliers for placing bulk orders and strong reputation in the market.
If the same pricing structure is maintained in the foreign markets, it could suffer losses due to the
presence of a large number of competitors providing similar kinds of products at cheaper prices.
Paraphrase This Document
Need a fresh take? Get an instant paraphrase of this document with our AI Paraphraser
10MANAGING STRATEGY
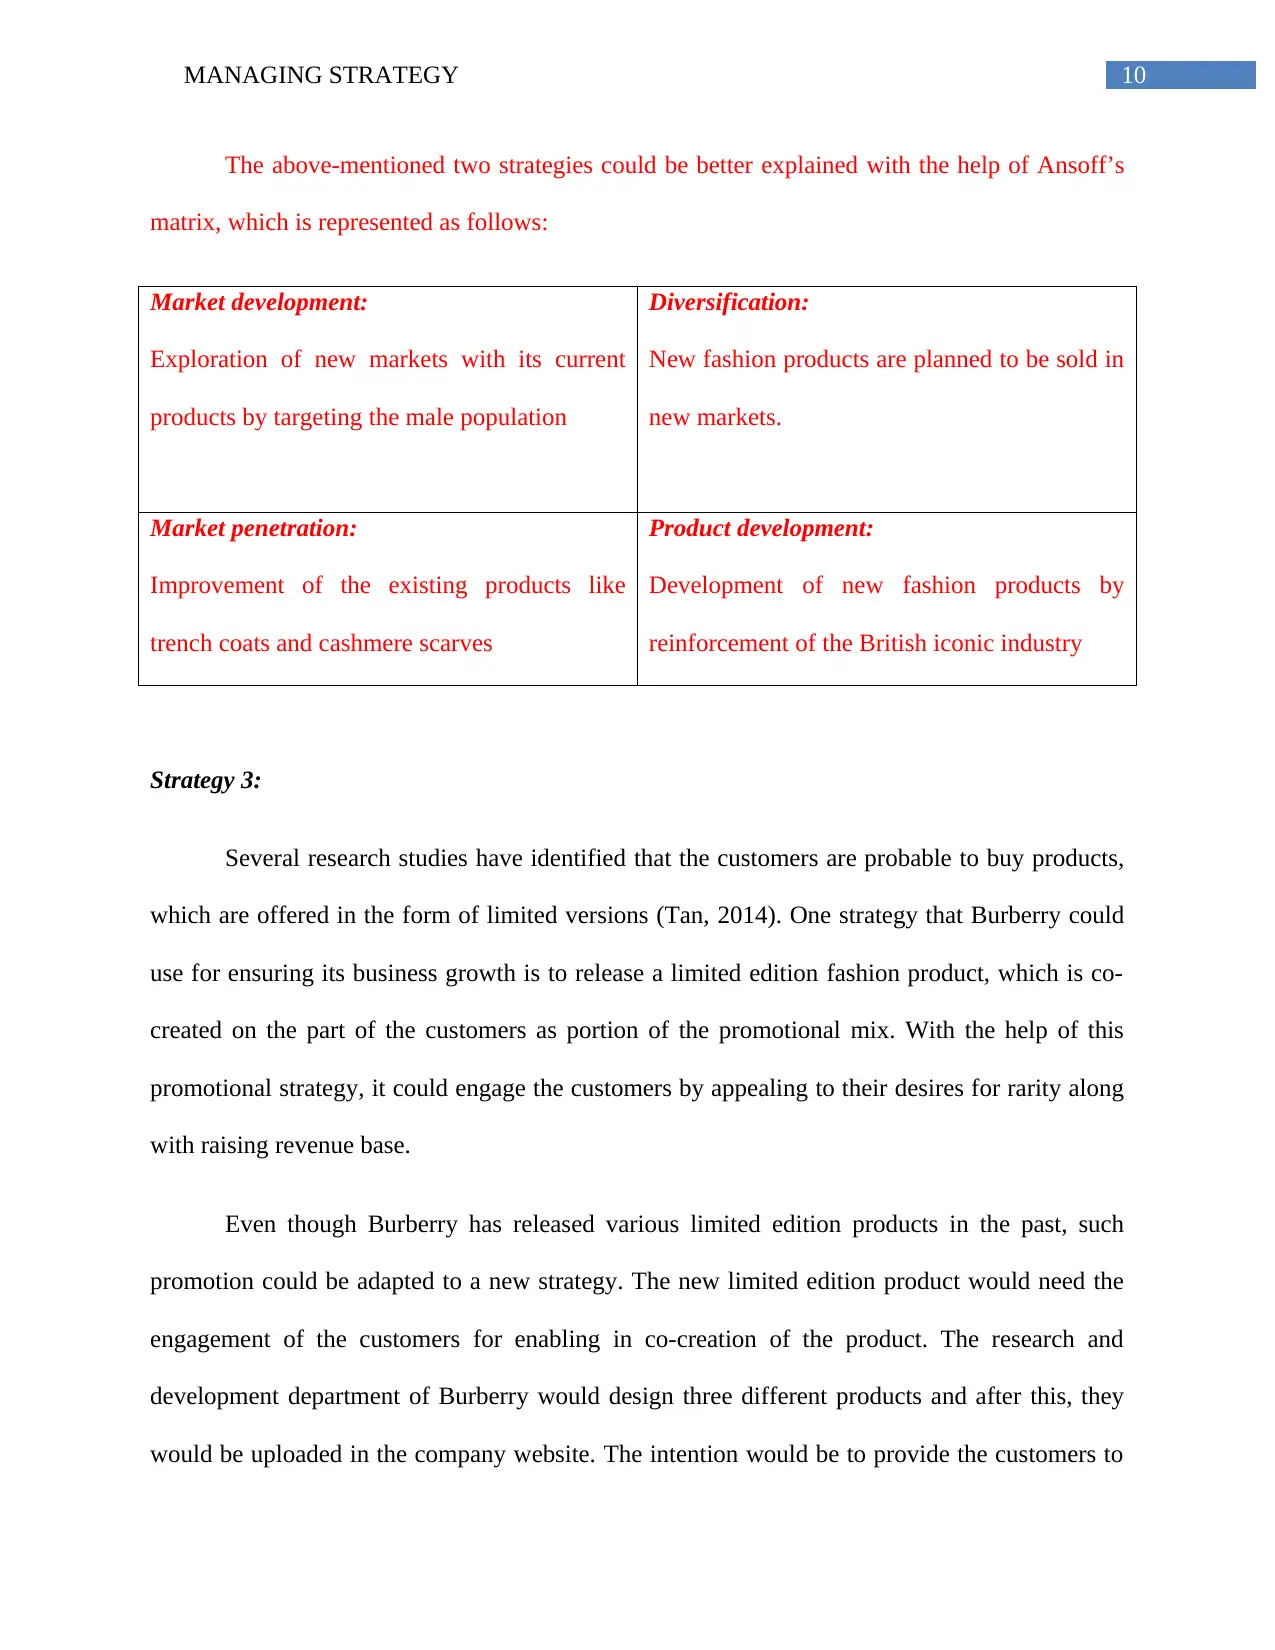
The above-mentioned two strategies could be better explained with the help of Ansoff’s
matrix, which is represented as follows:
Market development:
Exploration of new markets with its current
products by targeting the male population
Diversification:
New fashion products are planned to be sold in
new markets.
Market penetration:
Improvement of the existing products like
trench coats and cashmere scarves
Product development:
Development of new fashion products by
reinforcement of the British iconic industry
Strategy 3:
Several research studies have identified that the customers are probable to buy products,
which are offered in the form of limited versions (Tan, 2014). One strategy that Burberry could
use for ensuring its business growth is to release a limited edition fashion product, which is co-
created on the part of the customers as portion of the promotional mix. With the help of this
promotional strategy, it could engage the customers by appealing to their desires for rarity along
with raising revenue base.
Even though Burberry has released various limited edition products in the past, such
promotion could be adapted to a new strategy. The new limited edition product would need the
engagement of the customers for enabling in co-creation of the product. The research and
development department of Burberry would design three different products and after this, they
would be uploaded in the company website. The intention would be to provide the customers to
11MANAGING STRATEGY
log in and accordingly, they could vote for their favourite product. The most voted product
would be included in limited production. The customers that have voted need to have the initial
priority for purchasing the product. Accordingly, the customers could be provided a discount of
10% to 20% on the purchase.
This strategy would not be expensive and it would be highly effective for the organisation
as well (Teirlinck & Spithoven, 2015). The designers need to design the products in a manner for
reusing various existing parts as possible, while unique style needs to be developed as well. This
process of design would help in further minimisation of the cost of production for the limited
edition product.
Strategy 4:
It has been identified that the sales revenue of Burberry has increased from £2,515
million in 2016 to £2,766 million in 2017. The sales at stores open for a minimum of a year have
been up to 4%. The organisation would be firmly in the luxury segment and it has all the
foundations and team to execute its strategic plans. With the increasing volume of foreign
operations along with capital investments and relationships with the cross-border suppliers, it
could invest its additional cash for entering into relationships with strategic partners in Europe.
However, as the value of pound appreciates in the market, it could earn additional profit from the
sales generated in the European nations (Theriou, 2015). However, such partnership could
minimise the working capital availability for Burberry and hence, it might have negative impact
on the liquidity position in the short-run initially. On the other hand, if the organisation does not
maintain competitive pricing strategy in the EU, it might have adverse impact on the solvency
position as well (Zábojníková, 2016).
⊘ This is a preview!⊘
Do you want full access?
Subscribe today to unlock all pages.
Trusted by 1+ million students worldwide
1 out of 20
Related Documents


Your All-in-One AI-Powered Toolkit for Academic Success.
+13062052269
info@desklib.com
Available 24*7 on WhatsApp / Email
![[object Object]](/_next/static/media/star-bottom.7253800d.svg)
Unlock your academic potential
Copyright © 2020–2025 A2Z Services. All Rights Reserved. Developed and managed by ZUCOL.