Bureau of Justice Statistics Report 2022
VerifiedAdded on 2022/09/18
|8
|1165
|28
AI Summary
Contribute Materials
Your contribution can guide someone’s learning journey. Share your
documents today.
Running head: BUREAU OF JUSTICE STATISTICS
Bureau of Justice Statistics
Name of the university
Name of student
Bureau of Justice Statistics
Name of the university
Name of student
Secure Best Marks with AI Grader
Need help grading? Try our AI Grader for instant feedback on your assignments.
1References:References:
BUREAU OF JUSTICE STATISTICS
Table of Contents
Introduction:...............................................................................................................................2
Table 1:.......................................................................................................................................2
Table 2:.......................................................................................................................................3
Table 3:.......................................................................................................................................4
Visualizing data:.........................................................................................................................5
References:.................................................................................................................................7
2References:References:
BUREAU OF JUSTICE STATISTICS
Introduction:
Bureau of Justice Statistics, is a part of US Department of Justice that collects data
relating to crime in the United States. There are roughly fifty thousand agencies that
contribute towards the collection of data (Rosay,2016). The aims of the bureau is to collect
the relevant data and analyse it to help policy makers in combating crime. In this report, the
tribal crime data is collected and presented in a report. The report studies work undertaken by
the Bureau of Justice Statistics to improve the collection of data on crime and justice related
programs on 2018 and 2019, the participation of tribal groups in national record keeping and
the records of Alaska Natives and American Indians in the federal justice system (Perry,
2013).
The report was made taking into account the Tribal Law and Order Act of 2010 to collect
the relevant data and enhance the tribal crime data collection system. The TLOA requires
BJS to conduct these activities to
1. Establish a tribal crime database
2. Bring Indian tribes into the data collection process
3. Provide an annual report to congress regarding the work done
Several works were undertaken by the Bureau of Justice Statistics in the relevant context
and the results are briefly discussed in this report. In the fiscal year, 2018 the BJS conducted
cognitive testing of the tribal law enforcement agencies and posted the results in Federal
Register for public comment. Three grants worth $ 621,600 were awarded to the tribes in
order to improve their criminal database. Statistics were calculated and it was found that, in
2016, 3189 American Indians and Alaska Natives were arrested by federal law enforcement
agencies. 1790 were admitted to federal prison and 1839 were released (The Bureau Of
Justice Statistics,2019)
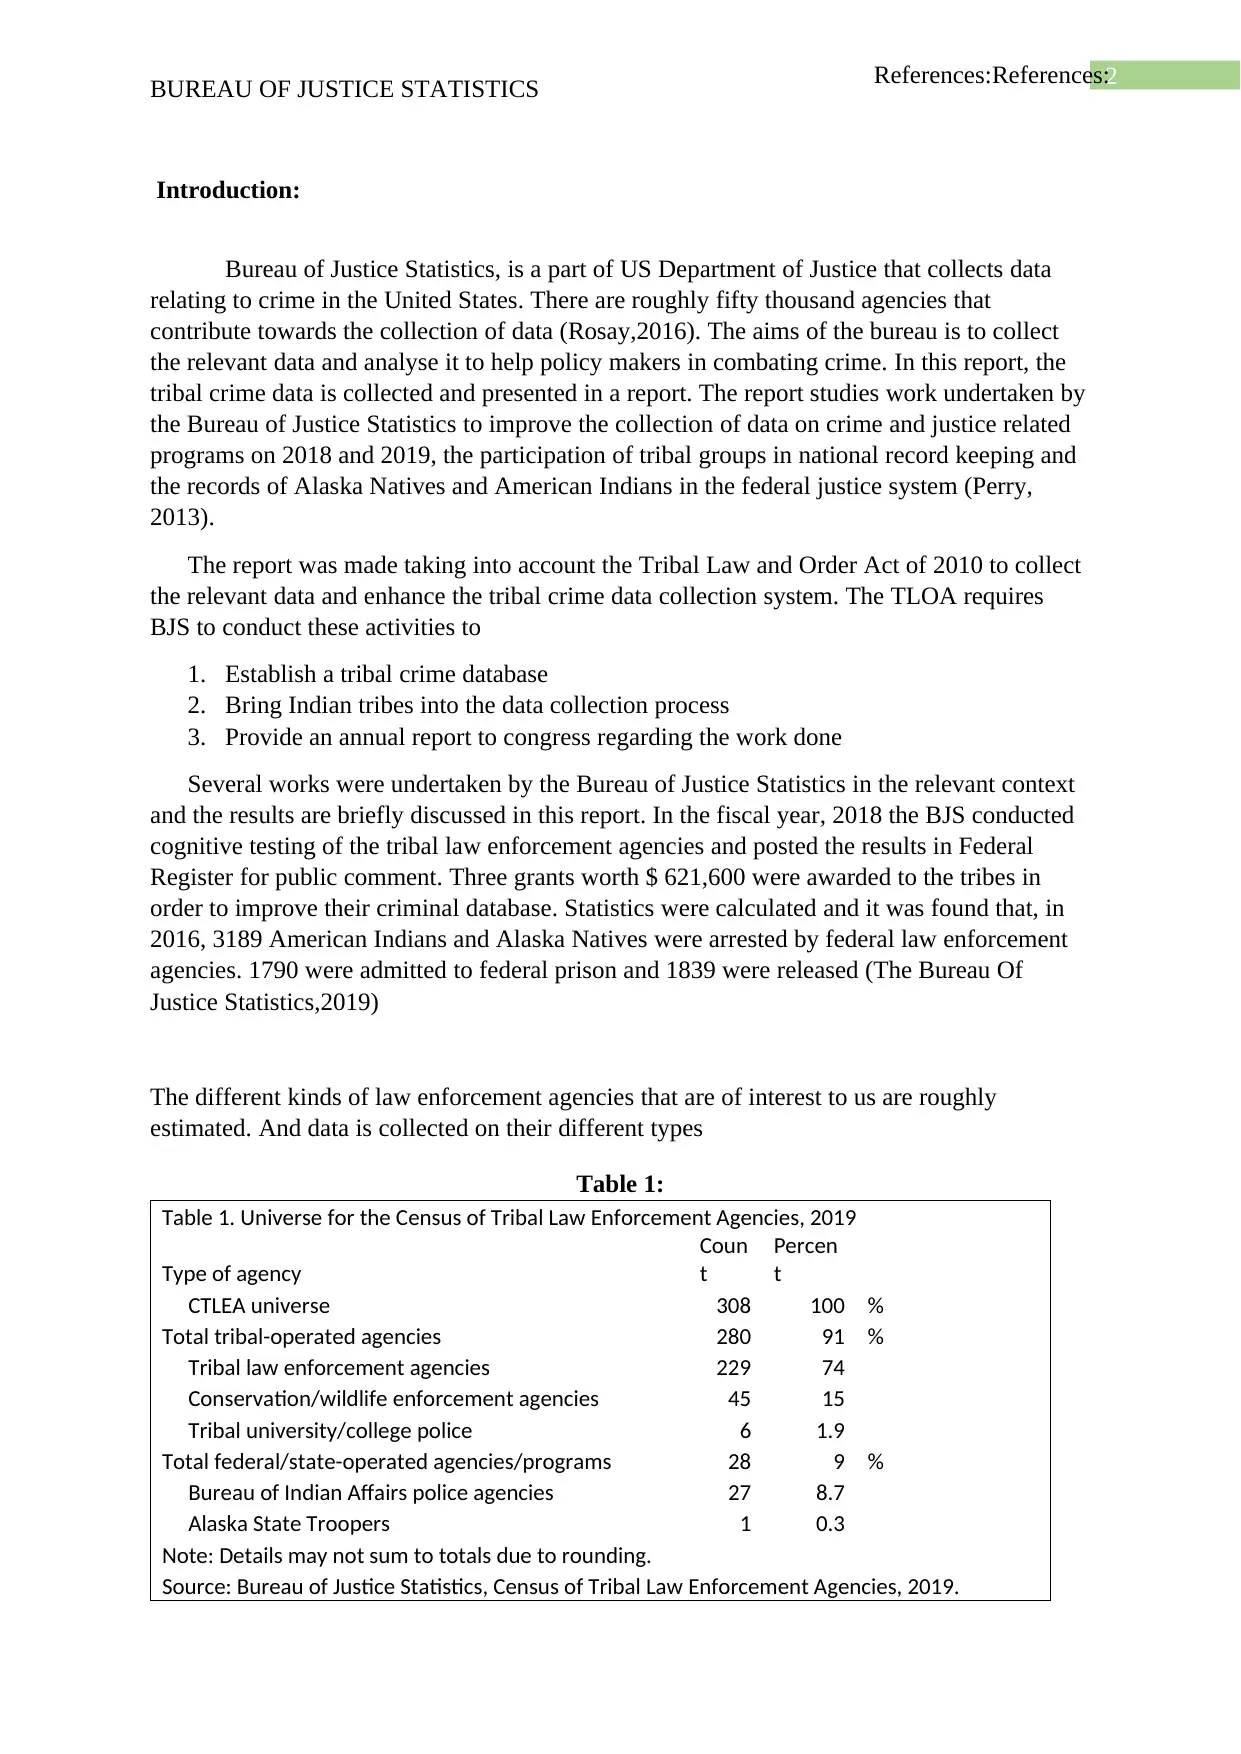
The different kinds of law enforcement agencies that are of interest to us are roughly
estimated. And data is collected on their different types
Table 1:
Table 1. Universe for the Census of Tribal Law Enforcement Agencies, 2019
Type of agency
Coun
t
Percen
t
CTLEA universe 308 100 %
Total tribal-operated agencies 280 91 %
Tribal law enforcement agencies 229 74
Conservation/wildlife enforcement agencies 45 15
Tribal university/college police 6 1.9
Total federal/state-operated agencies/programs 28 9 %
Bureau of Indian Affairs police agencies 27 8.7
Alaska State Troopers 1 0.3
Note: Details may not sum to totals due to rounding.
Source: Bureau of Justice Statistics, Census of Tribal Law Enforcement Agencies, 2019.
BUREAU OF JUSTICE STATISTICS
Introduction:
Bureau of Justice Statistics, is a part of US Department of Justice that collects data
relating to crime in the United States. There are roughly fifty thousand agencies that
contribute towards the collection of data (Rosay,2016). The aims of the bureau is to collect
the relevant data and analyse it to help policy makers in combating crime. In this report, the
tribal crime data is collected and presented in a report. The report studies work undertaken by
the Bureau of Justice Statistics to improve the collection of data on crime and justice related
programs on 2018 and 2019, the participation of tribal groups in national record keeping and
the records of Alaska Natives and American Indians in the federal justice system (Perry,
2013).
The report was made taking into account the Tribal Law and Order Act of 2010 to collect
the relevant data and enhance the tribal crime data collection system. The TLOA requires
BJS to conduct these activities to
1. Establish a tribal crime database
2. Bring Indian tribes into the data collection process
3. Provide an annual report to congress regarding the work done
Several works were undertaken by the Bureau of Justice Statistics in the relevant context
and the results are briefly discussed in this report. In the fiscal year, 2018 the BJS conducted
cognitive testing of the tribal law enforcement agencies and posted the results in Federal
Register for public comment. Three grants worth $ 621,600 were awarded to the tribes in
order to improve their criminal database. Statistics were calculated and it was found that, in
2016, 3189 American Indians and Alaska Natives were arrested by federal law enforcement
agencies. 1790 were admitted to federal prison and 1839 were released (The Bureau Of
Justice Statistics,2019)
The different kinds of law enforcement agencies that are of interest to us are roughly
estimated. And data is collected on their different types
Table 1:
Table 1. Universe for the Census of Tribal Law Enforcement Agencies, 2019
Type of agency
Coun
t
Percen
t
CTLEA universe 308 100 %
Total tribal-operated agencies 280 91 %
Tribal law enforcement agencies 229 74
Conservation/wildlife enforcement agencies 45 15
Tribal university/college police 6 1.9
Total federal/state-operated agencies/programs 28 9 %
Bureau of Indian Affairs police agencies 27 8.7
Alaska State Troopers 1 0.3
Note: Details may not sum to totals due to rounding.
Source: Bureau of Justice Statistics, Census of Tribal Law Enforcement Agencies, 2019.
3References:References:
BUREAU OF JUSTICE STATISTICS
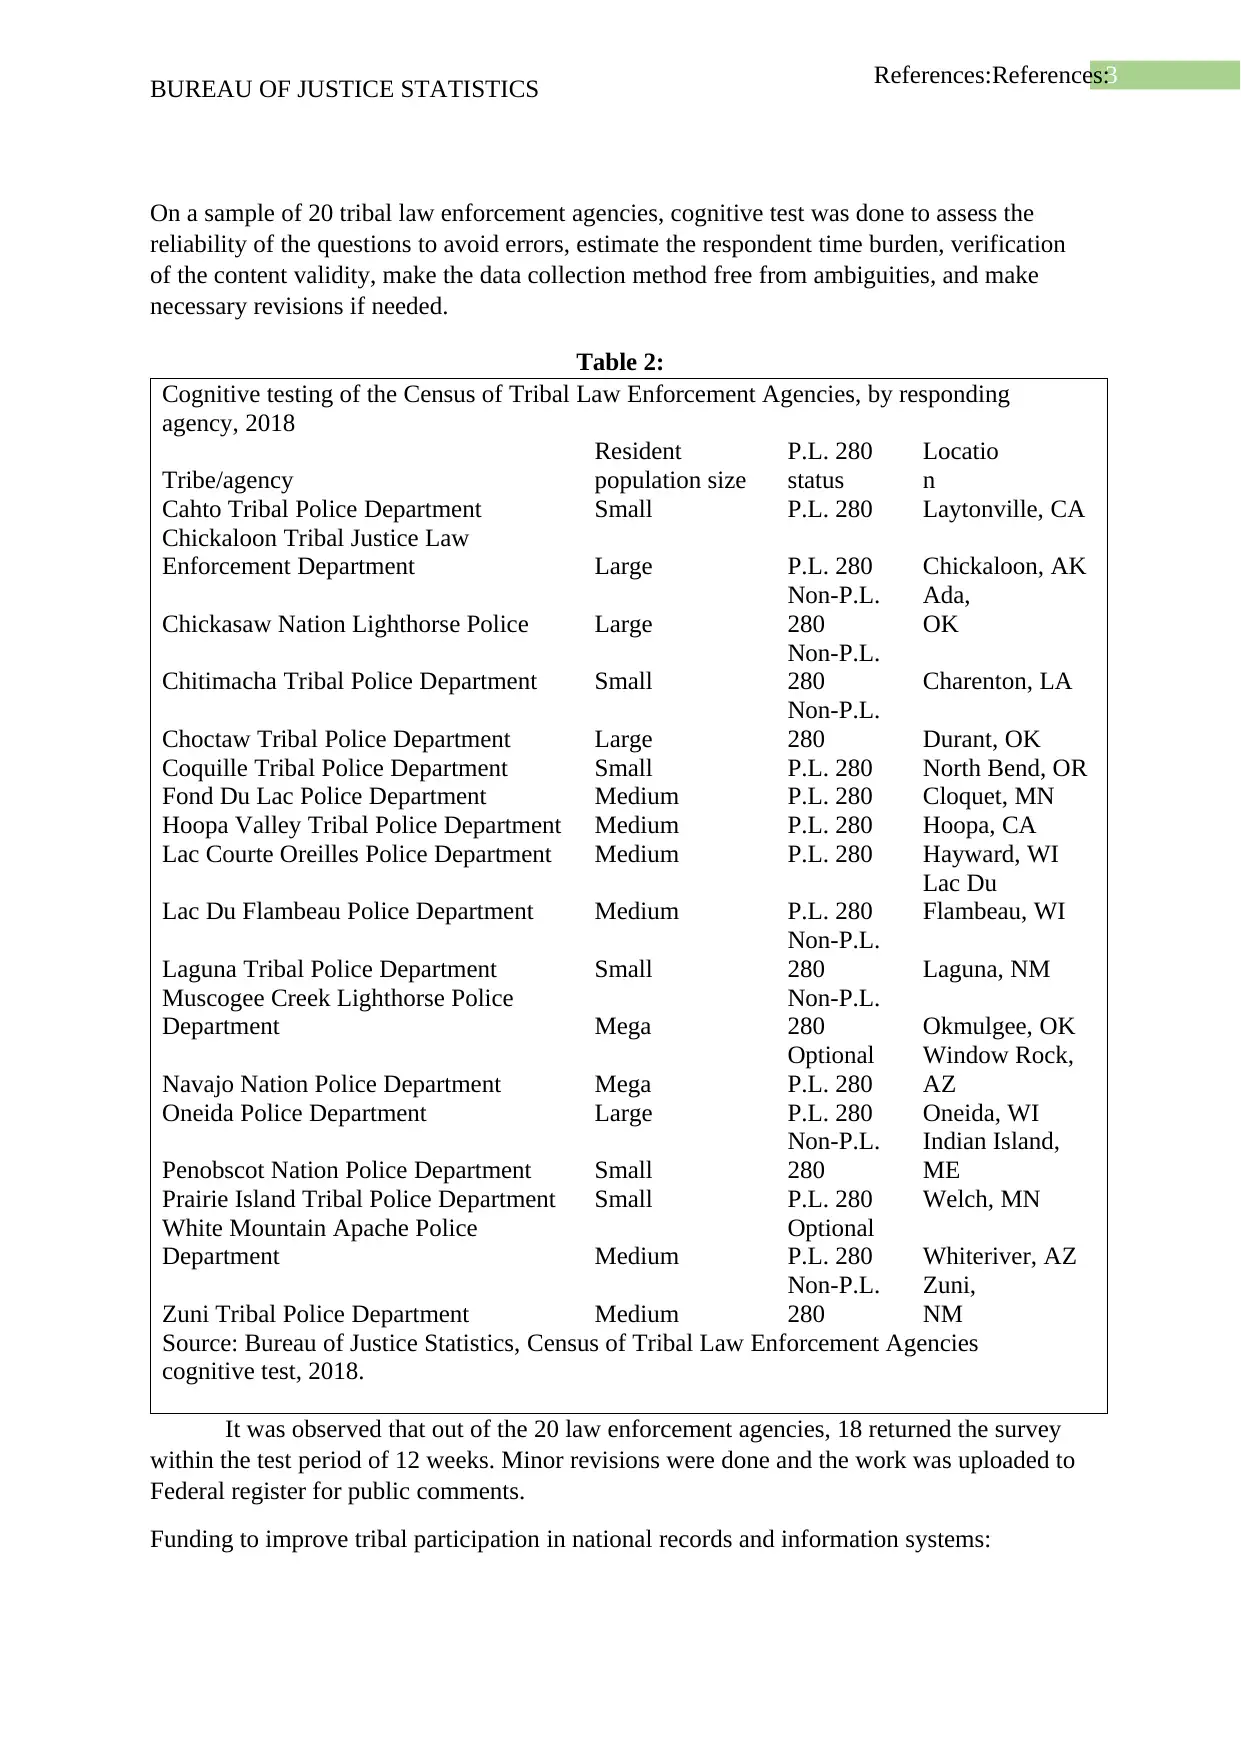
On a sample of 20 tribal law enforcement agencies, cognitive test was done to assess the
reliability of the questions to avoid errors, estimate the respondent time burden, verification
of the content validity, make the data collection method free from ambiguities, and make
necessary revisions if needed.
Table 2:
Cognitive testing of the Census of Tribal Law Enforcement Agencies, by responding
agency, 2018
Tribe/agency
Resident
population size
P.L. 280
status
Locatio
n
Cahto Tribal Police Department Small P.L. 280 Laytonville, CA
Chickaloon Tribal Justice Law
Enforcement Department Large P.L. 280 Chickaloon, AK
Chickasaw Nation Lighthorse Police Large
Non-P.L.
280
Ada,
OK
Chitimacha Tribal Police Department Small
Non-P.L.
280 Charenton, LA
Choctaw Tribal Police Department Large
Non-P.L.
280 Durant, OK
Coquille Tribal Police Department Small P.L. 280 North Bend, OR
Fond Du Lac Police Department Medium P.L. 280 Cloquet, MN
Hoopa Valley Tribal Police Department Medium P.L. 280 Hoopa, CA
Lac Courte Oreilles Police Department Medium P.L. 280 Hayward, WI
Lac Du Flambeau Police Department Medium P.L. 280
Lac Du
Flambeau, WI
Laguna Tribal Police Department Small
Non-P.L.
280 Laguna, NM
Muscogee Creek Lighthorse Police
Department Mega
Non-P.L.
280 Okmulgee, OK
Navajo Nation Police Department Mega
Optional
P.L. 280
Window Rock,
AZ
Oneida Police Department Large P.L. 280 Oneida, WI
Penobscot Nation Police Department Small
Non-P.L.
280
Indian Island,
ME
Prairie Island Tribal Police Department Small P.L. 280 Welch, MN
White Mountain Apache Police
Department Medium
Optional
P.L. 280 Whiteriver, AZ
Zuni Tribal Police Department Medium
Non-P.L.
280
Zuni,
NM
Source: Bureau of Justice Statistics, Census of Tribal Law Enforcement Agencies
cognitive test, 2018.
It was observed that out of the 20 law enforcement agencies, 18 returned the survey
within the test period of 12 weeks. Minor revisions were done and the work was uploaded to
Federal register for public comments.
Funding to improve tribal participation in national records and information systems:
BUREAU OF JUSTICE STATISTICS
On a sample of 20 tribal law enforcement agencies, cognitive test was done to assess the
reliability of the questions to avoid errors, estimate the respondent time burden, verification
of the content validity, make the data collection method free from ambiguities, and make
necessary revisions if needed.
Table 2:
Cognitive testing of the Census of Tribal Law Enforcement Agencies, by responding
agency, 2018
Tribe/agency
Resident
population size
P.L. 280
status
Locatio
n
Cahto Tribal Police Department Small P.L. 280 Laytonville, CA
Chickaloon Tribal Justice Law
Enforcement Department Large P.L. 280 Chickaloon, AK
Chickasaw Nation Lighthorse Police Large
Non-P.L.
280
Ada,
OK
Chitimacha Tribal Police Department Small
Non-P.L.
280 Charenton, LA
Choctaw Tribal Police Department Large
Non-P.L.
280 Durant, OK
Coquille Tribal Police Department Small P.L. 280 North Bend, OR
Fond Du Lac Police Department Medium P.L. 280 Cloquet, MN
Hoopa Valley Tribal Police Department Medium P.L. 280 Hoopa, CA
Lac Courte Oreilles Police Department Medium P.L. 280 Hayward, WI
Lac Du Flambeau Police Department Medium P.L. 280
Lac Du
Flambeau, WI
Laguna Tribal Police Department Small
Non-P.L.
280 Laguna, NM
Muscogee Creek Lighthorse Police
Department Mega
Non-P.L.
280 Okmulgee, OK
Navajo Nation Police Department Mega
Optional
P.L. 280
Window Rock,
AZ
Oneida Police Department Large P.L. 280 Oneida, WI
Penobscot Nation Police Department Small
Non-P.L.
280
Indian Island,
ME
Prairie Island Tribal Police Department Small P.L. 280 Welch, MN
White Mountain Apache Police
Department Medium
Optional
P.L. 280 Whiteriver, AZ
Zuni Tribal Police Department Medium
Non-P.L.
280
Zuni,
NM
Source: Bureau of Justice Statistics, Census of Tribal Law Enforcement Agencies
cognitive test, 2018.
It was observed that out of the 20 law enforcement agencies, 18 returned the survey
within the test period of 12 weeks. Minor revisions were done and the work was uploaded to
Federal register for public comments.
Funding to improve tribal participation in national records and information systems:
Secure Best Marks with AI Grader
Need help grading? Try our AI Grader for instant feedback on your assignments.
4References:References:
BUREAU OF JUSTICE STATISTICS
Table 3:
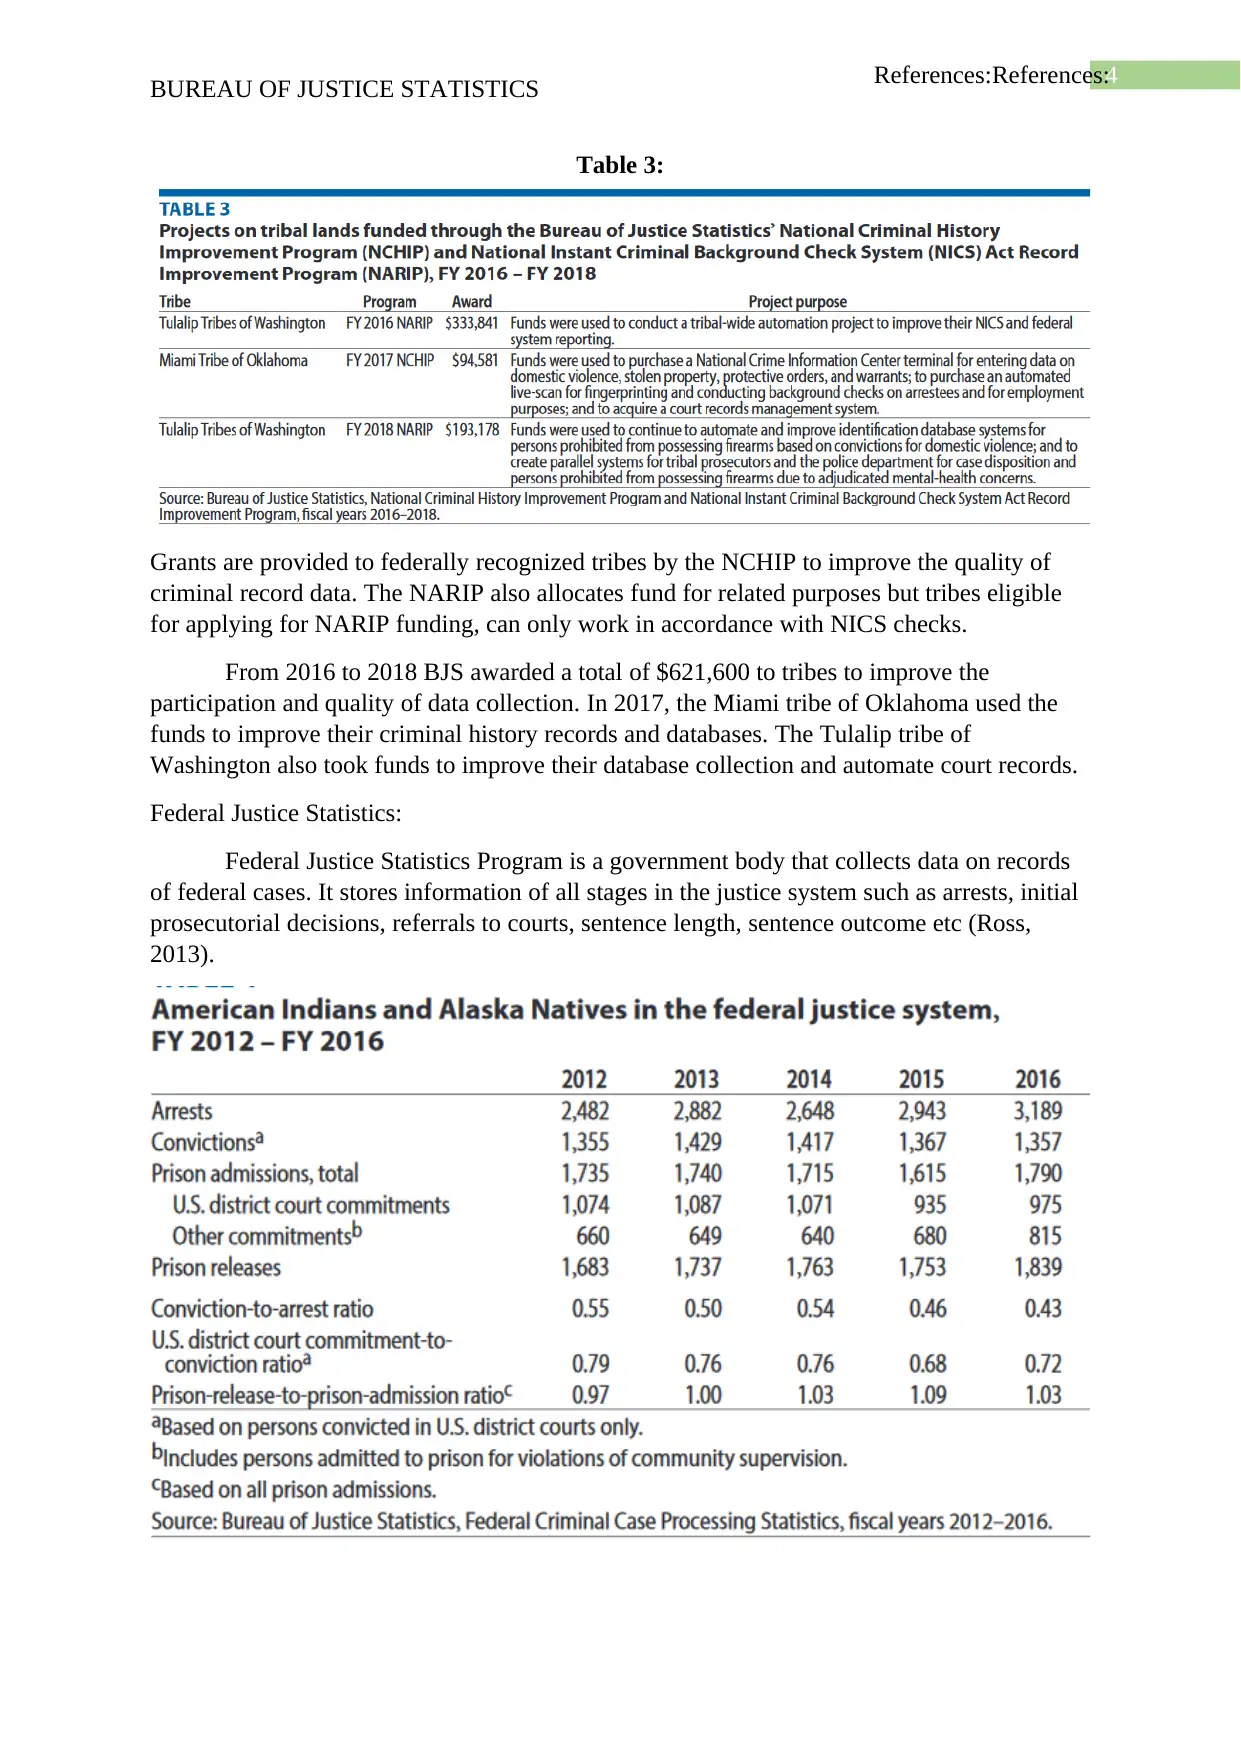
Grants are provided to federally recognized tribes by the NCHIP to improve the quality of
criminal record data. The NARIP also allocates fund for related purposes but tribes eligible
for applying for NARIP funding, can only work in accordance with NICS checks.
From 2016 to 2018 BJS awarded a total of $621,600 to tribes to improve the
participation and quality of data collection. In 2017, the Miami tribe of Oklahoma used the
funds to improve their criminal history records and databases. The Tulalip tribe of
Washington also took funds to improve their database collection and automate court records.
Federal Justice Statistics:
Federal Justice Statistics Program is a government body that collects data on records
of federal cases. It stores information of all stages in the justice system such as arrests, initial
prosecutorial decisions, referrals to courts, sentence length, sentence outcome etc (Ross,
2013).
BUREAU OF JUSTICE STATISTICS
Table 3:
Grants are provided to federally recognized tribes by the NCHIP to improve the quality of
criminal record data. The NARIP also allocates fund for related purposes but tribes eligible
for applying for NARIP funding, can only work in accordance with NICS checks.
From 2016 to 2018 BJS awarded a total of $621,600 to tribes to improve the
participation and quality of data collection. In 2017, the Miami tribe of Oklahoma used the
funds to improve their criminal history records and databases. The Tulalip tribe of
Washington also took funds to improve their database collection and automate court records.
Federal Justice Statistics:
Federal Justice Statistics Program is a government body that collects data on records
of federal cases. It stores information of all stages in the justice system such as arrests, initial
prosecutorial decisions, referrals to courts, sentence length, sentence outcome etc (Ross,
2013).
5References:References:
BUREAU OF JUSTICE STATISTICS
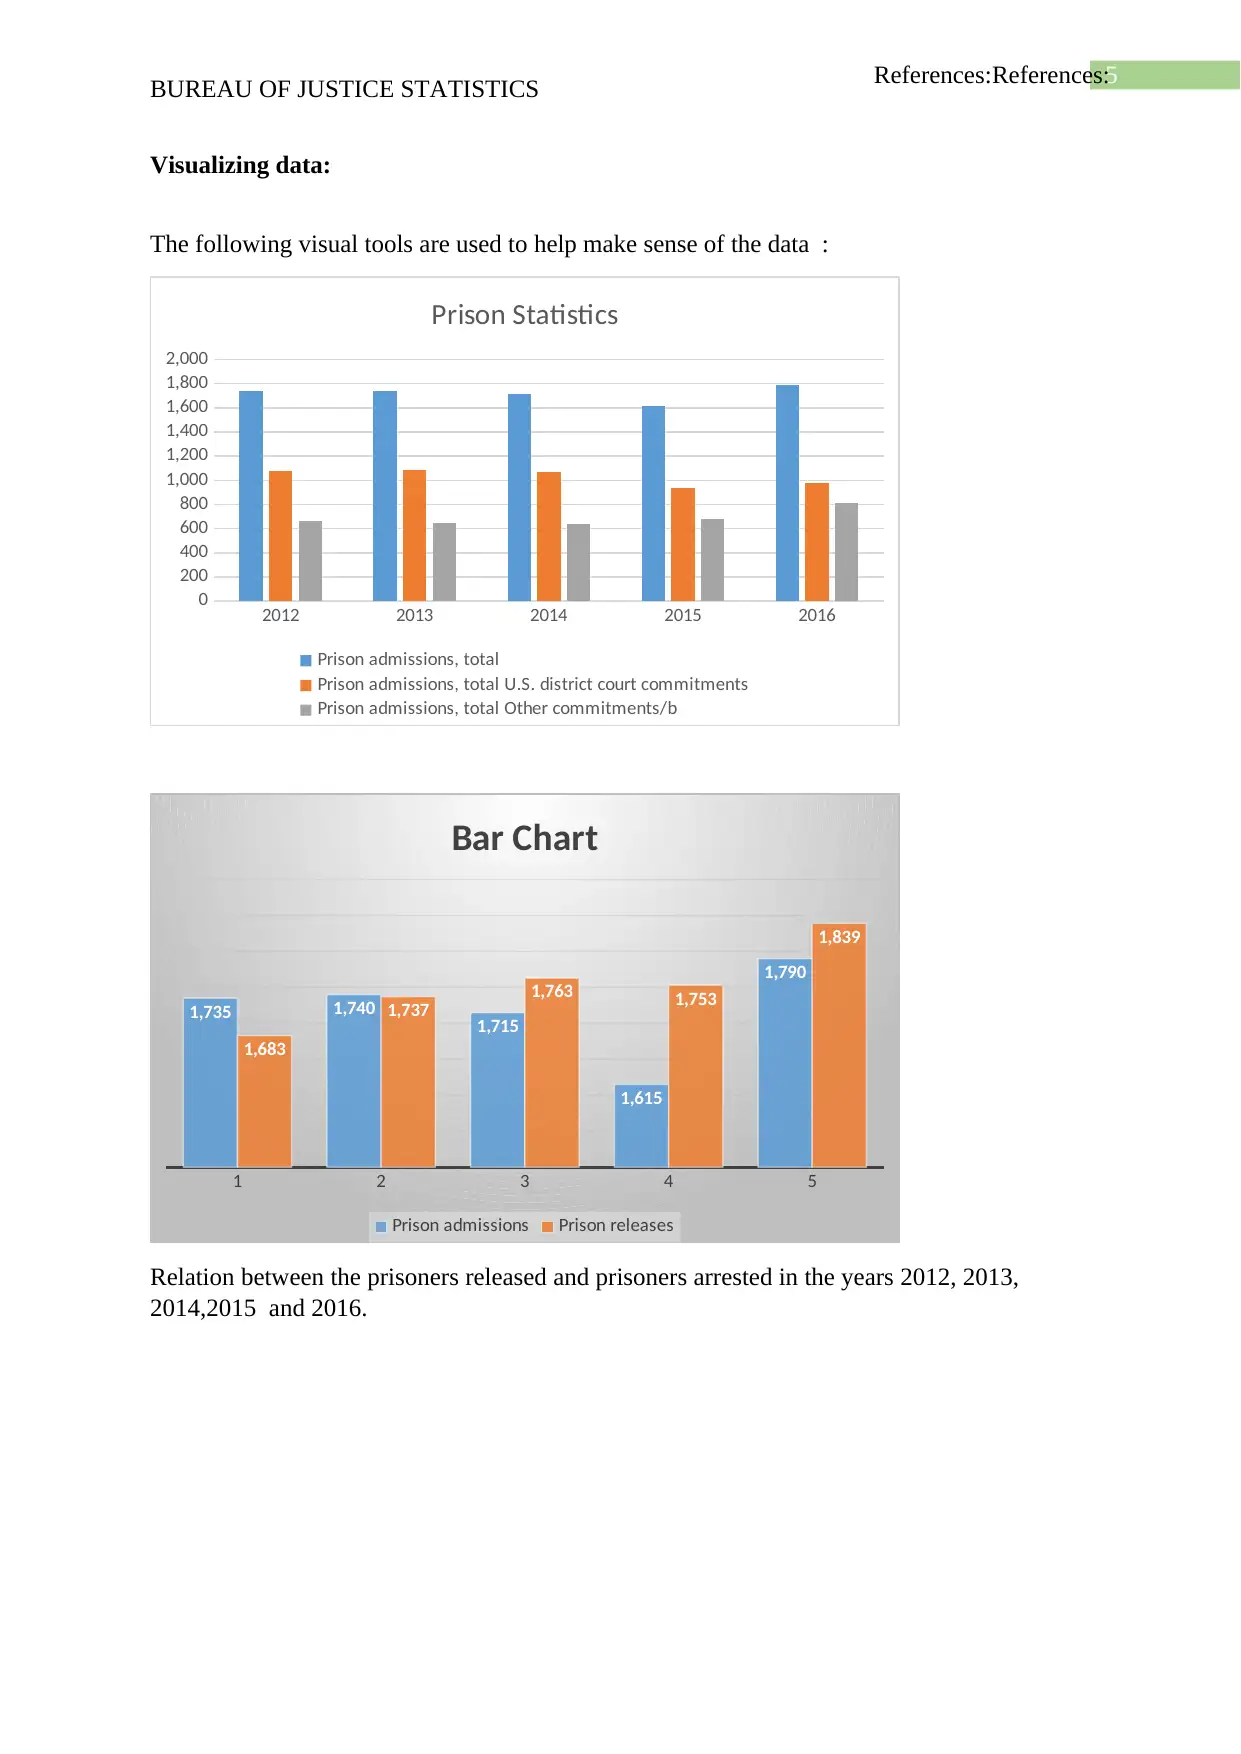
Visualizing data:
The following visual tools are used to help make sense of the data :
2012 2013 2014 2015 2016
0
200
400
600
800
1,000
1,200
1,400
1,600
1,800
2,000
Prison Statistics
Prison admissions, total
Prison admissions, total U.S. district court commitments
Prison admissions, total Other commitments/b
1 2 3 4 5
1,735 1,740 1,715
1,615
1,790
1,683
1,737 1,763 1,753
1,839
Bar Chart
Prison admissions Prison releases
Relation between the prisoners released and prisoners arrested in the years 2012, 2013,
2014,2015 and 2016.
BUREAU OF JUSTICE STATISTICS
Visualizing data:
The following visual tools are used to help make sense of the data :
2012 2013 2014 2015 2016
0
200
400
600
800
1,000
1,200
1,400
1,600
1,800
2,000
Prison Statistics
Prison admissions, total
Prison admissions, total U.S. district court commitments
Prison admissions, total Other commitments/b
1 2 3 4 5
1,735 1,740 1,715
1,615
1,790
1,683
1,737 1,763 1,753
1,839
Bar Chart
Prison admissions Prison releases
Relation between the prisoners released and prisoners arrested in the years 2012, 2013,
2014,2015 and 2016.
6References:References:
BUREAU OF JUSTICE STATISTICS
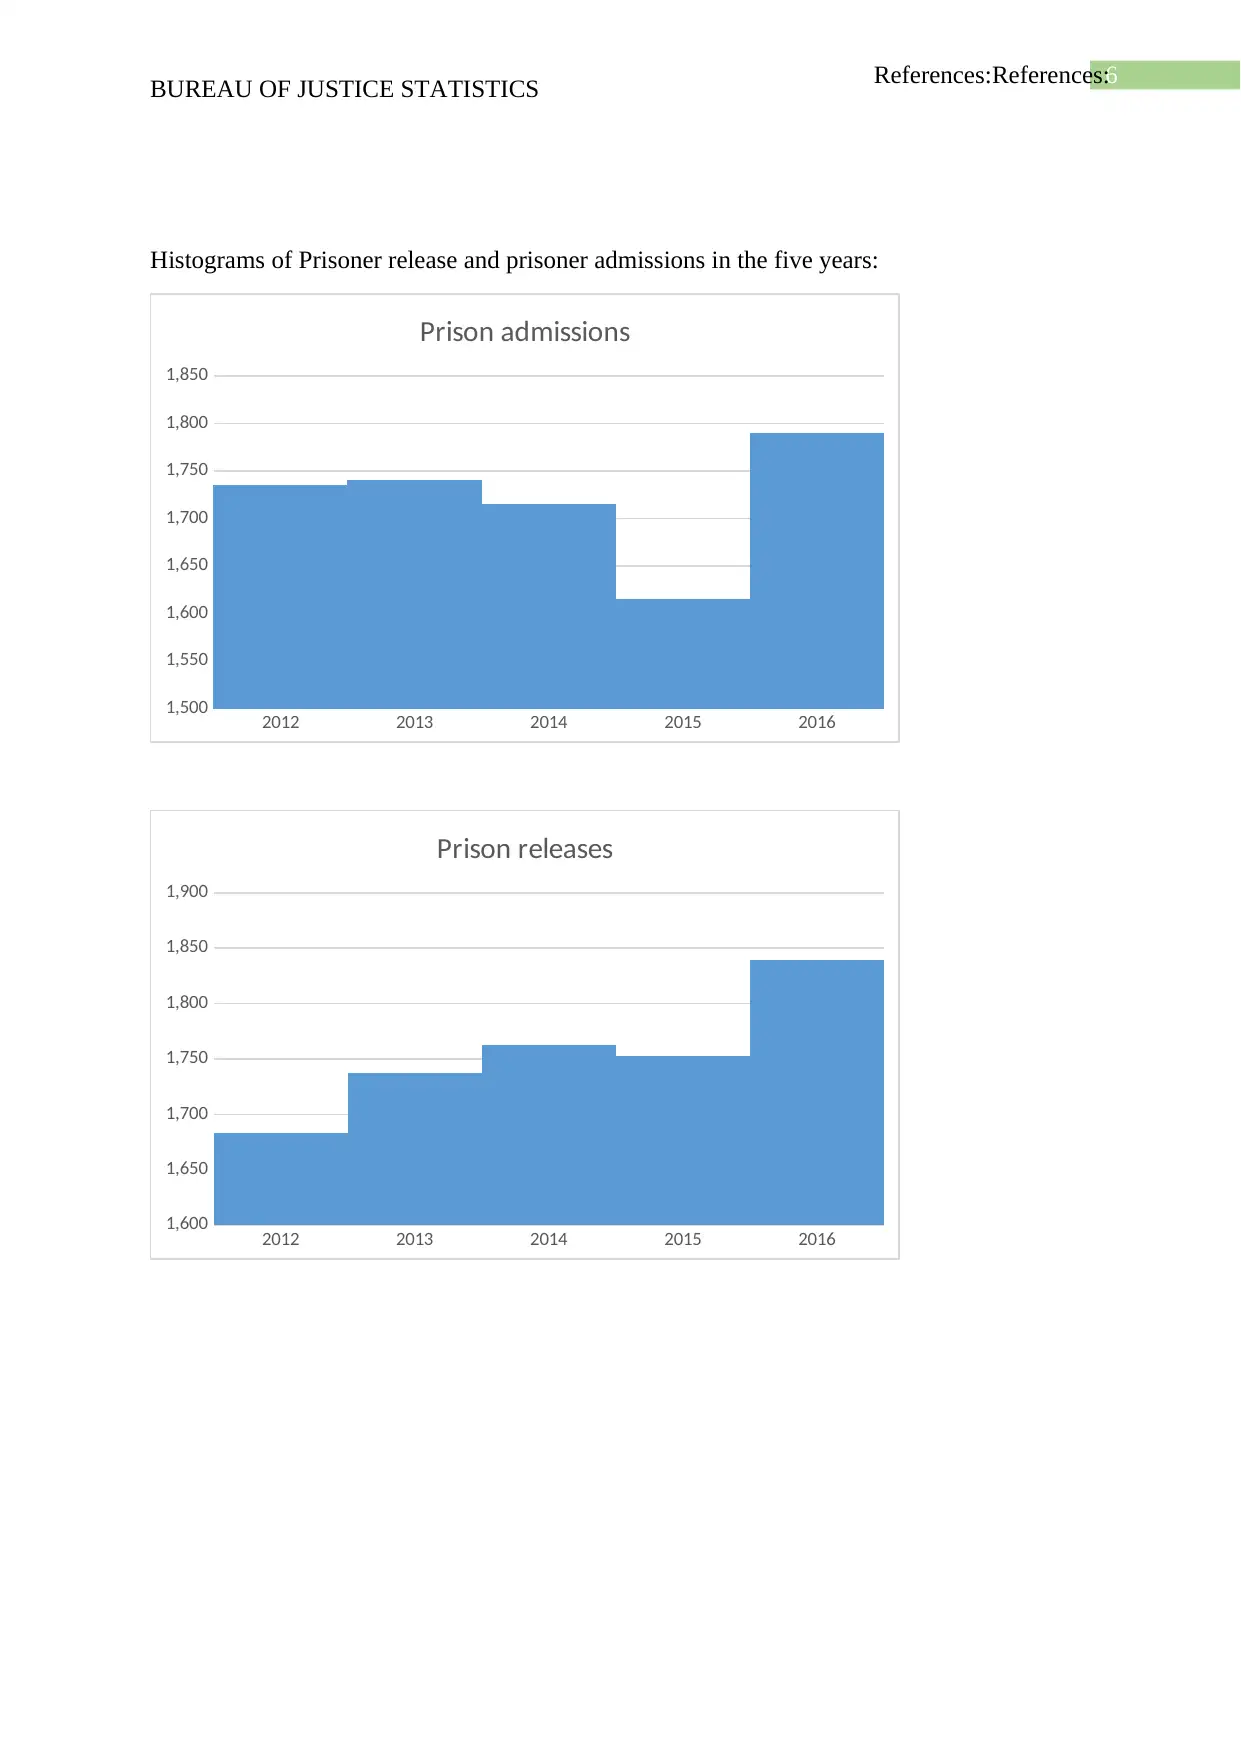
Histograms of Prisoner release and prisoner admissions in the five years:
2012 2013 2014 2015 2016
1,500
1,550
1,600
1,650
1,700
1,750
1,800
1,850
Prison admissions
2012 2013 2014 2015 2016
1,600
1,650
1,700
1,750
1,800
1,850
1,900
Prison releases
BUREAU OF JUSTICE STATISTICS
Histograms of Prisoner release and prisoner admissions in the five years:
2012 2013 2014 2015 2016
1,500
1,550
1,600
1,650
1,700
1,750
1,800
1,850
Prison admissions
2012 2013 2014 2015 2016
1,600
1,650
1,700
1,750
1,800
1,850
1,900
Prison releases
Paraphrase This Document
Need a fresh take? Get an instant paraphrase of this document with our AI Paraphraser
7References:References:
BUREAU OF JUSTICE STATISTICS
References:
Bureau of Justice Statistics (BJS) - Tribal Crime Data-Collection Activities, 2019.
Perry, S. W. (2013). Tribal crime data collection activities, 2012. US Department of Justice,
Office of Justice Programs, Bureau of Justice Statistics.
Rosay, A. B. (2016). Violence against American Indian and Alaska Native women and men.
Ross, J. I. (2013). Introduction to crime, criminal justice, and violence in American Indian
communities. American Indians at Risk [2 volumes], 3.
1 out of 8
Related Documents


Your All-in-One AI-Powered Toolkit for Academic Success.
+13062052269
info@desklib.com
Available 24*7 on WhatsApp / Email
![[object Object]](/_next/static/media/star-bottom.7253800d.svg)
Unlock your academic potential
© 2024 | Zucol Services PVT LTD | All rights reserved.