Alcopops Tax and Social Impact
VerifiedAdded on 2020/05/28
|9
|1406
|129
AI Summary
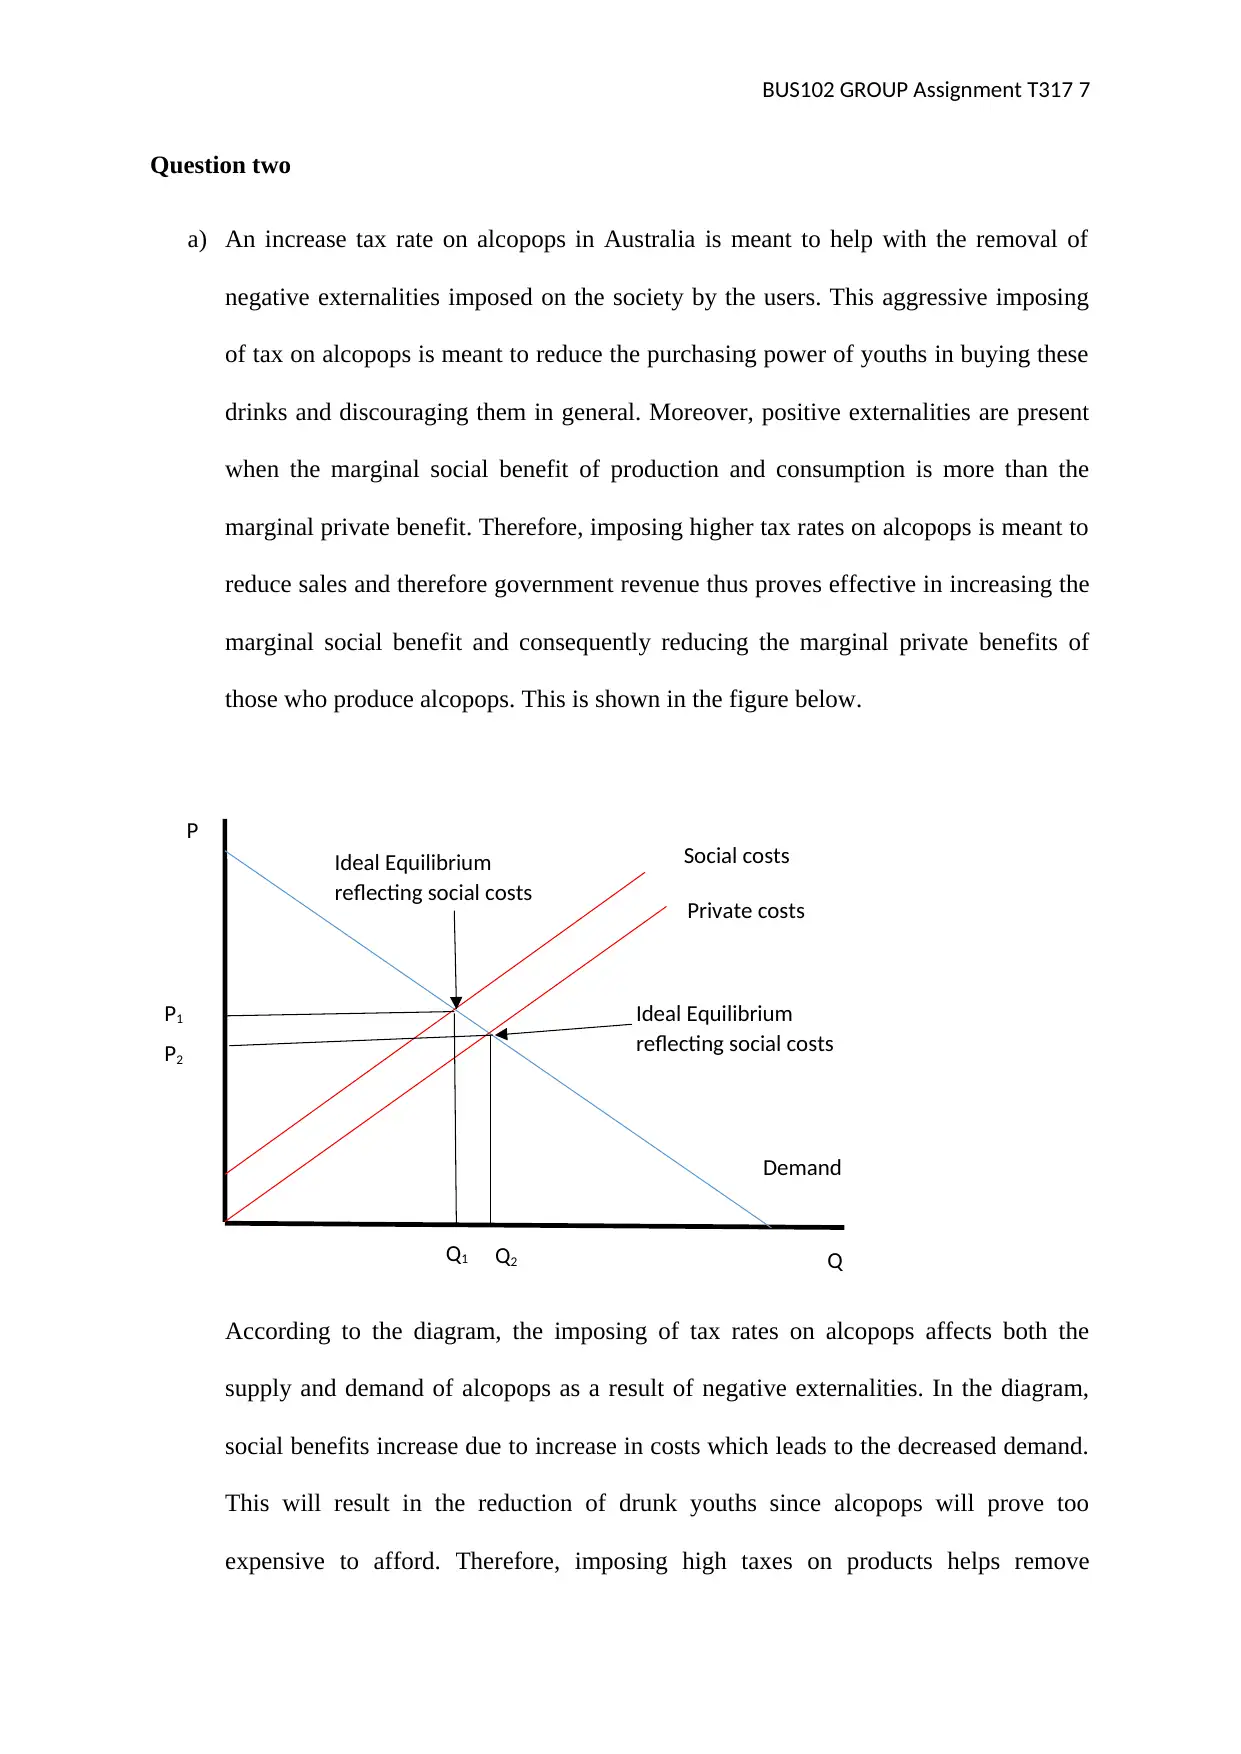
The assignment examines the use of higher tax rates on alcopops to mitigate negative externalities imposed on society. It discusses how this policy aims to decrease youth purchasing power, influence marginal social benefits, and ultimately reduce alcohol-related harm. The analysis includes a diagram illustrating the impact of taxation on supply and demand, emphasizing the burden on consumers. Additionally, the assignment proposes information dissemination and education programs alongside taxation as effective strategies to combat binge drinking.
Contribute Materials
Your contribution can guide someone’s learning journey. Share your
documents today.


1 out of 9
Related Documents


Your All-in-One AI-Powered Toolkit for Academic Success.
+13062052269
info@desklib.com
Available 24*7 on WhatsApp / Email
![[object Object]](/_next/static/media/star-bottom.7253800d.svg)
© 2024 | Zucol Services PVT LTD | All rights reserved.