BUS105: Statistics Computing Assignment, Semester 2, 2017, Analysis
VerifiedAdded on 2020/02/19
|12
|1437
|478
Homework Assignment
AI Summary
This document presents a comprehensive solution to a BUS105 statistics computing assignment. The assignment covers various statistical concepts and techniques, including scatter plots, z-scores, p-values, hypothesis testing, and confidence intervals. The solution analyzes the relationship between annual contribution and income, calculates expected ranks, and examines the proportion of risky and safe investments making losses. It also explores the average return of low-risk and high-risk investments, conducts hypothesis tests, and provides confidence intervals. Furthermore, the assignment includes pivot table analysis of customer data and a summary of dataset summarization techniques. The document offers detailed calculations, interpretations, and graphical representations to illustrate the statistical concepts and findings.

Running Head: STATISTICS
Title :bus105 computing assignment semester 2, 2017
Name:
Student number: 11700304
Allocated sample: 73
Title :bus105 computing assignment semester 2, 2017
Name:
Student number: 11700304
Allocated sample: 73
Paraphrase This Document
Need a fresh take? Get an instant paraphrase of this document with our AI Paraphraser
1STATISTICS
Table of Contents
Section 1..........................................................................................................................................3
Part A...........................................................................................................................................3
Part B............................................................................................................................................3
Part C............................................................................................................................................3
Part D...........................................................................................................................................3
Part E............................................................................................................................................3
Section 2..........................................................................................................................................4
Part A...........................................................................................................................................4
Part B............................................................................................................................................5
Part C............................................................................................................................................5
Part D...........................................................................................................................................5
Part i.........................................................................................................................................5
Part ii........................................................................................................................................5
Part iii.......................................................................................................................................6
Part iv.......................................................................................................................................6
Part E............................................................................................................................................6
Part i.........................................................................................................................................6
Part ii........................................................................................................................................6
Part iii.......................................................................................................................................6
Part iv.......................................................................................................................................6
Section 3..........................................................................................................................................7
Part A...........................................................................................................................................7
Part B............................................................................................................................................7
Part C............................................................................................................................................7
Part D...........................................................................................................................................7
Part i.........................................................................................................................................7
Part ii........................................................................................................................................8
Part iii.......................................................................................................................................8
2STATISTICS
Part iv.......................................................................................................................................8
Part E............................................................................................................................................8
Part i.........................................................................................................................................8
Part ii........................................................................................................................................8
Part iii.......................................................................................................................................9
Part iv.......................................................................................................................................9
Section 4..........................................................................................................................................9
Part A...........................................................................................................................................9
Part B............................................................................................................................................9
Part C............................................................................................................................................9
Part i.........................................................................................................................................9
Part ii......................................................................................................................................10
Part iii.....................................................................................................................................10
Part D.........................................................................................................................................10
Section 5........................................................................................................................................10
Section 6........................................................................................................................................11
⊘ This is a preview!⊘
Do you want full access?
Subscribe today to unlock all pages.
Trusted by 1+ million students worldwide
3STATISTICS
Section 1
Part A
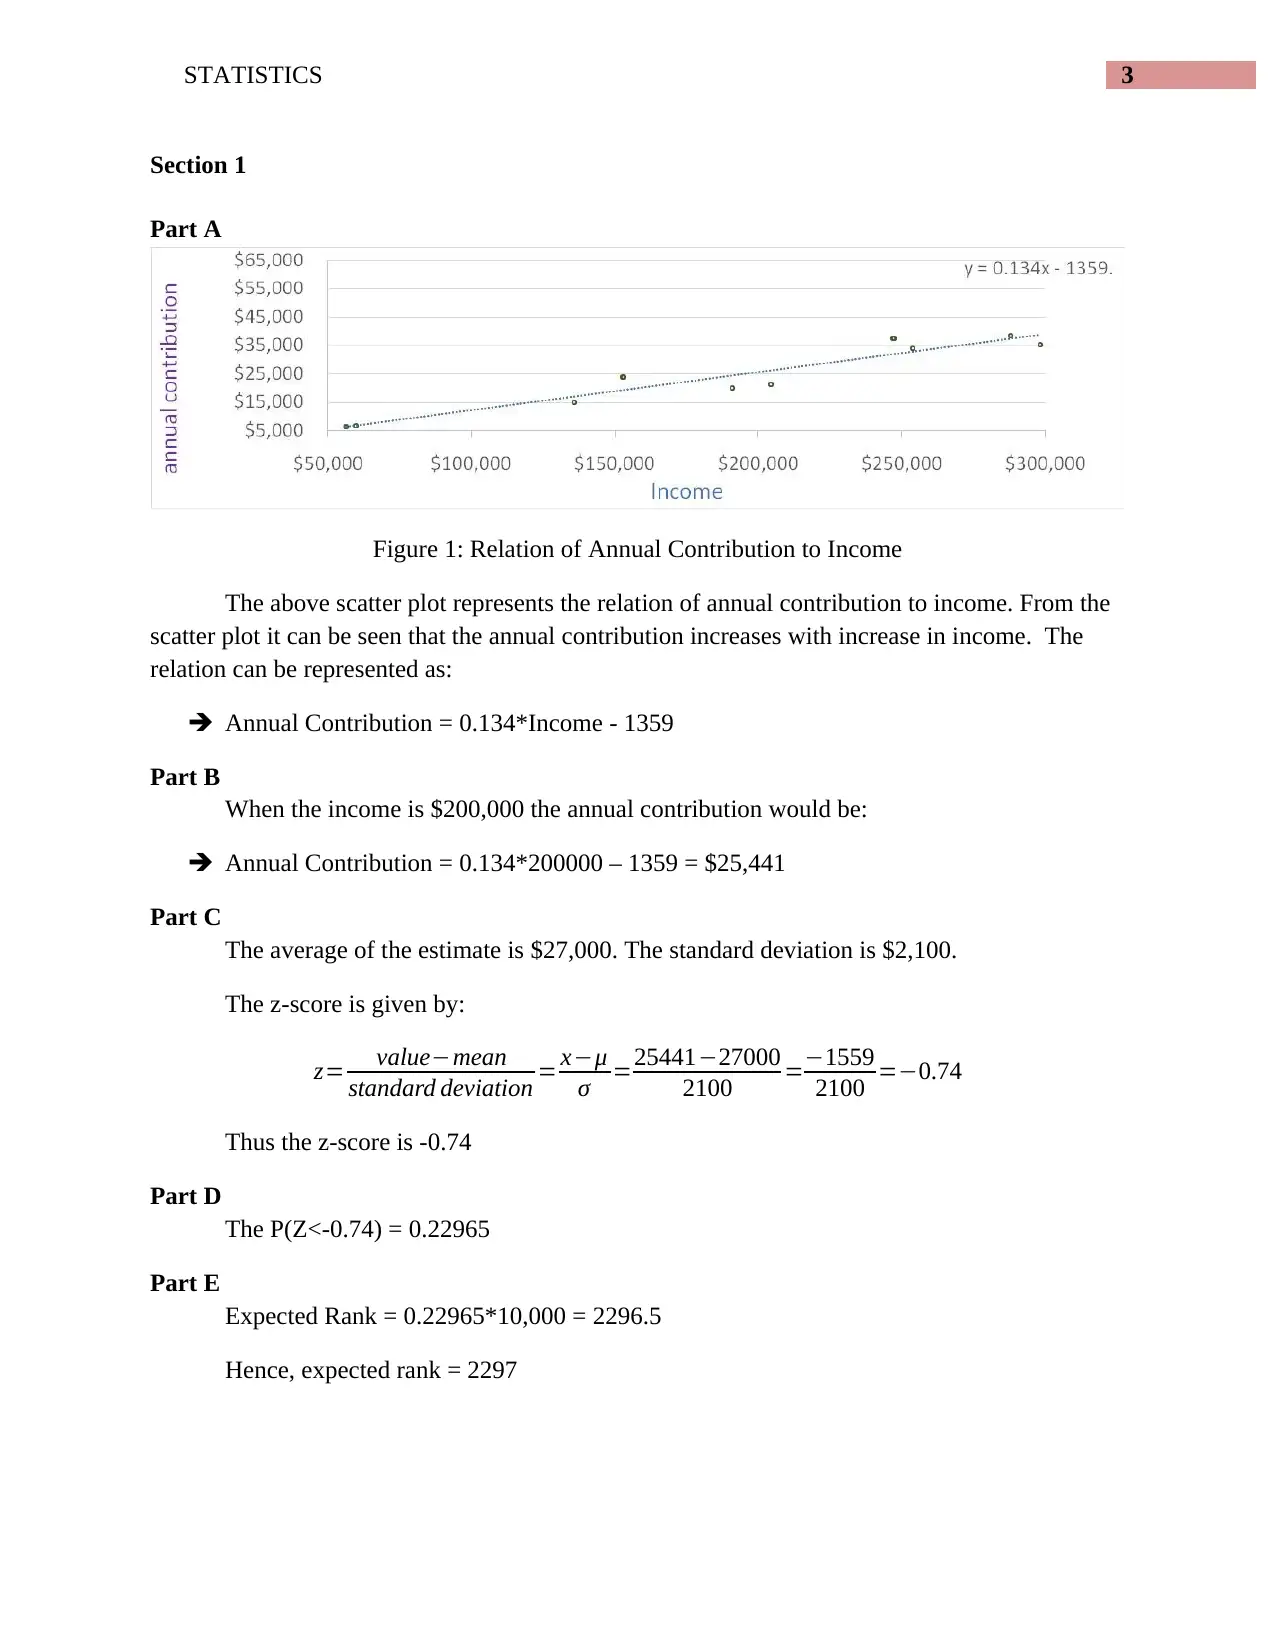
Figure 1: Relation of Annual Contribution to Income
The above scatter plot represents the relation of annual contribution to income. From the
scatter plot it can be seen that the annual contribution increases with increase in income. The
relation can be represented as:
Annual Contribution = 0.134*Income - 1359
Part B
When the income is $200,000 the annual contribution would be:
Annual Contribution = 0.134*200000 – 1359 = $25,441
Part C
The average of the estimate is $27,000. The standard deviation is $2,100.
The z-score is given by:
z= value−mean
standard deviation = x−μ
σ =25441−27000
2100 =−1559
2100 =−0.74
Thus the z-score is -0.74
Part D
The P(Z<-0.74) = 0.22965
Part E
Expected Rank = 0.22965*10,000 = 2296.5
Hence, expected rank = 2297
Section 1
Part A
Figure 1: Relation of Annual Contribution to Income
The above scatter plot represents the relation of annual contribution to income. From the
scatter plot it can be seen that the annual contribution increases with increase in income. The
relation can be represented as:
Annual Contribution = 0.134*Income - 1359
Part B
When the income is $200,000 the annual contribution would be:
Annual Contribution = 0.134*200000 – 1359 = $25,441
Part C
The average of the estimate is $27,000. The standard deviation is $2,100.
The z-score is given by:
z= value−mean
standard deviation = x−μ
σ =25441−27000
2100 =−1559
2100 =−0.74
Thus the z-score is -0.74
Part D
The P(Z<-0.74) = 0.22965
Part E
Expected Rank = 0.22965*10,000 = 2296.5
Hence, expected rank = 2297
Paraphrase This Document
Need a fresh take? Get an instant paraphrase of this document with our AI Paraphraser
4STATISTICS
Section 2
Part A
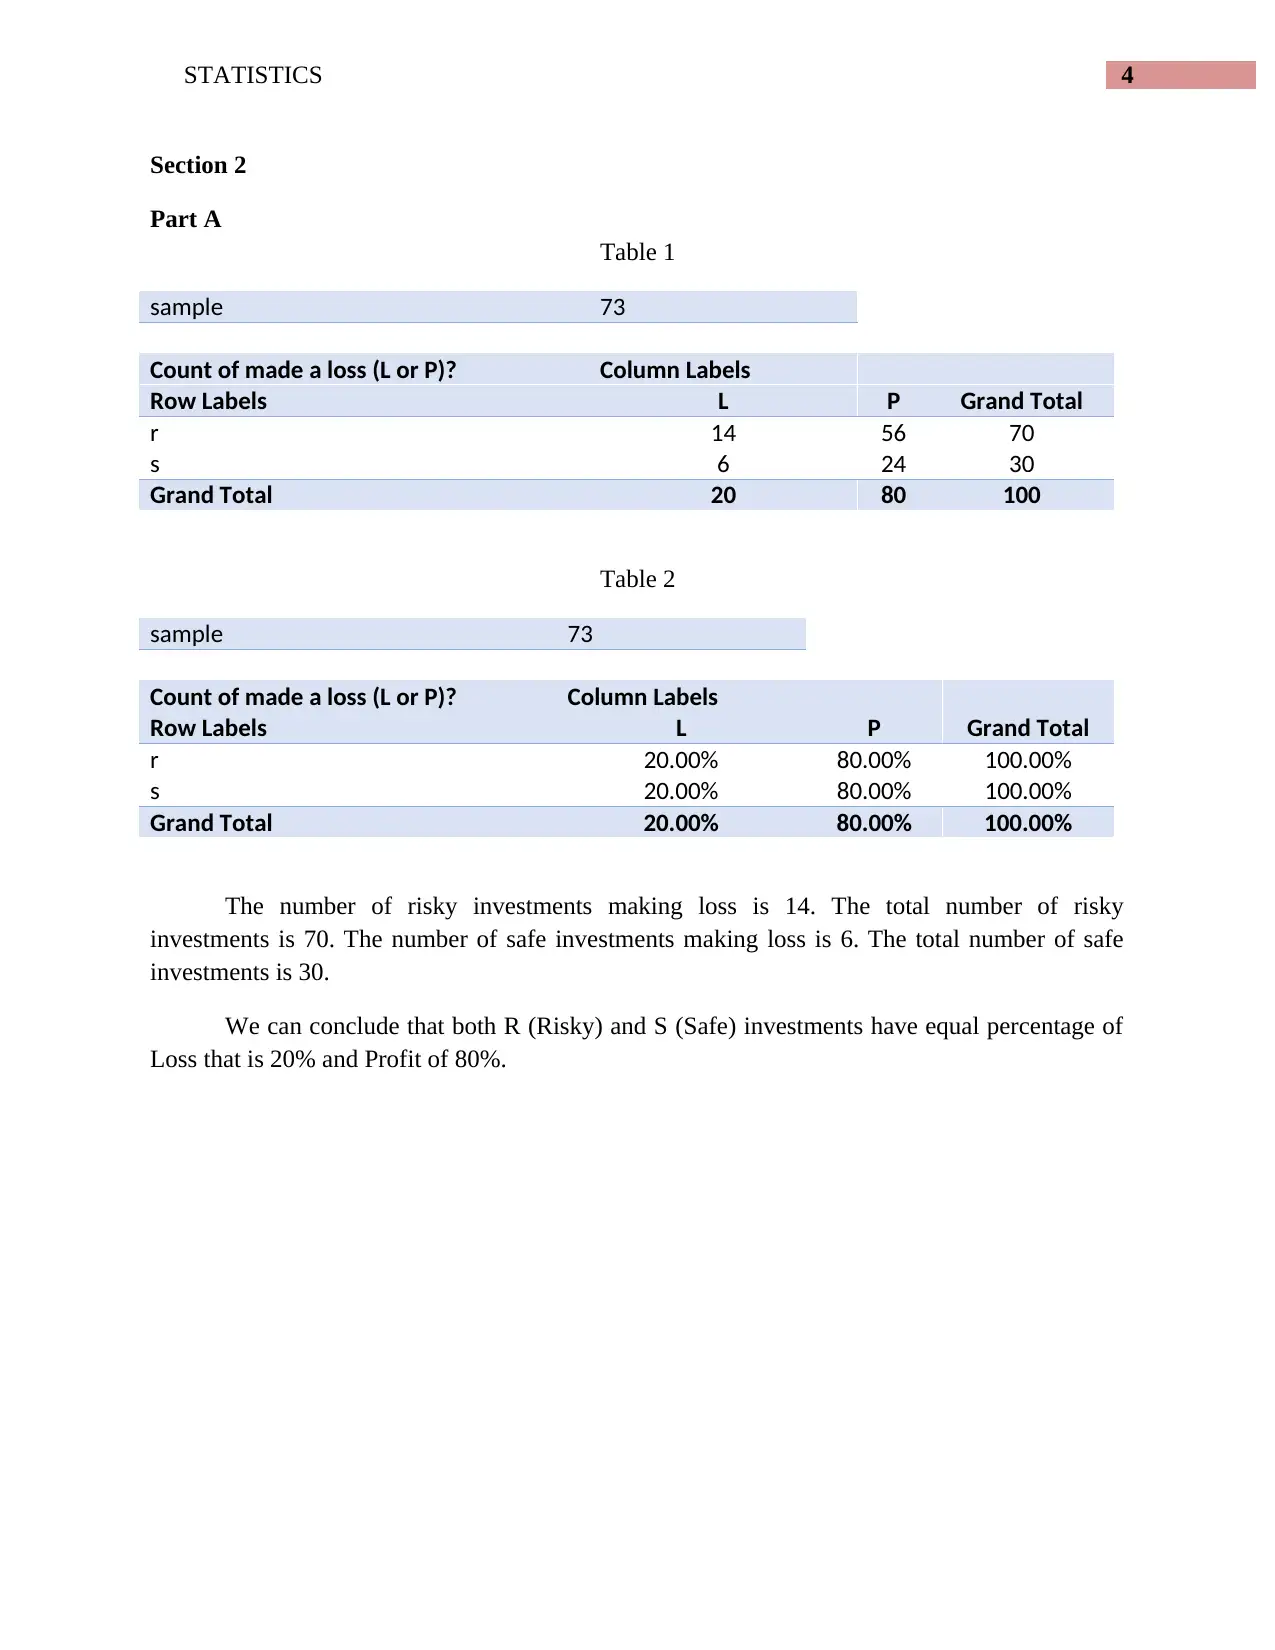
Table 1
sample 73
Count of made a loss (L or P)? Column Labels
Row Labels L P Grand Total
r 14 56 70
s 6 24 30
Grand Total 20 80 100
Table 2
sample 73
Count of made a loss (L or P)? Column Labels
Row Labels L P Grand Total
r 20.00% 80.00% 100.00%
s 20.00% 80.00% 100.00%
Grand Total 20.00% 80.00% 100.00%
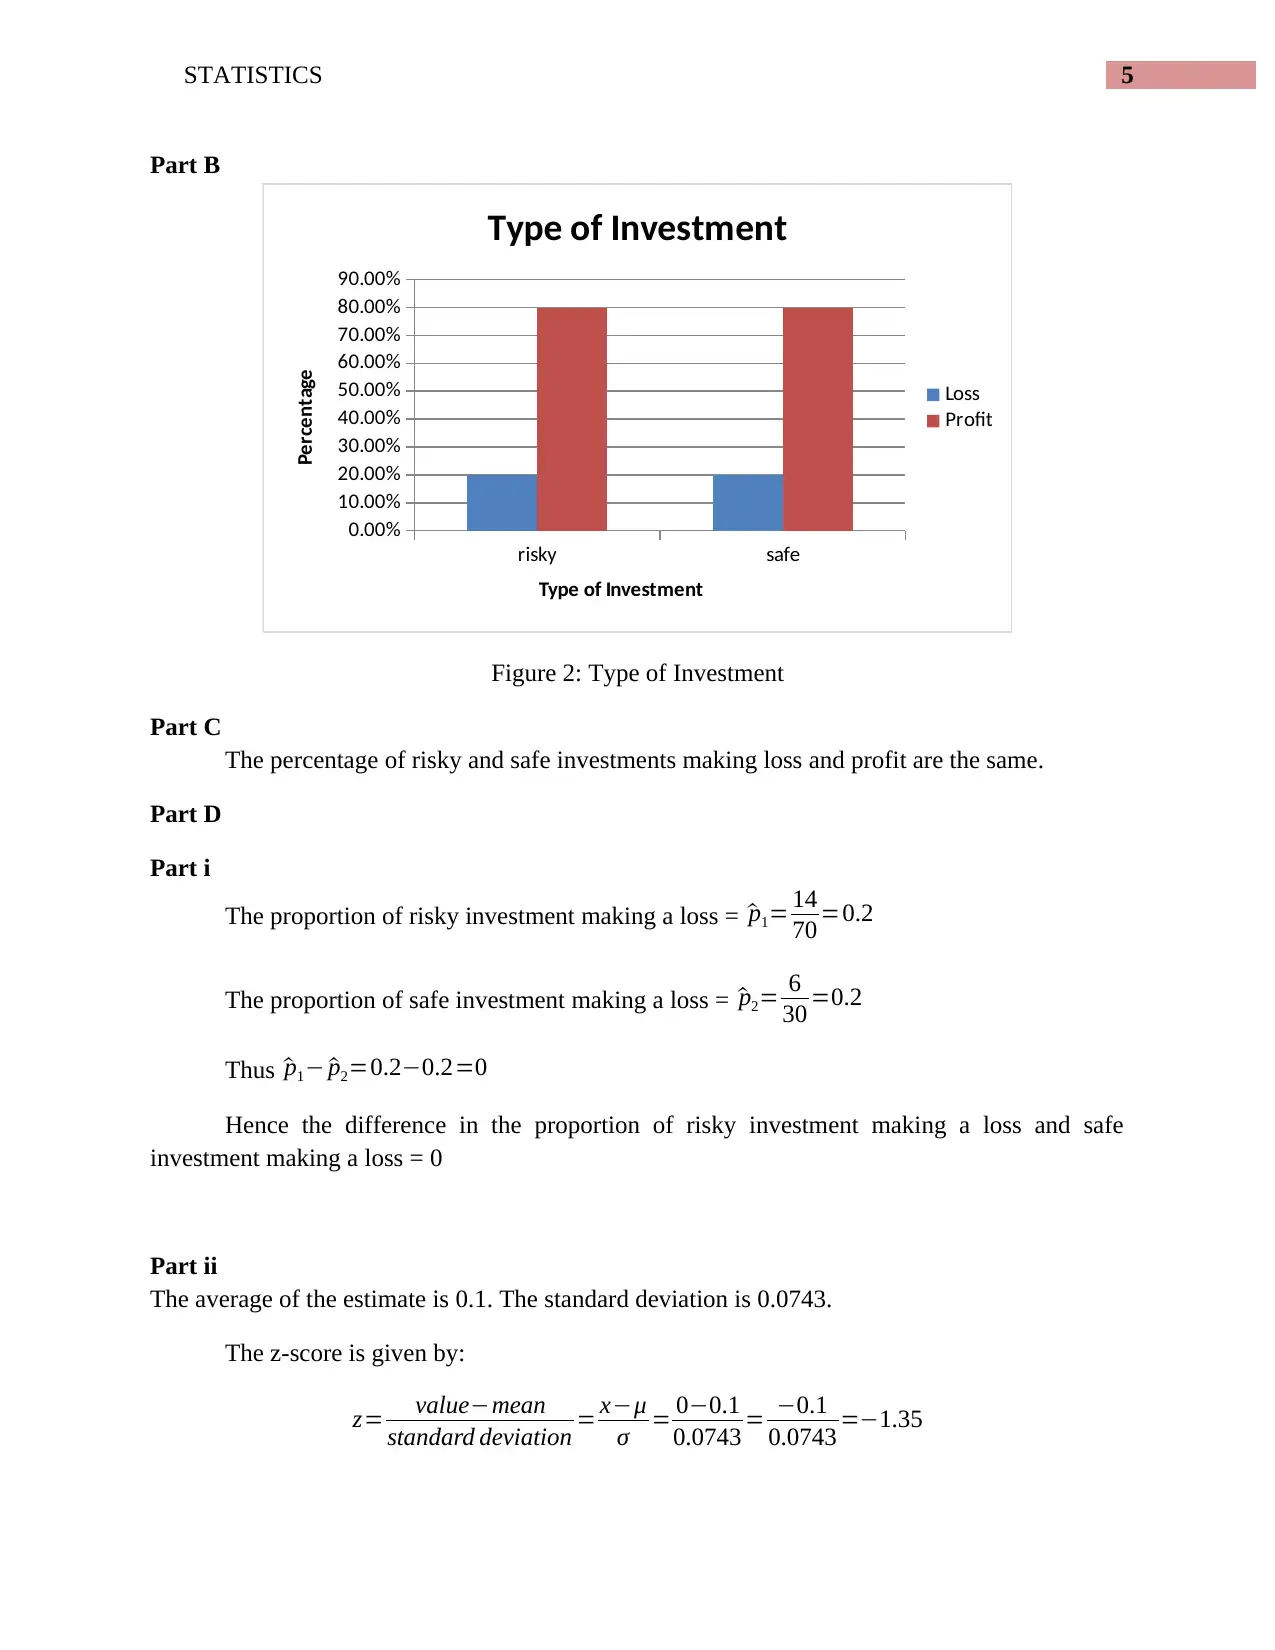
The number of risky investments making loss is 14. The total number of risky
investments is 70. The number of safe investments making loss is 6. The total number of safe
investments is 30.
We can conclude that both R (Risky) and S (Safe) investments have equal percentage of
Loss that is 20% and Profit of 80%.
Section 2
Part A
Table 1
sample 73
Count of made a loss (L or P)? Column Labels
Row Labels L P Grand Total
r 14 56 70
s 6 24 30
Grand Total 20 80 100
Table 2
sample 73
Count of made a loss (L or P)? Column Labels
Row Labels L P Grand Total
r 20.00% 80.00% 100.00%
s 20.00% 80.00% 100.00%
Grand Total 20.00% 80.00% 100.00%
The number of risky investments making loss is 14. The total number of risky
investments is 70. The number of safe investments making loss is 6. The total number of safe
investments is 30.
We can conclude that both R (Risky) and S (Safe) investments have equal percentage of
Loss that is 20% and Profit of 80%.
5STATISTICS
Part B
risky safe
0.00%
10.00%
20.00%
30.00%
40.00%
50.00%
60.00%
70.00%
80.00%
90.00%
Type of Investment
Loss
Profit
Type of Investment
Percentage
Figure 2: Type of Investment
Part C
The percentage of risky and safe investments making loss and profit are the same.
Part D
Part i
The proportion of risky investment making a loss = ^p1= 14
70 =0.2
The proportion of safe investment making a loss = ^p2= 6
30 =0.2
Thus ^p1− ^p2=0.2−0.2=0
Hence the difference in the proportion of risky investment making a loss and safe
investment making a loss = 0
Part ii
The average of the estimate is 0.1. The standard deviation is 0.0743.
The z-score is given by:
z= value−mean
standard deviation = x−μ
σ = 0−0.1
0.0743 = −0.1
0.0743 =−1.35
⊘ This is a preview!⊘
Do you want full access?
Subscribe today to unlock all pages.
Trusted by 1+ million students worldwide
6STATISTICS
Thus the z-score is -1.35
Part iii
P(Z<-1.35) = 0.088508
Part iv
Expected Rank = 0.088508*4000 = 354.032 ≈ 354
Hence, expected Rank = 354.
Part E
Part i
The hypothesis:
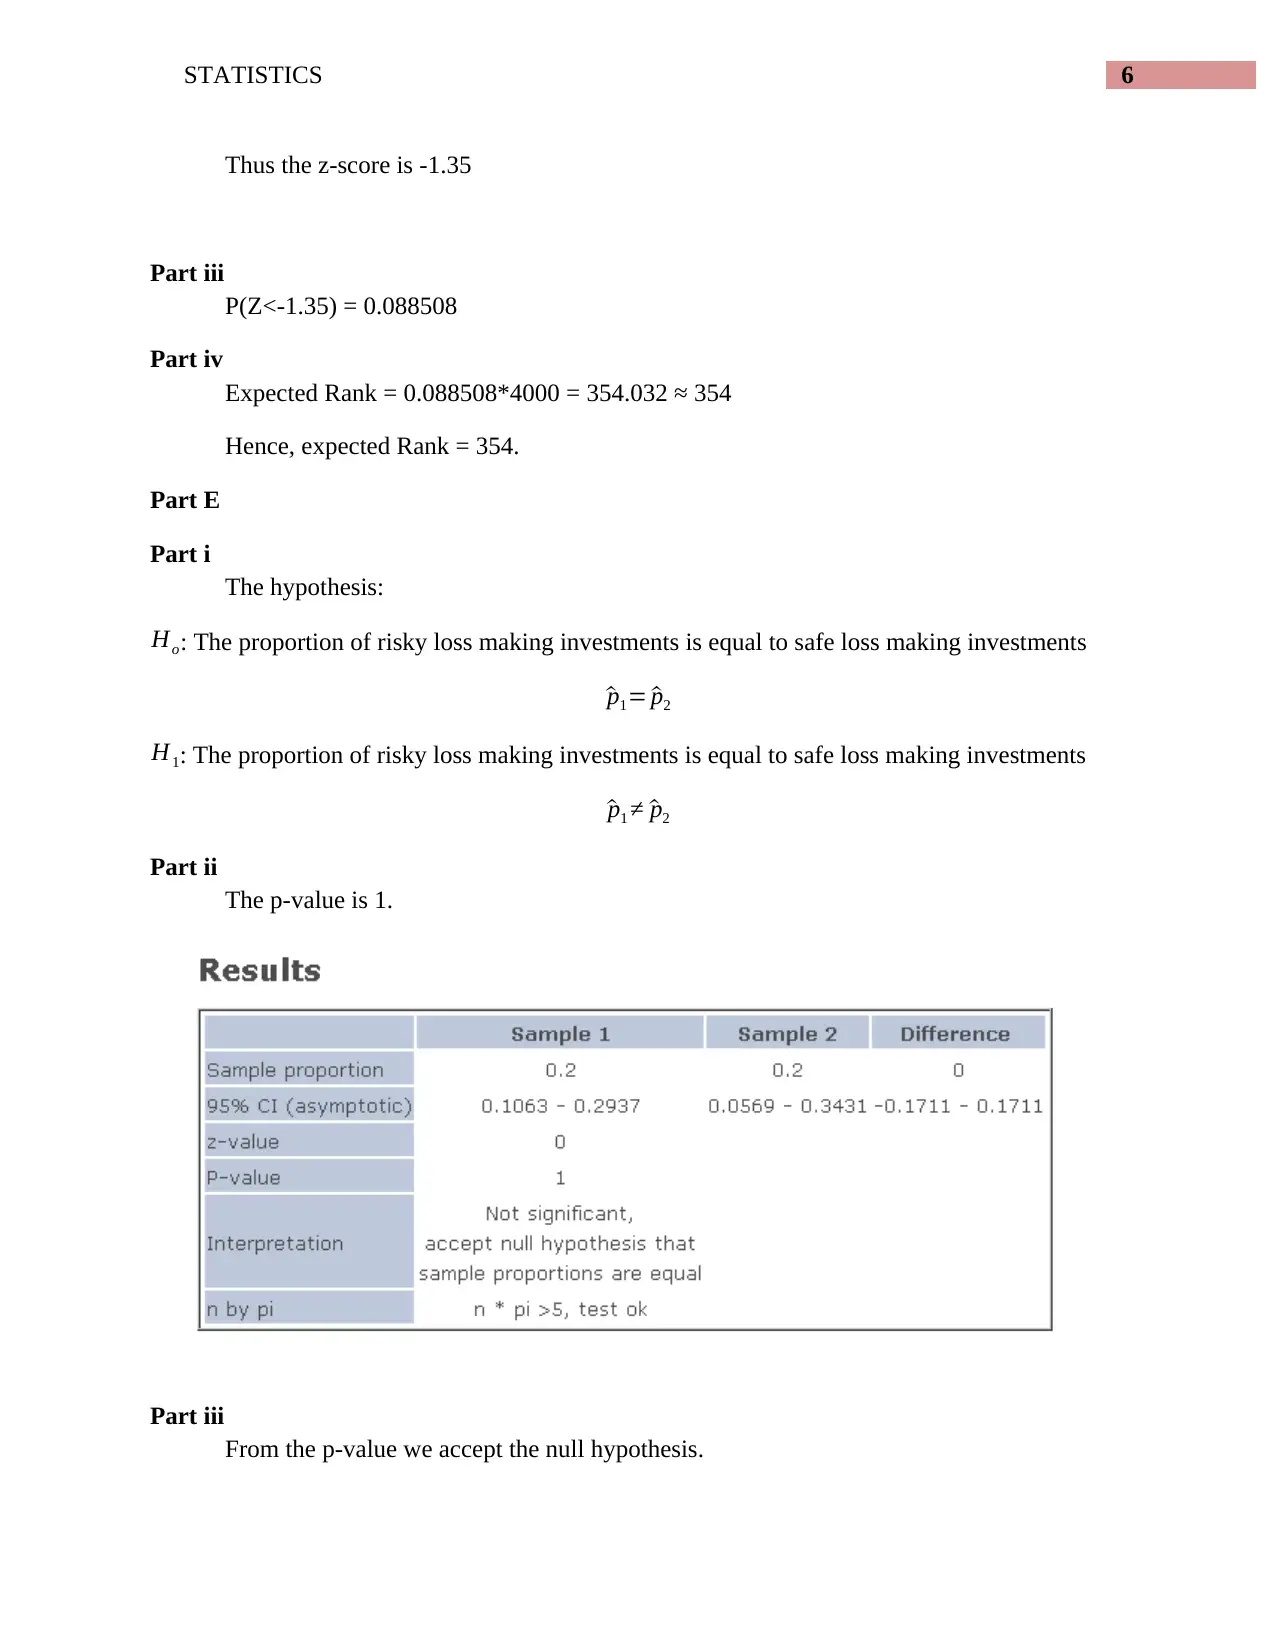
Ho: The proportion of risky loss making investments is equal to safe loss making investments
^p1= ^p2
H1: The proportion of risky loss making investments is equal to safe loss making investments
^p1 ≠ ^p2
Part ii
The p-value is 1.
Part iii
From the p-value we accept the null hypothesis.
Thus the z-score is -1.35
Part iii
P(Z<-1.35) = 0.088508
Part iv
Expected Rank = 0.088508*4000 = 354.032 ≈ 354
Hence, expected Rank = 354.
Part E
Part i
The hypothesis:
Ho: The proportion of risky loss making investments is equal to safe loss making investments
^p1= ^p2
H1: The proportion of risky loss making investments is equal to safe loss making investments
^p1 ≠ ^p2
Part ii
The p-value is 1.
Part iii
From the p-value we accept the null hypothesis.
Paraphrase This Document
Need a fresh take? Get an instant paraphrase of this document with our AI Paraphraser
7STATISTICS
Part iv
The proportion of risky loss making investments is equal to safe loss making investments.
Section 3
Part A
Table 3
sample 73
Values
Row Labels Count of High risk ? Average of return StdDev of return
n 67 0.034402985 0.002985113
y 33 0.067272727 0.100320509
Grand Total 100 0.04525 0.059163423
Part B
No Yes
0
0.01
0.02
0.03
0.04
0.05
0.06
0.07
0.08
Analysis of return
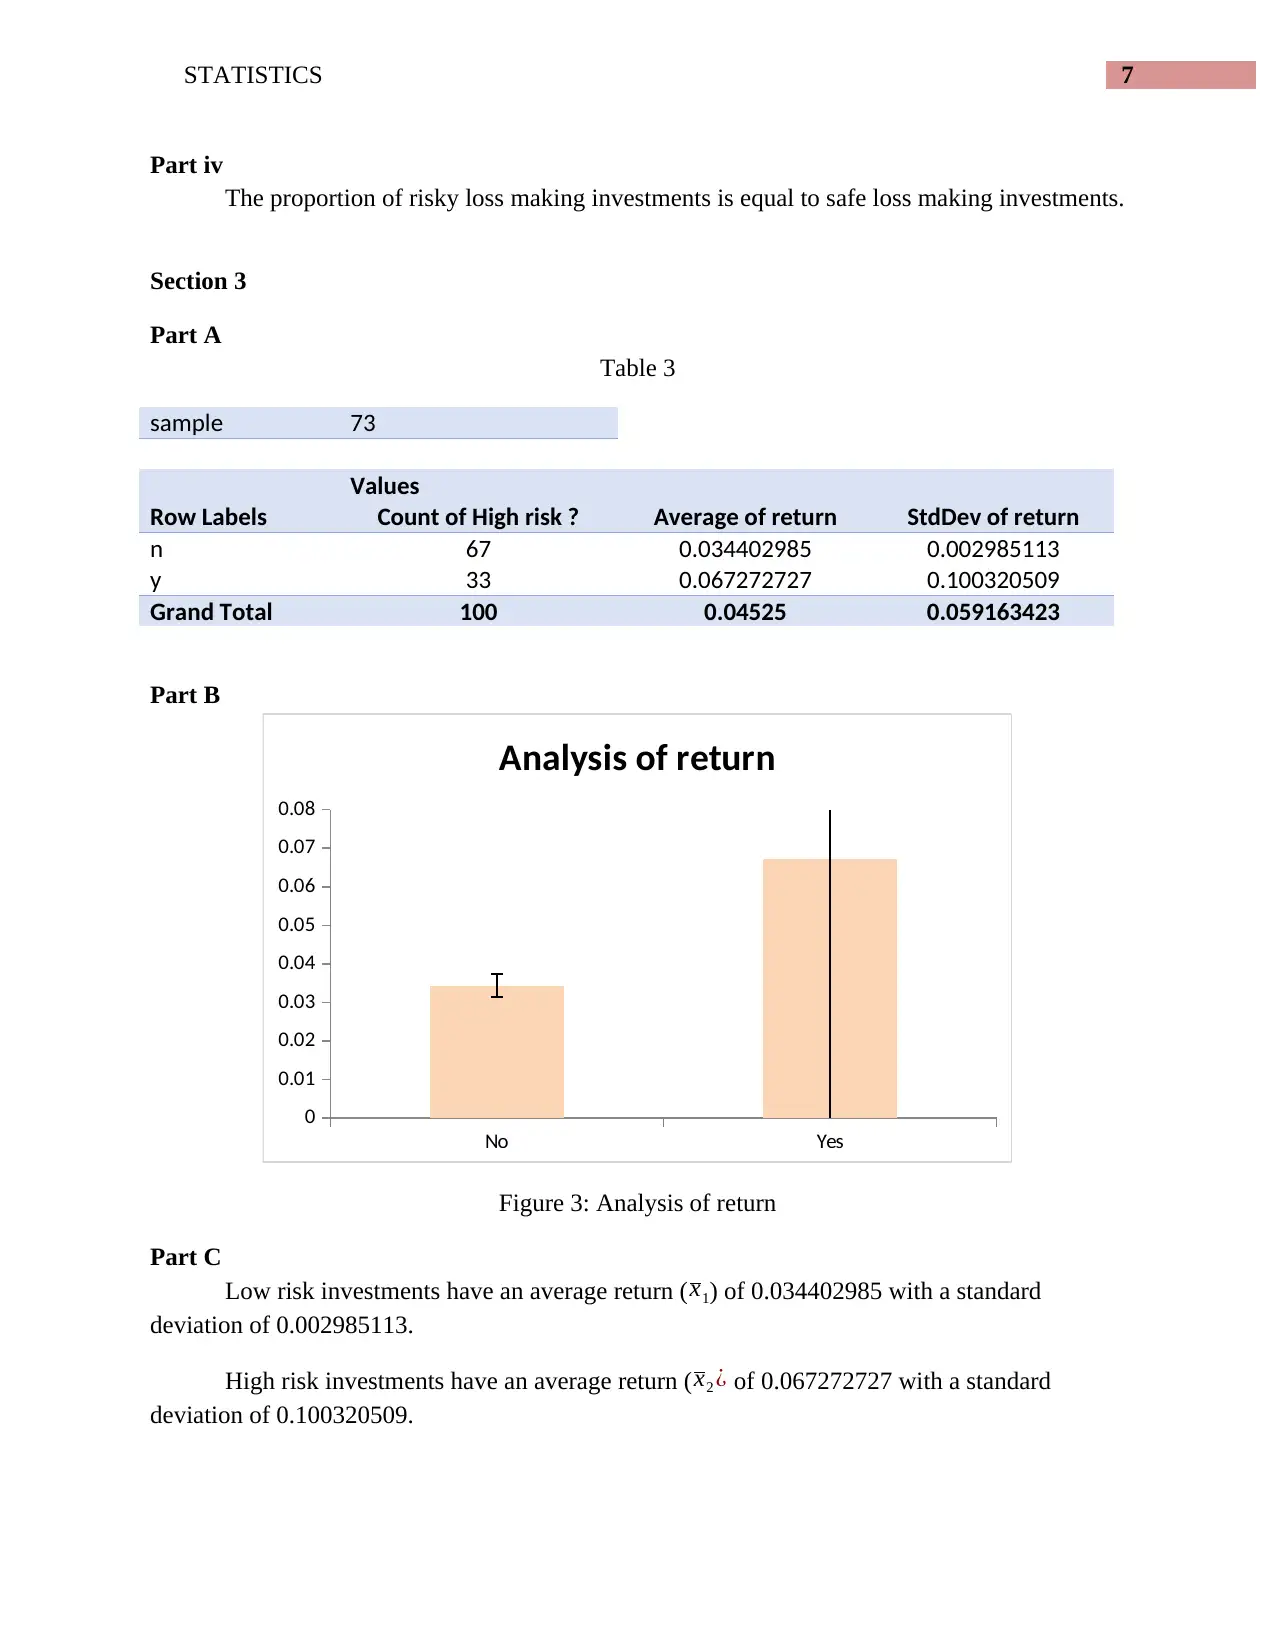
Figure 3: Analysis of return
Part C
Low risk investments have an average return (x1) of 0.034402985 with a standard
deviation of 0.002985113.
High risk investments have an average return ( x2 ¿ of 0.067272727 with a standard
deviation of 0.100320509.
Part iv
The proportion of risky loss making investments is equal to safe loss making investments.
Section 3
Part A
Table 3
sample 73
Values
Row Labels Count of High risk ? Average of return StdDev of return
n 67 0.034402985 0.002985113
y 33 0.067272727 0.100320509
Grand Total 100 0.04525 0.059163423
Part B
No Yes
0
0.01
0.02
0.03
0.04
0.05
0.06
0.07
0.08
Analysis of return
Figure 3: Analysis of return
Part C
Low risk investments have an average return (x1) of 0.034402985 with a standard
deviation of 0.002985113.
High risk investments have an average return ( x2 ¿ of 0.067272727 with a standard
deviation of 0.100320509.
8STATISTICS
Part D
Part i
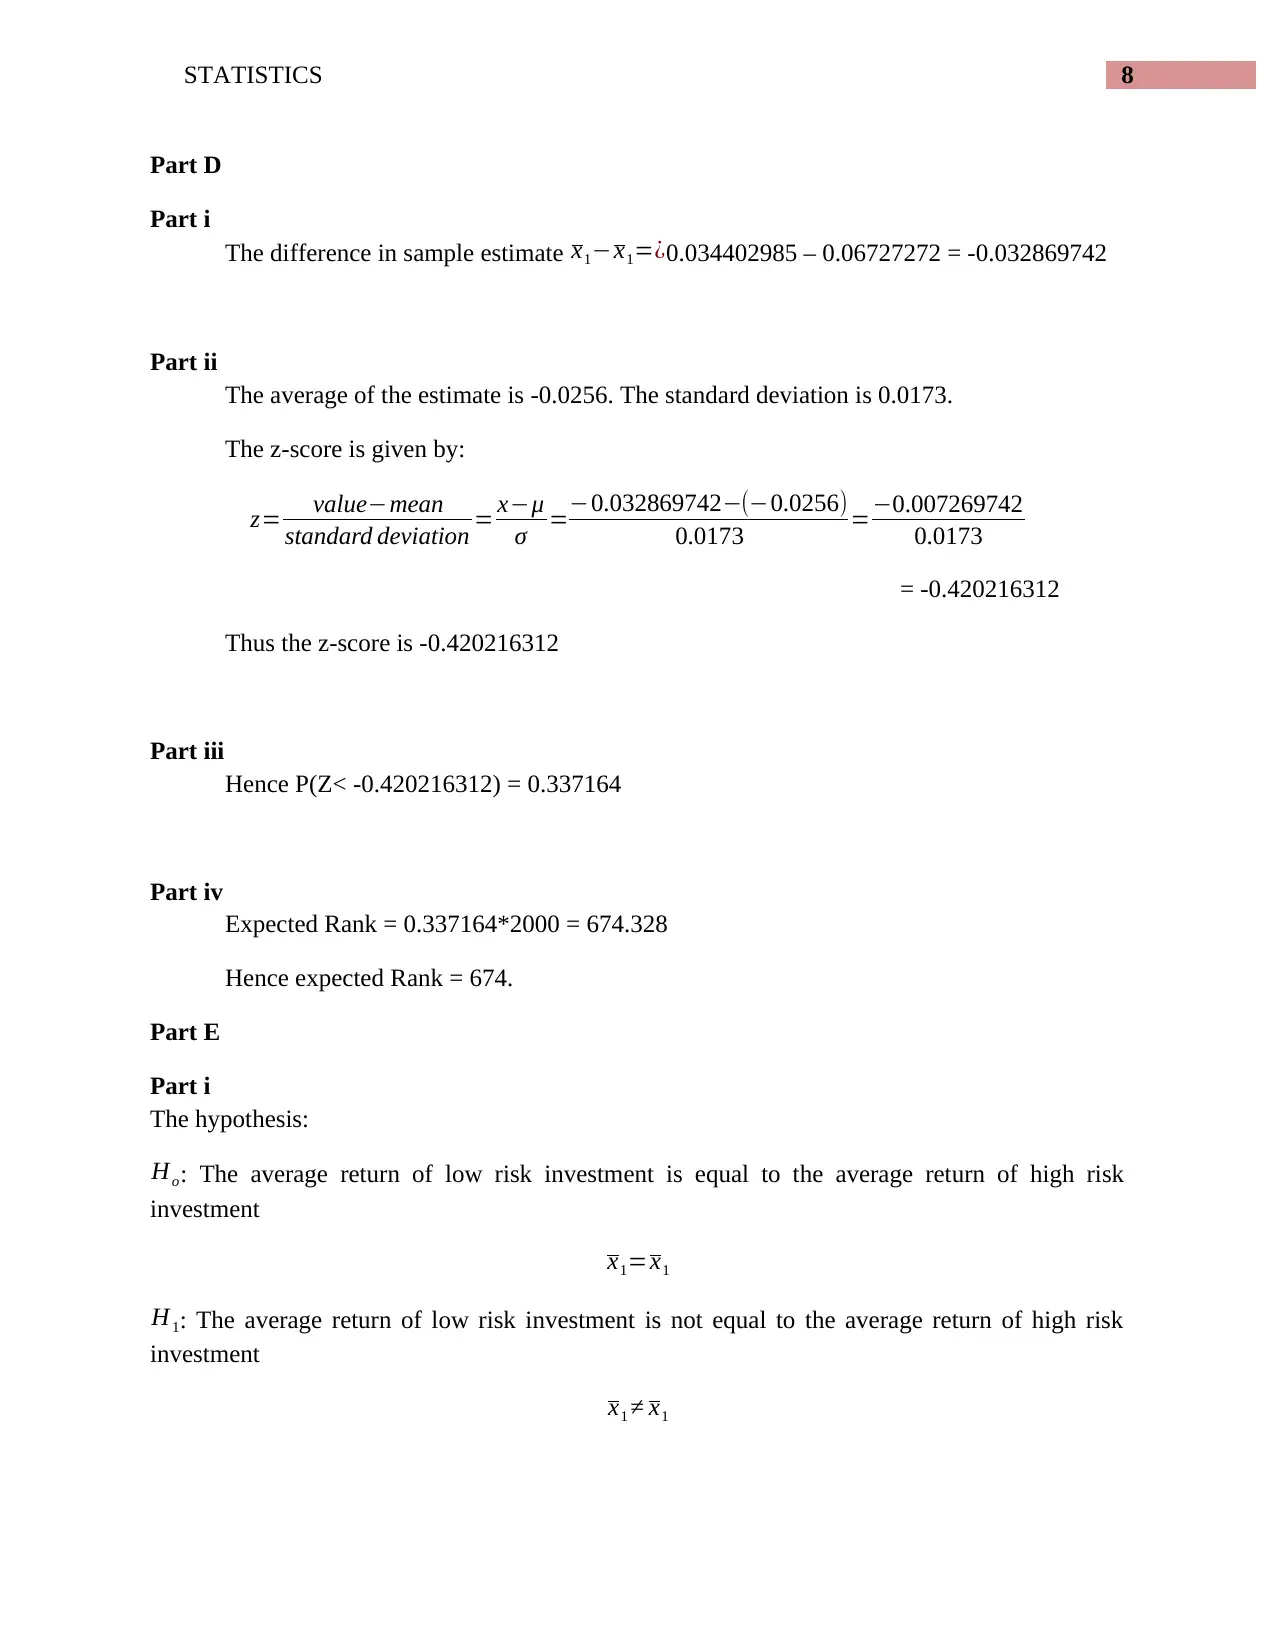
The difference in sample estimate x1−x1=¿0.034402985 – 0.06727272 = -0.032869742
Part ii
The average of the estimate is -0.0256. The standard deviation is 0.0173.
The z-score is given by:
z= value−mean
standard deviation = x−μ
σ =−0.032869742−(−0.0256)
0.0173 =−0.007269742
0.0173
= -0.420216312
Thus the z-score is -0.420216312
Part iii
Hence P(Z< -0.420216312) = 0.337164
Part iv
Expected Rank = 0.337164*2000 = 674.328
Hence expected Rank = 674.
Part E
Part i
The hypothesis:
Ho: The average return of low risk investment is equal to the average return of high risk
investment
x1=x1
H1: The average return of low risk investment is not equal to the average return of high risk
investment
x1 ≠ x1
Part D
Part i
The difference in sample estimate x1−x1=¿0.034402985 – 0.06727272 = -0.032869742
Part ii
The average of the estimate is -0.0256. The standard deviation is 0.0173.
The z-score is given by:
z= value−mean
standard deviation = x−μ
σ =−0.032869742−(−0.0256)
0.0173 =−0.007269742
0.0173
= -0.420216312
Thus the z-score is -0.420216312
Part iii
Hence P(Z< -0.420216312) = 0.337164
Part iv
Expected Rank = 0.337164*2000 = 674.328
Hence expected Rank = 674.
Part E
Part i
The hypothesis:
Ho: The average return of low risk investment is equal to the average return of high risk
investment
x1=x1
H1: The average return of low risk investment is not equal to the average return of high risk
investment
x1 ≠ x1
⊘ This is a preview!⊘
Do you want full access?
Subscribe today to unlock all pages.
Trusted by 1+ million students worldwide
9STATISTICS
Part ii
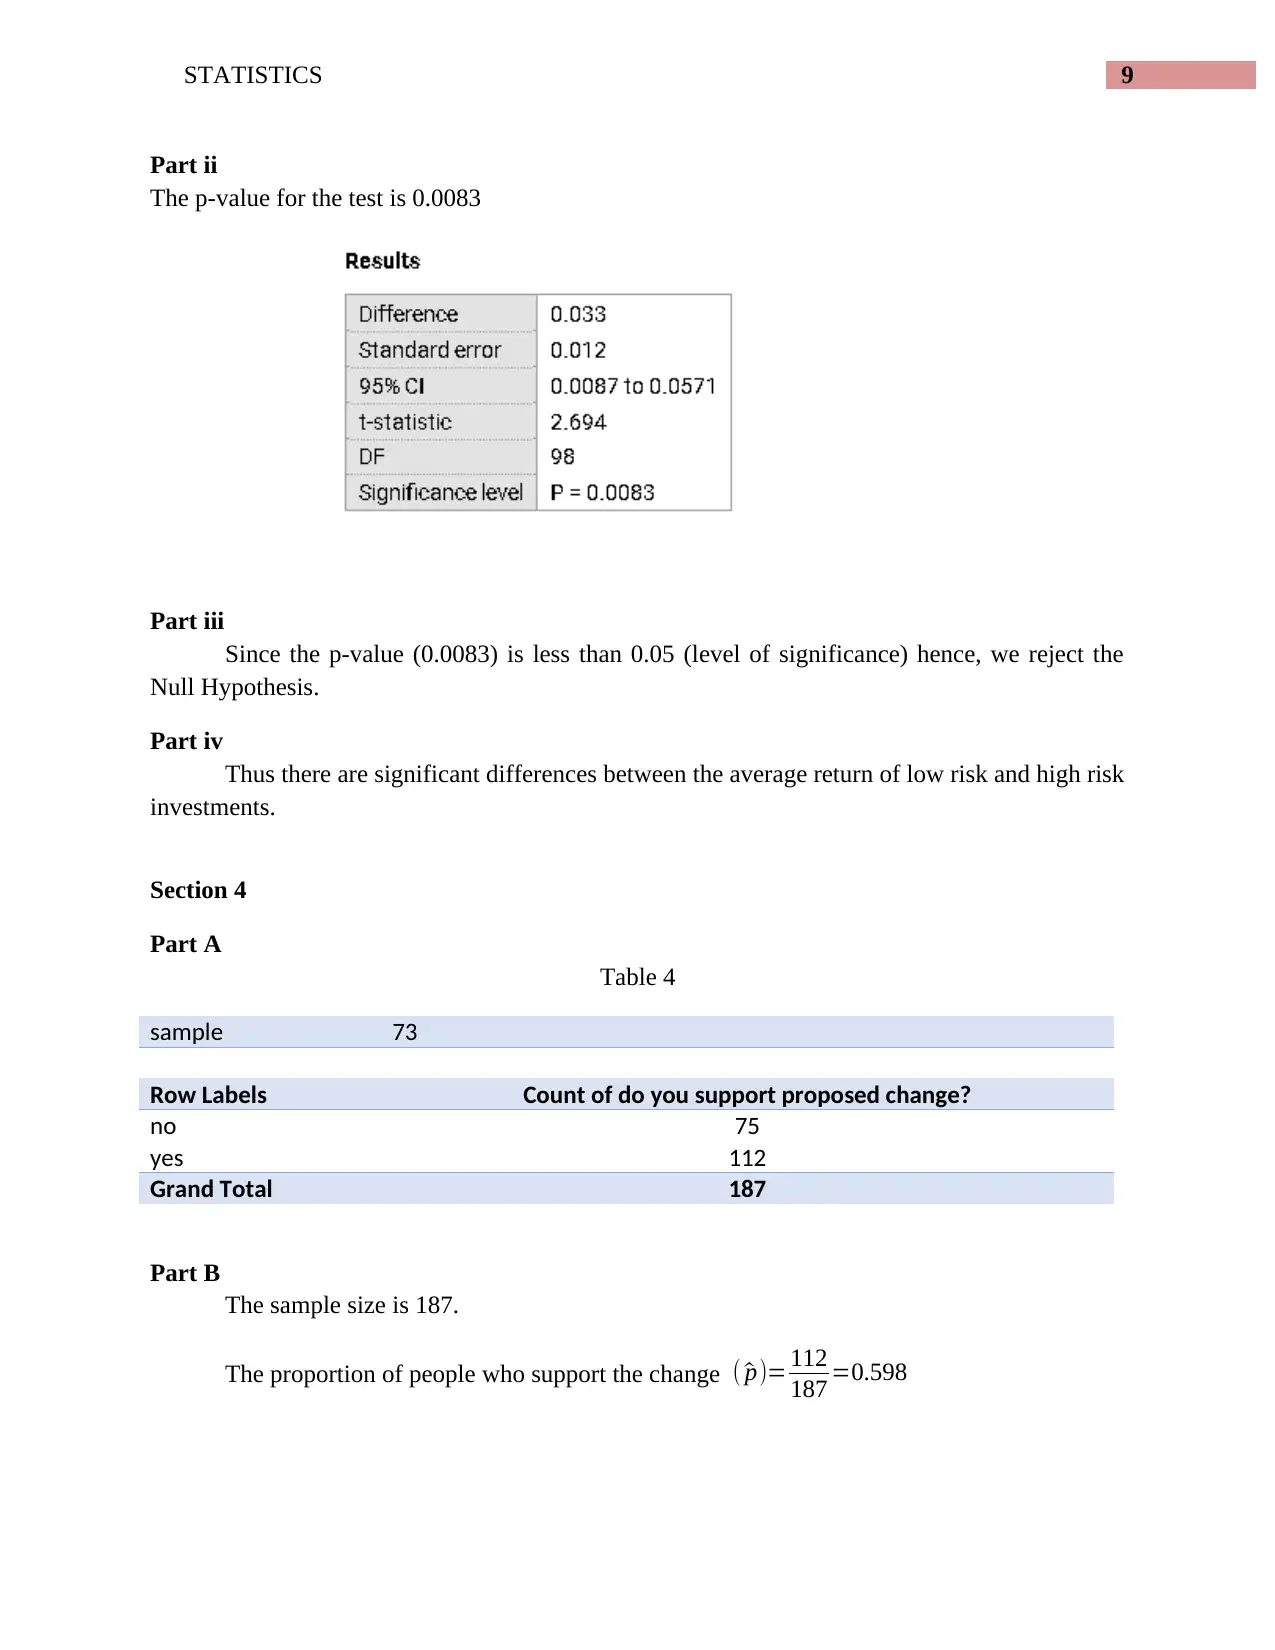
The p-value for the test is 0.0083
Part iii
Since the p-value (0.0083) is less than 0.05 (level of significance) hence, we reject the
Null Hypothesis.
Part iv
Thus there are significant differences between the average return of low risk and high risk
investments.
Section 4
Part A
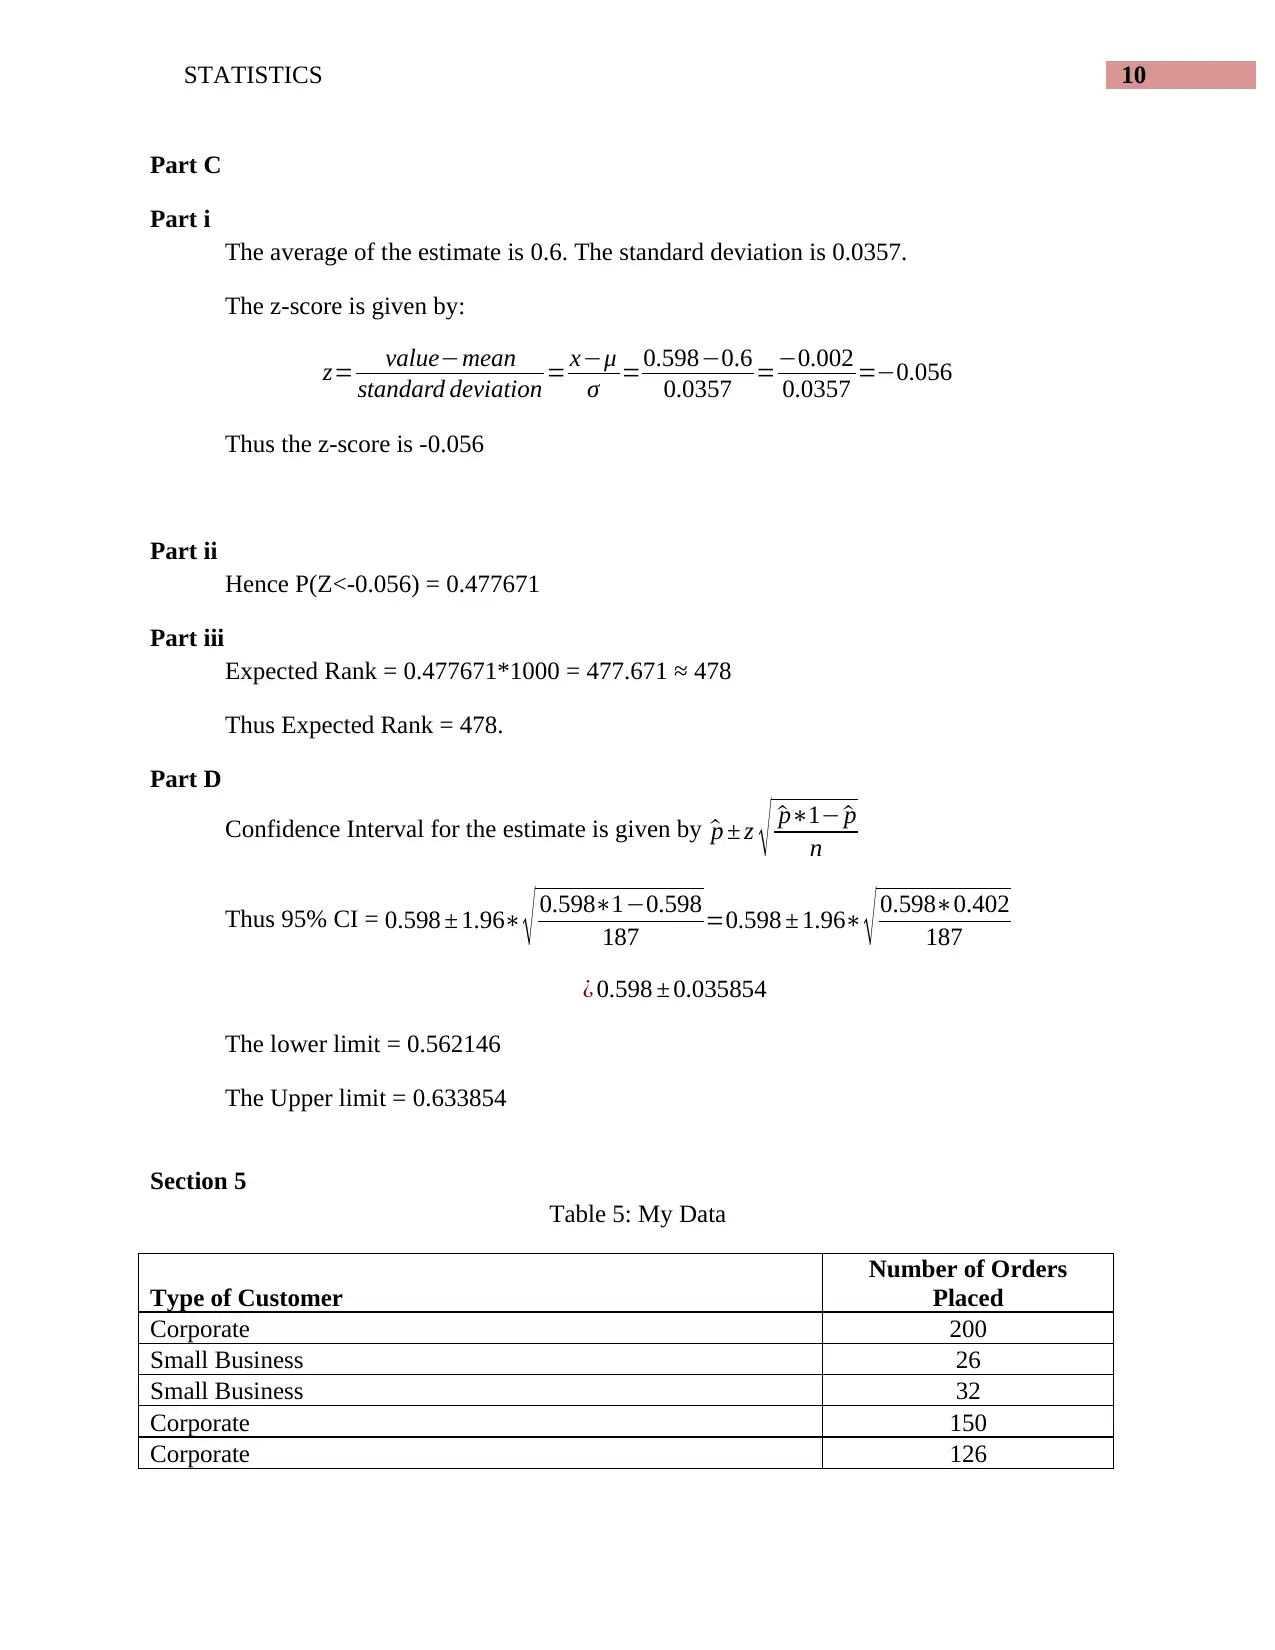
Table 4
sample 73
Row Labels Count of do you support proposed change?
no 75
yes 112
Grand Total 187
Part B
The sample size is 187.
The proportion of people who support the change ( ^p)= 112
187 =0.598
Part ii
The p-value for the test is 0.0083
Part iii
Since the p-value (0.0083) is less than 0.05 (level of significance) hence, we reject the
Null Hypothesis.
Part iv
Thus there are significant differences between the average return of low risk and high risk
investments.
Section 4
Part A
Table 4
sample 73
Row Labels Count of do you support proposed change?
no 75
yes 112
Grand Total 187
Part B
The sample size is 187.
The proportion of people who support the change ( ^p)= 112
187 =0.598
Paraphrase This Document
Need a fresh take? Get an instant paraphrase of this document with our AI Paraphraser
10STATISTICS
Part C
Part i
The average of the estimate is 0.6. The standard deviation is 0.0357.
The z-score is given by:
z= value−mean
standard deviation = x−μ
σ =0.598−0.6
0.0357 =−0.002
0.0357 =−0.056
Thus the z-score is -0.056
Part ii
Hence P(Z<-0.056) = 0.477671
Part iii
Expected Rank = 0.477671*1000 = 477.671 ≈ 478
Thus Expected Rank = 478.
Part D
Confidence Interval for the estimate is given by ^p ± z √ ^p∗1− ^p
n
Thus 95% CI = 0.598 ± 1.96∗ √ 0.598∗1−0.598
187 =0.598 ± 1.96∗ √ 0.598∗0.402
187
¿ 0.598 ± 0.035854
The lower limit = 0.562146
The Upper limit = 0.633854
Section 5
Table 5: My Data
Type of Customer
Number of Orders
Placed
Corporate 200
Small Business 26
Small Business 32
Corporate 150
Corporate 126
11STATISTICS
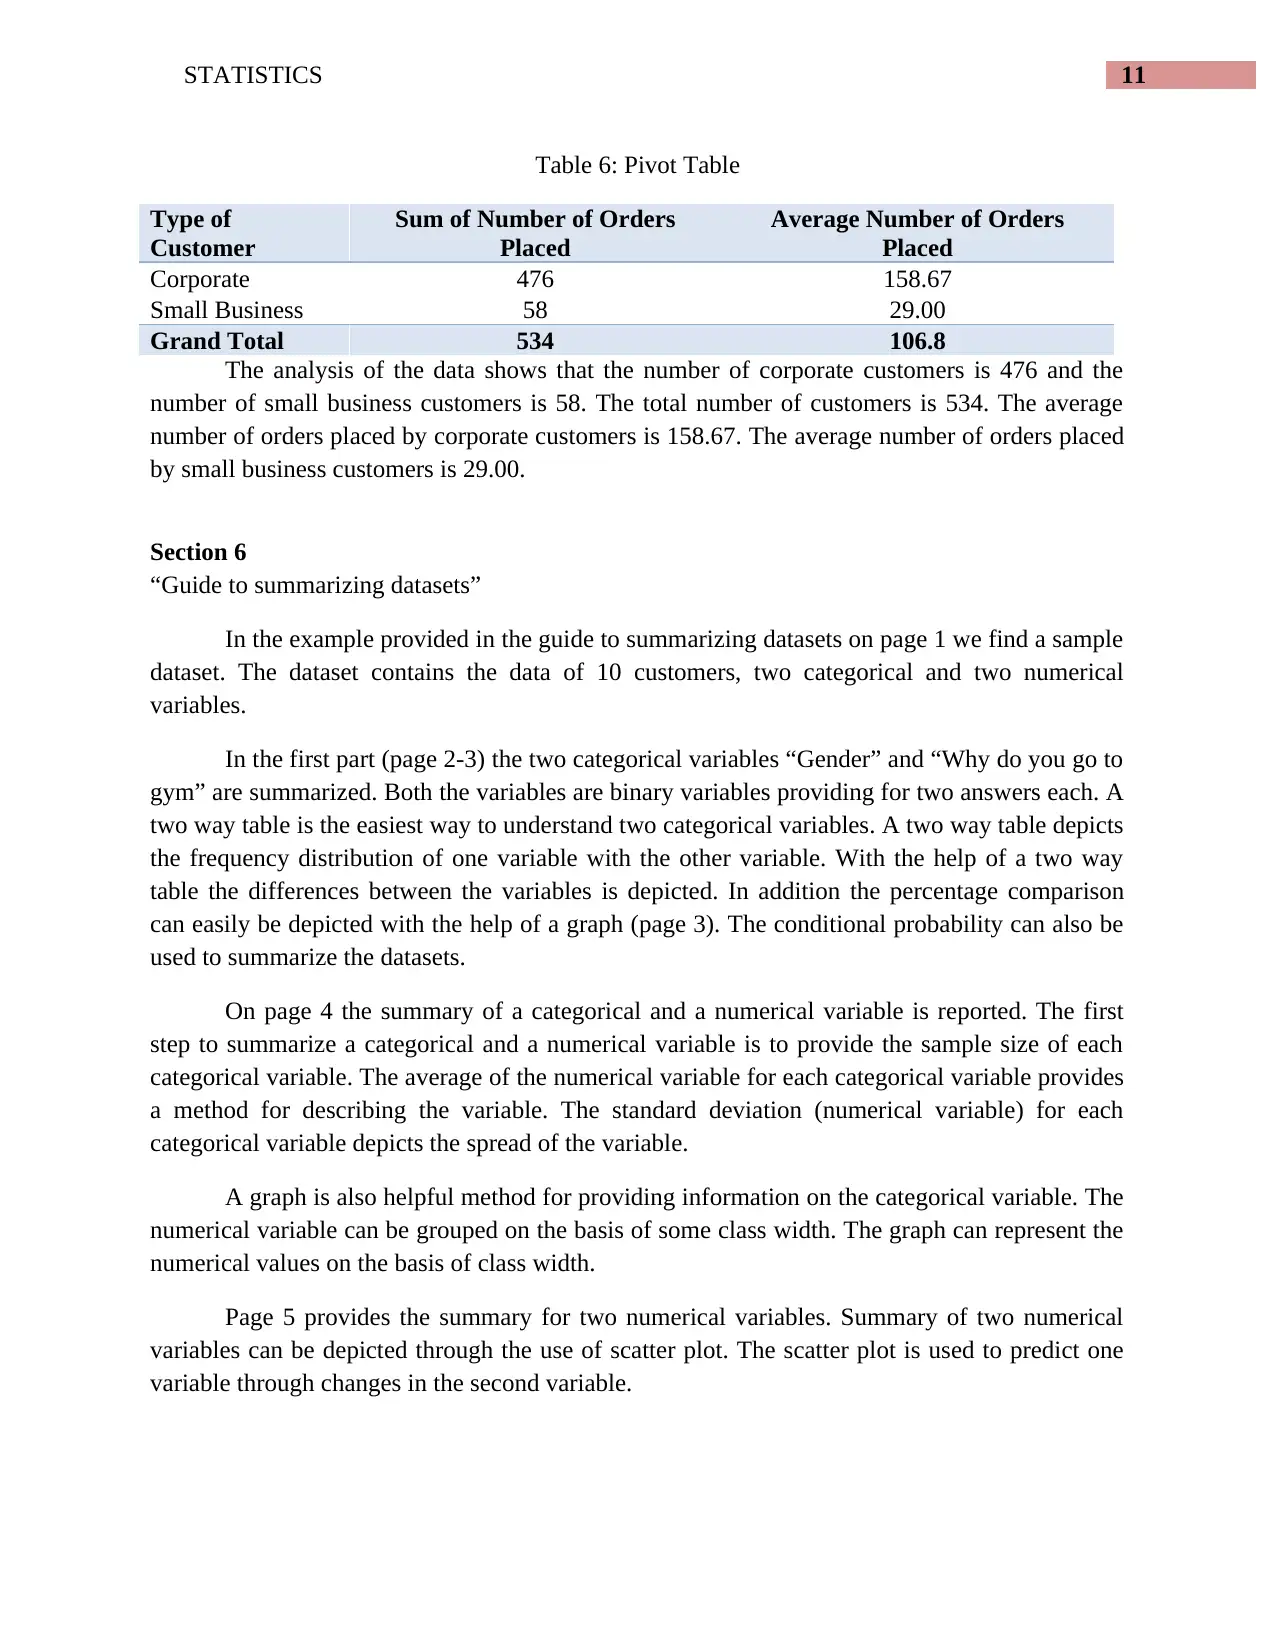
Table 6: Pivot Table
Type of
Customer
Sum of Number of Orders
Placed
Average Number of Orders
Placed
Corporate 476 158.67
Small Business 58 29.00
Grand Total 534 106.8
The analysis of the data shows that the number of corporate customers is 476 and the
number of small business customers is 58. The total number of customers is 534. The average
number of orders placed by corporate customers is 158.67. The average number of orders placed
by small business customers is 29.00.
Section 6
“Guide to summarizing datasets”
In the example provided in the guide to summarizing datasets on page 1 we find a sample
dataset. The dataset contains the data of 10 customers, two categorical and two numerical
variables.
In the first part (page 2-3) the two categorical variables “Gender” and “Why do you go to
gym” are summarized. Both the variables are binary variables providing for two answers each. A
two way table is the easiest way to understand two categorical variables. A two way table depicts
the frequency distribution of one variable with the other variable. With the help of a two way
table the differences between the variables is depicted. In addition the percentage comparison
can easily be depicted with the help of a graph (page 3). The conditional probability can also be
used to summarize the datasets.
On page 4 the summary of a categorical and a numerical variable is reported. The first
step to summarize a categorical and a numerical variable is to provide the sample size of each
categorical variable. The average of the numerical variable for each categorical variable provides
a method for describing the variable. The standard deviation (numerical variable) for each
categorical variable depicts the spread of the variable.
A graph is also helpful method for providing information on the categorical variable. The
numerical variable can be grouped on the basis of some class width. The graph can represent the
numerical values on the basis of class width.
Page 5 provides the summary for two numerical variables. Summary of two numerical
variables can be depicted through the use of scatter plot. The scatter plot is used to predict one
variable through changes in the second variable.
⊘ This is a preview!⊘
Do you want full access?
Subscribe today to unlock all pages.
Trusted by 1+ million students worldwide
1 out of 12
Related Documents


Your All-in-One AI-Powered Toolkit for Academic Success.
+13062052269
info@desklib.com
Available 24*7 on WhatsApp / Email
![[object Object]](/_next/static/media/star-bottom.7253800d.svg)
Unlock your academic potential
Copyright © 2020–2026 A2Z Services. All Rights Reserved. Developed and managed by ZUCOL.