Bus105 Computing Assignment: Statistical Analysis in Finance
VerifiedAdded on 2020/04/01
|9
|995
|44
AI Summary
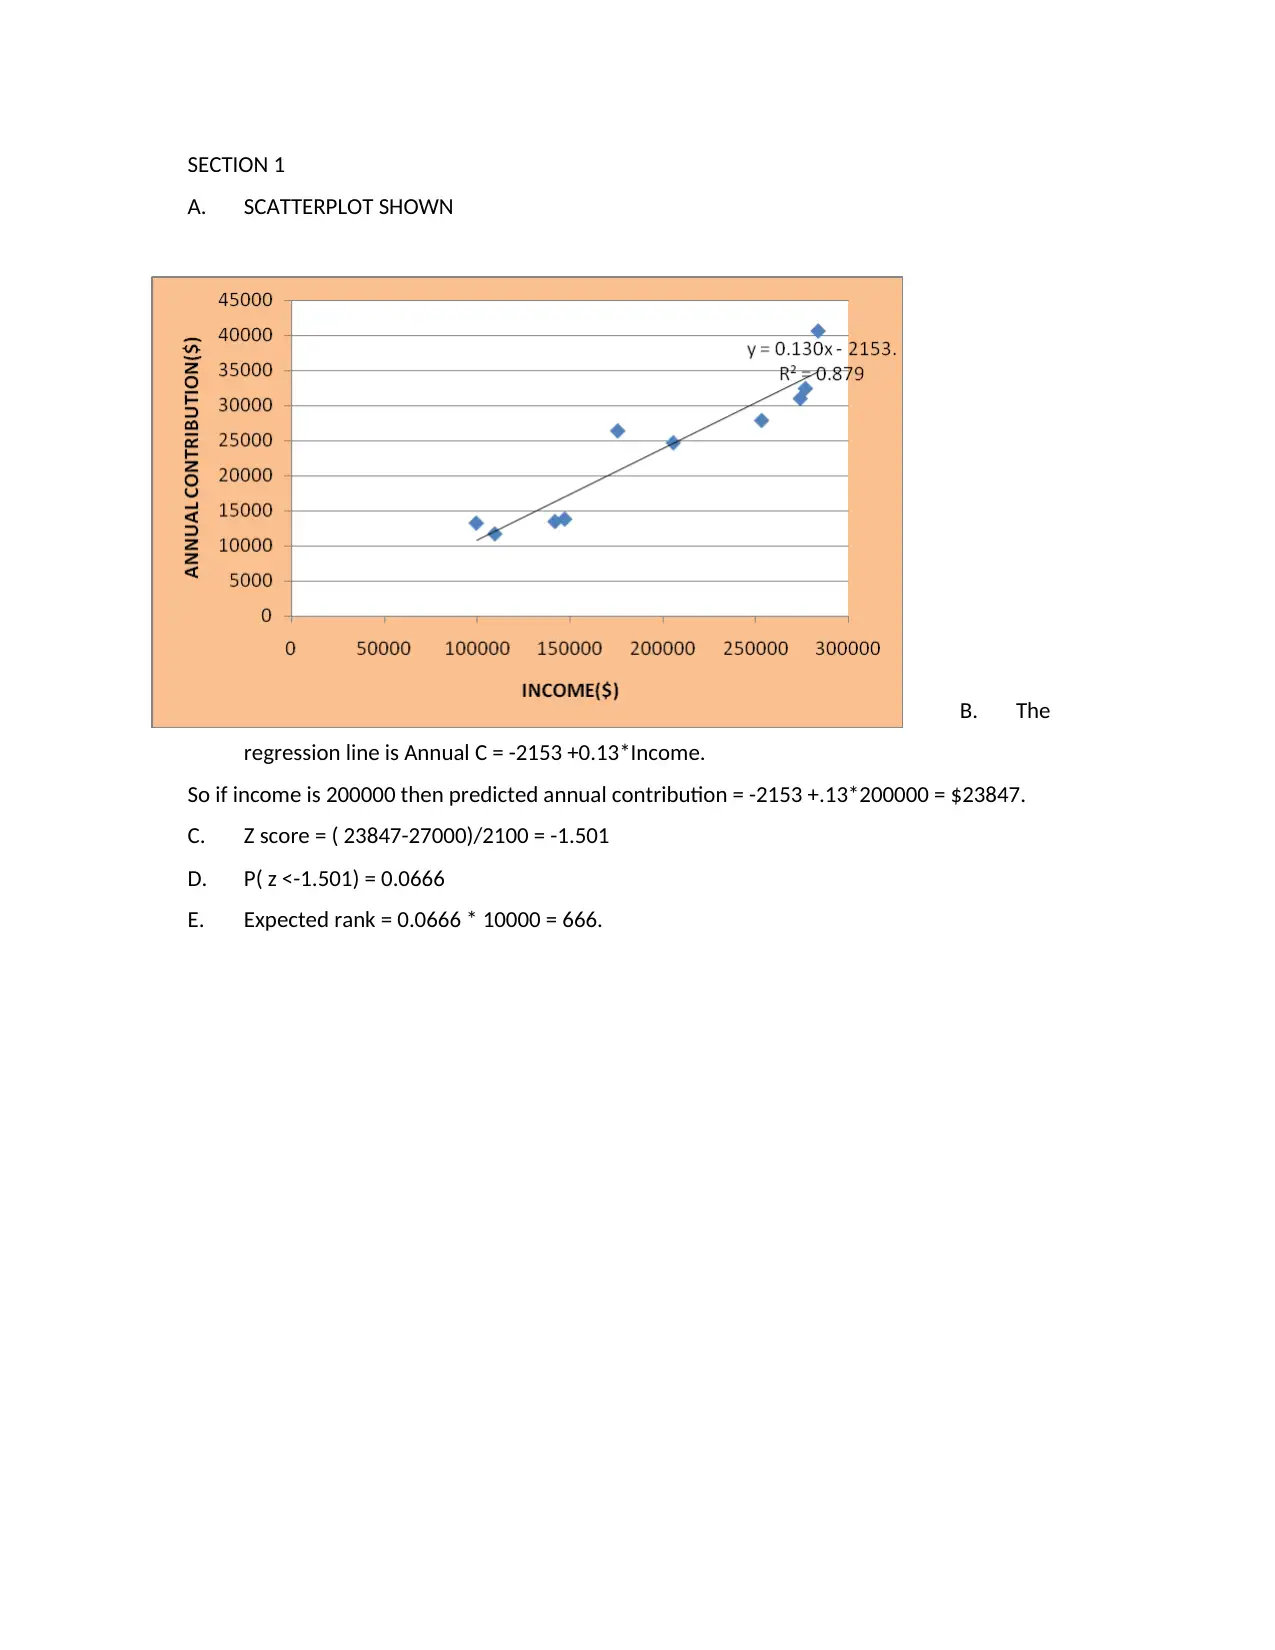
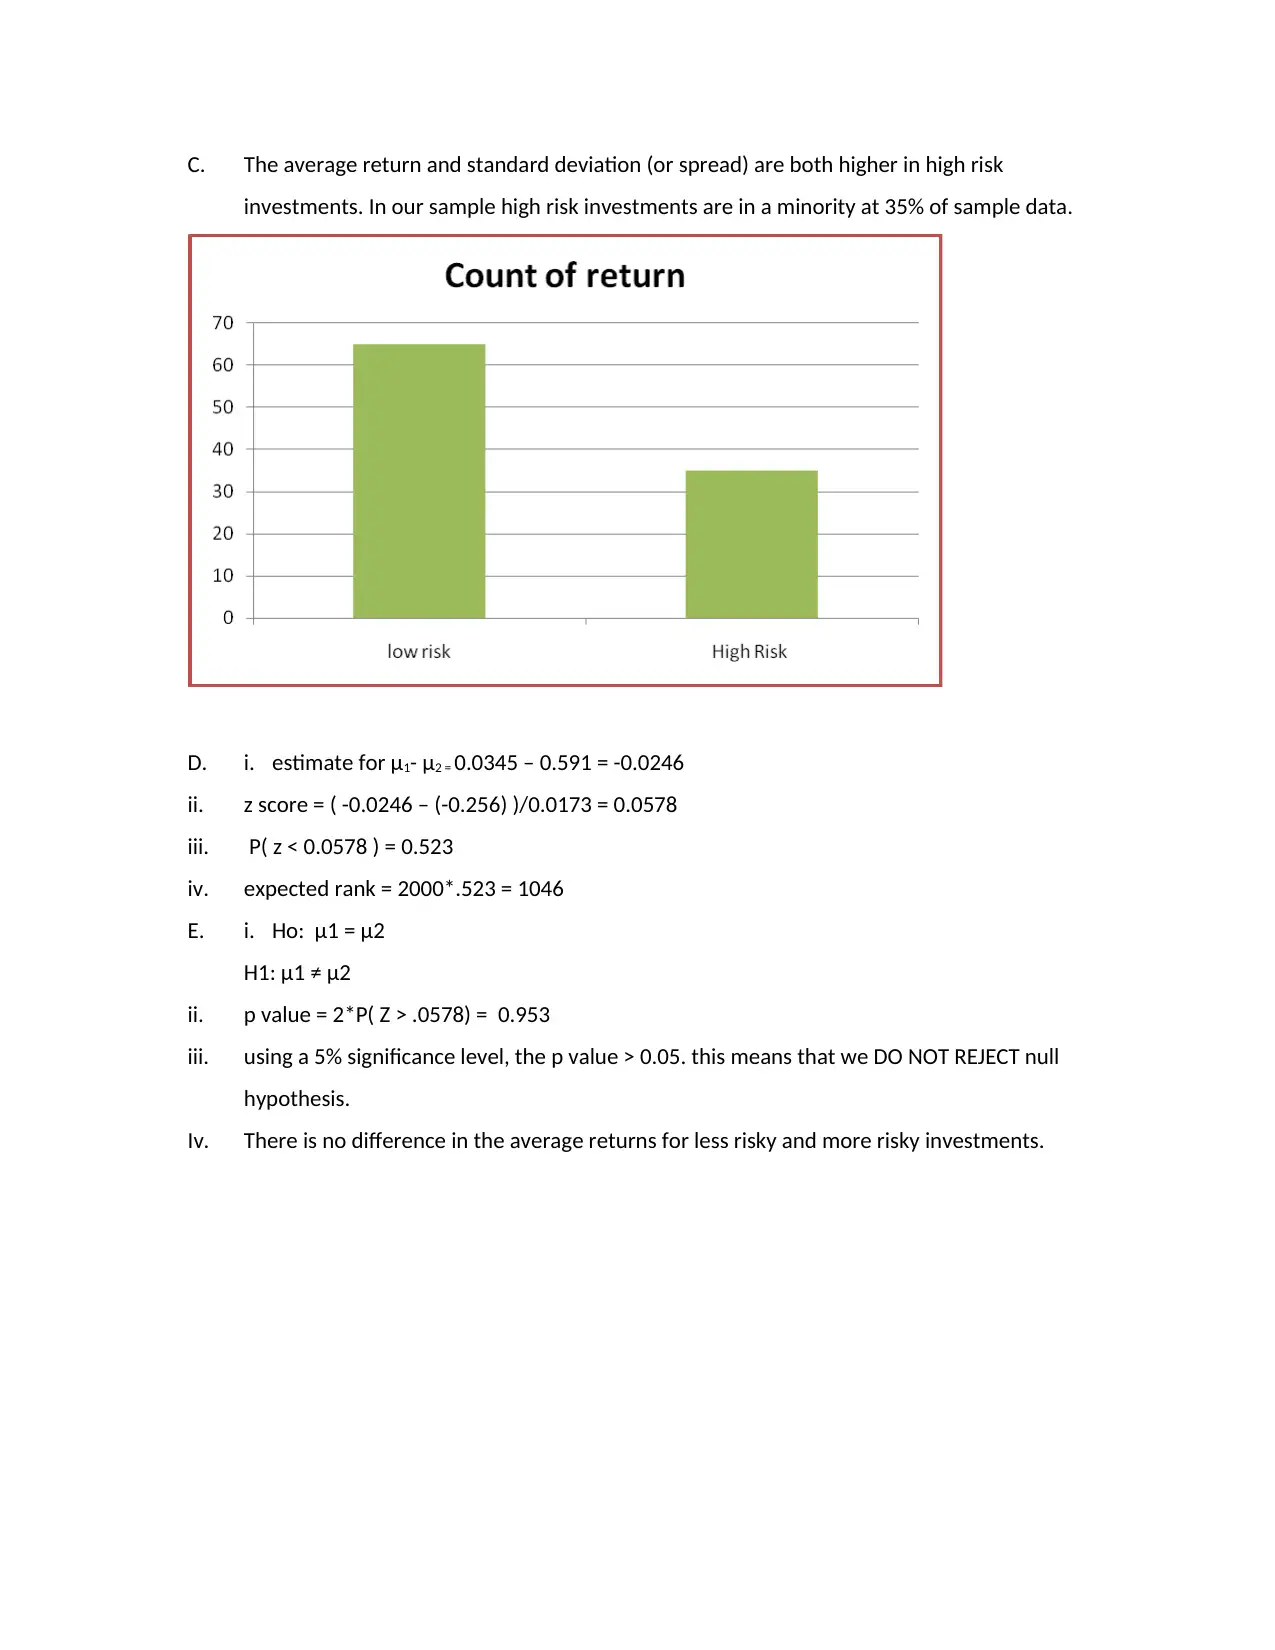
The Bus 105 computing assignment from the second semester of 2017 focuses on applying statistical methods in finance. Section 1 covers regression analysis where predictions are made based on income levels. Z-scores and p-values are computed for probability assessments. In Section 2, hypothesis testing is used to compare sample proportions with population parameters, employing confidence intervals. Section 3 awaits instructor-provided data samples. Finally, Section 6 discusses the importance of mean and standard deviation in finance, emphasizing their role in risk and return analysis. Statistical tools provide a snapshot view essential for financial planning and investment decisions.


1 out of 9


Your All-in-One AI-Powered Toolkit for Academic Success.
+13062052269
info@desklib.com
Available 24*7 on WhatsApp / Email
![[object Object]](/_next/static/media/star-bottom.7253800d.svg)
Copyright © 2020–2026 A2Z Services. All Rights Reserved. Developed and managed by ZUCOL.