Seasonal Sales Analysis and Product Performance
VerifiedAdded on 2020/03/16
|14
|2578
|66
AI Summary
This assignment involves analyzing a dataset of sales information to understand seasonal trends in revenue and profitability. The analysis includes comparing net sales across different seasons using ANOVA, identifying high and low-performing product classes, and investigating the relationship between month and gross profit. The report also offers recommendations based on the findings, such as discontinuing underperforming products.
Contribute Materials
Your contribution can guide someone’s learning journey. Share your
documents today.
BUS501 - Business Analytics and Statistics
Name:
Lecturer name:
7th October 2017
Name:
Lecturer name:
7th October 2017
Secure Best Marks with AI Grader
Need help grading? Try our AI Grader for instant feedback on your assignments.
Table of Contents
1. Introduction..............................................................................................................................3
2. Problem definition and business intelligence required.............................................................4
3. Selected analytics methods and technical analysis...................................................................5
4. Results and findings.................................................................................................................5
Analysis 1: What are the top/worst selling products in terms of sales?.......................................5
Analysis 2: Is there a difference in payments methods?..............................................................7
Hypothesis 1:............................................................................................................................7
Hypothesis 2:............................................................................................................................8
Analysis 3: Are the differences in sales performance based on where the product is located in
the shop?......................................................................................................................................8
Hypothesis 4:............................................................................................................................9
Analysis 4: Is there a difference in sales and gross profits between different months of the
year?.............................................................................................................................................9
Hypothesis 5:............................................................................................................................9
Hypothesis 6:..........................................................................................................................10
Analysis 5: Are their differences in sales performance between different seasons?.................11
5. Discussion of the results and recommendations.....................................................................12
Table 1: Top 10 best-selling products.............................................................................................6
Table 2: Top 10 worst performing products....................................................................................6
Table 3: t-Test: Two-Sample Assuming Equal Variances..............................................................7
Table 4: t-Test: Two-Sample Assuming Equal Variances..............................................................8
Table 5: Analysis of variance (ANOVA) for the total sales versus product location.....................9

1. Introduction
Key performance, operational, group or at individual level is a noteworthy goal of any
organization. In order to appreciate the degree at which organizational objectives have been
accomplished and business techniques have been successful, it is important to create a
benchmark of an integrated system that can tell at any given time the performance of the
business. In addition, any decision made by the management ought to be founded on a decent
learning of the current condition of the business, which isn't conceivable without performance
benchmarks. It is for this reason the CEO of the Good Harvest firm, with full knowledge of
the critical need to learn from data tasked the data analyst to present him with analysis of the
company’s one-year data. Good Harvest is a company dealing in organic farm products. The
company is involved in growing and selling directly to their customers through home delivery
program.
The major concern of the CEO is in regard to the sales performance of the company.
However, it has to be noted that sales performance is a dependant of multiple factors. This
report will therefore be presenting the learnings obtained from the analysed data.
2. Problem definition and business intelligence required
The major concern of the CEO is analyzing the sales performance of the organization-this is
the main objective. However, to answer this objective, a number of research questions listed
below need to answered;
a) What are the top/worst selling products in terms of sales?
b) Is there a difference in payments methods?
c) Are the differences in sales performance based on where the product is located in the
Secure Best Marks with AI Grader
Need help grading? Try our AI Grader for instant feedback on your assignments.
shop? How does this effect both profits and revenue?
d) Is there a difference in sales and gross profits between different months of the year?
e) Are their differences in sales performance between different seasons?
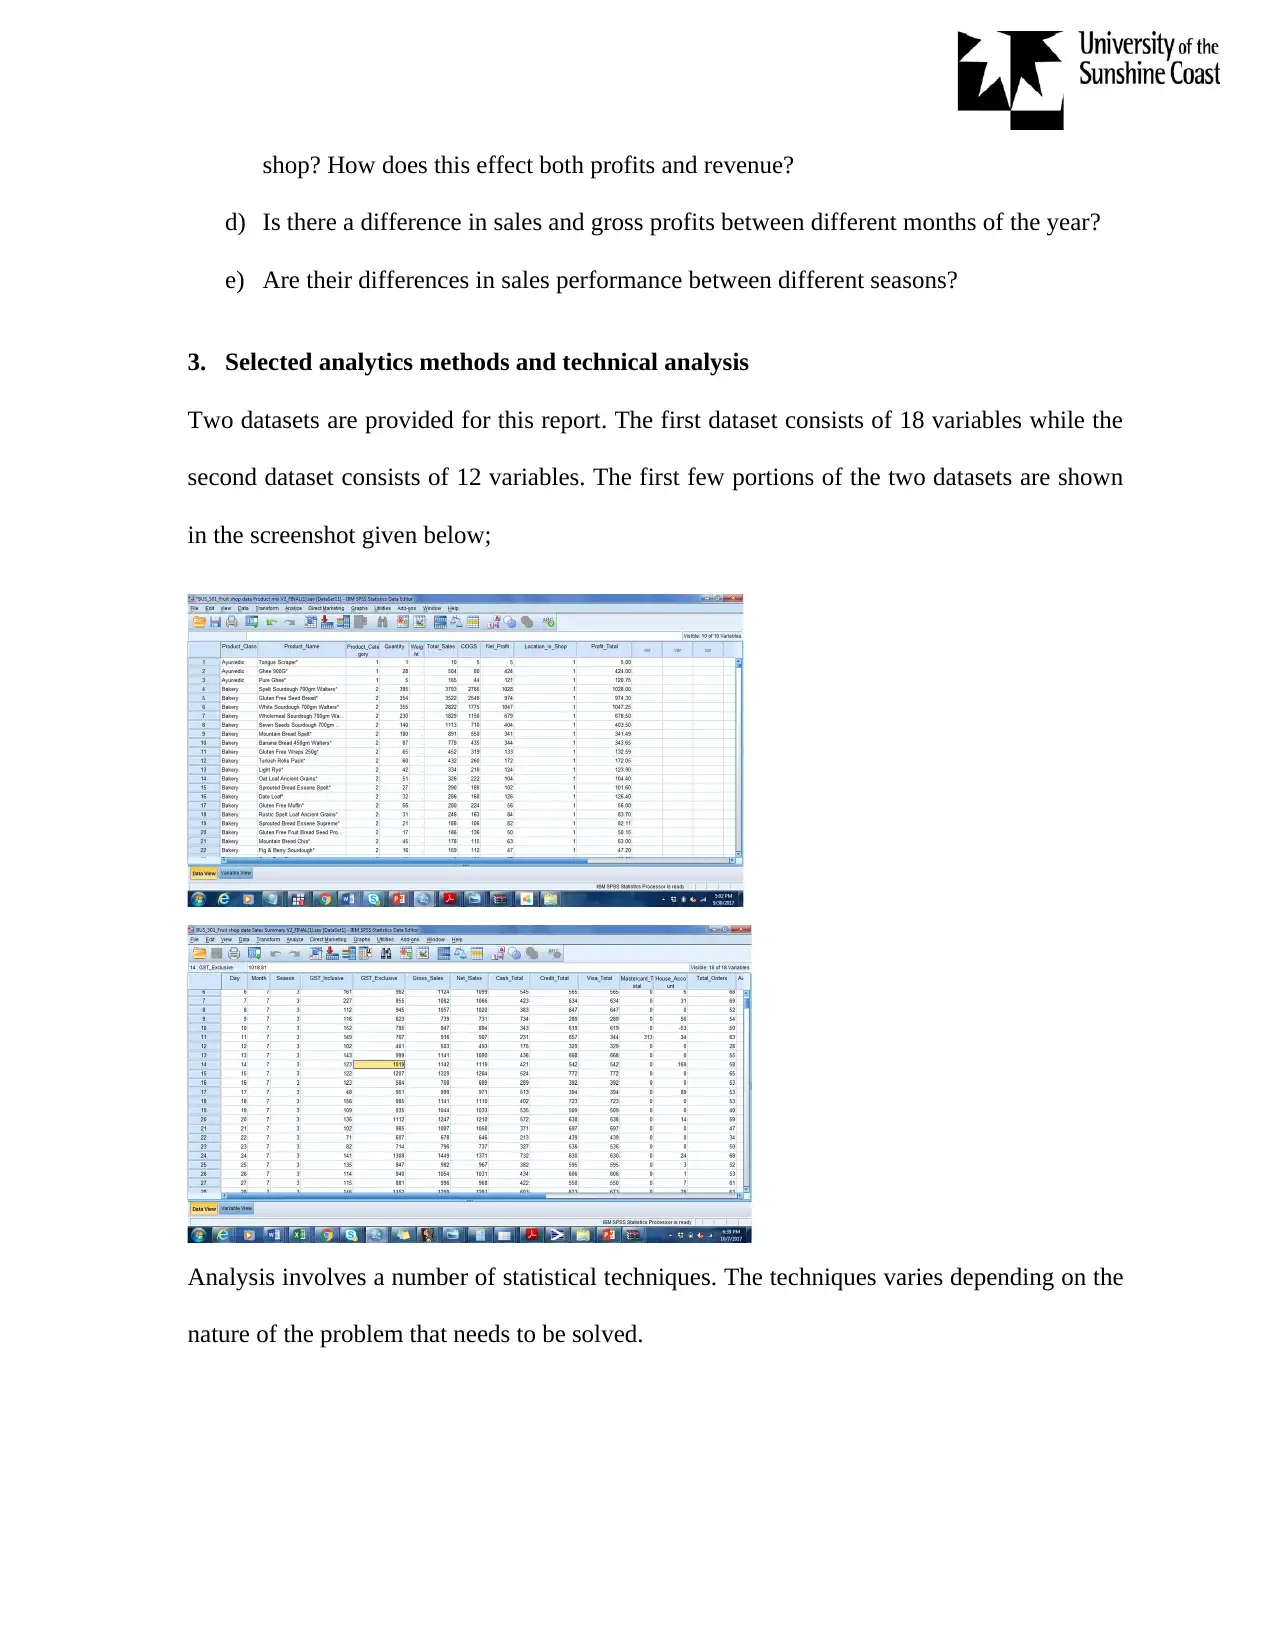
3. Selected analytics methods and technical analysis
Two datasets are provided for this report. The first dataset consists of 18 variables while the
second dataset consists of 12 variables. The first few portions of the two datasets are shown
in the screenshot given below;
Analysis involves a number of statistical techniques. The techniques varies depending on the
nature of the problem that needs to be solved.
d) Is there a difference in sales and gross profits between different months of the year?
e) Are their differences in sales performance between different seasons?
3. Selected analytics methods and technical analysis
Two datasets are provided for this report. The first dataset consists of 18 variables while the
second dataset consists of 12 variables. The first few portions of the two datasets are shown
in the screenshot given below;
Analysis involves a number of statistical techniques. The techniques varies depending on the
nature of the problem that needs to be solved.
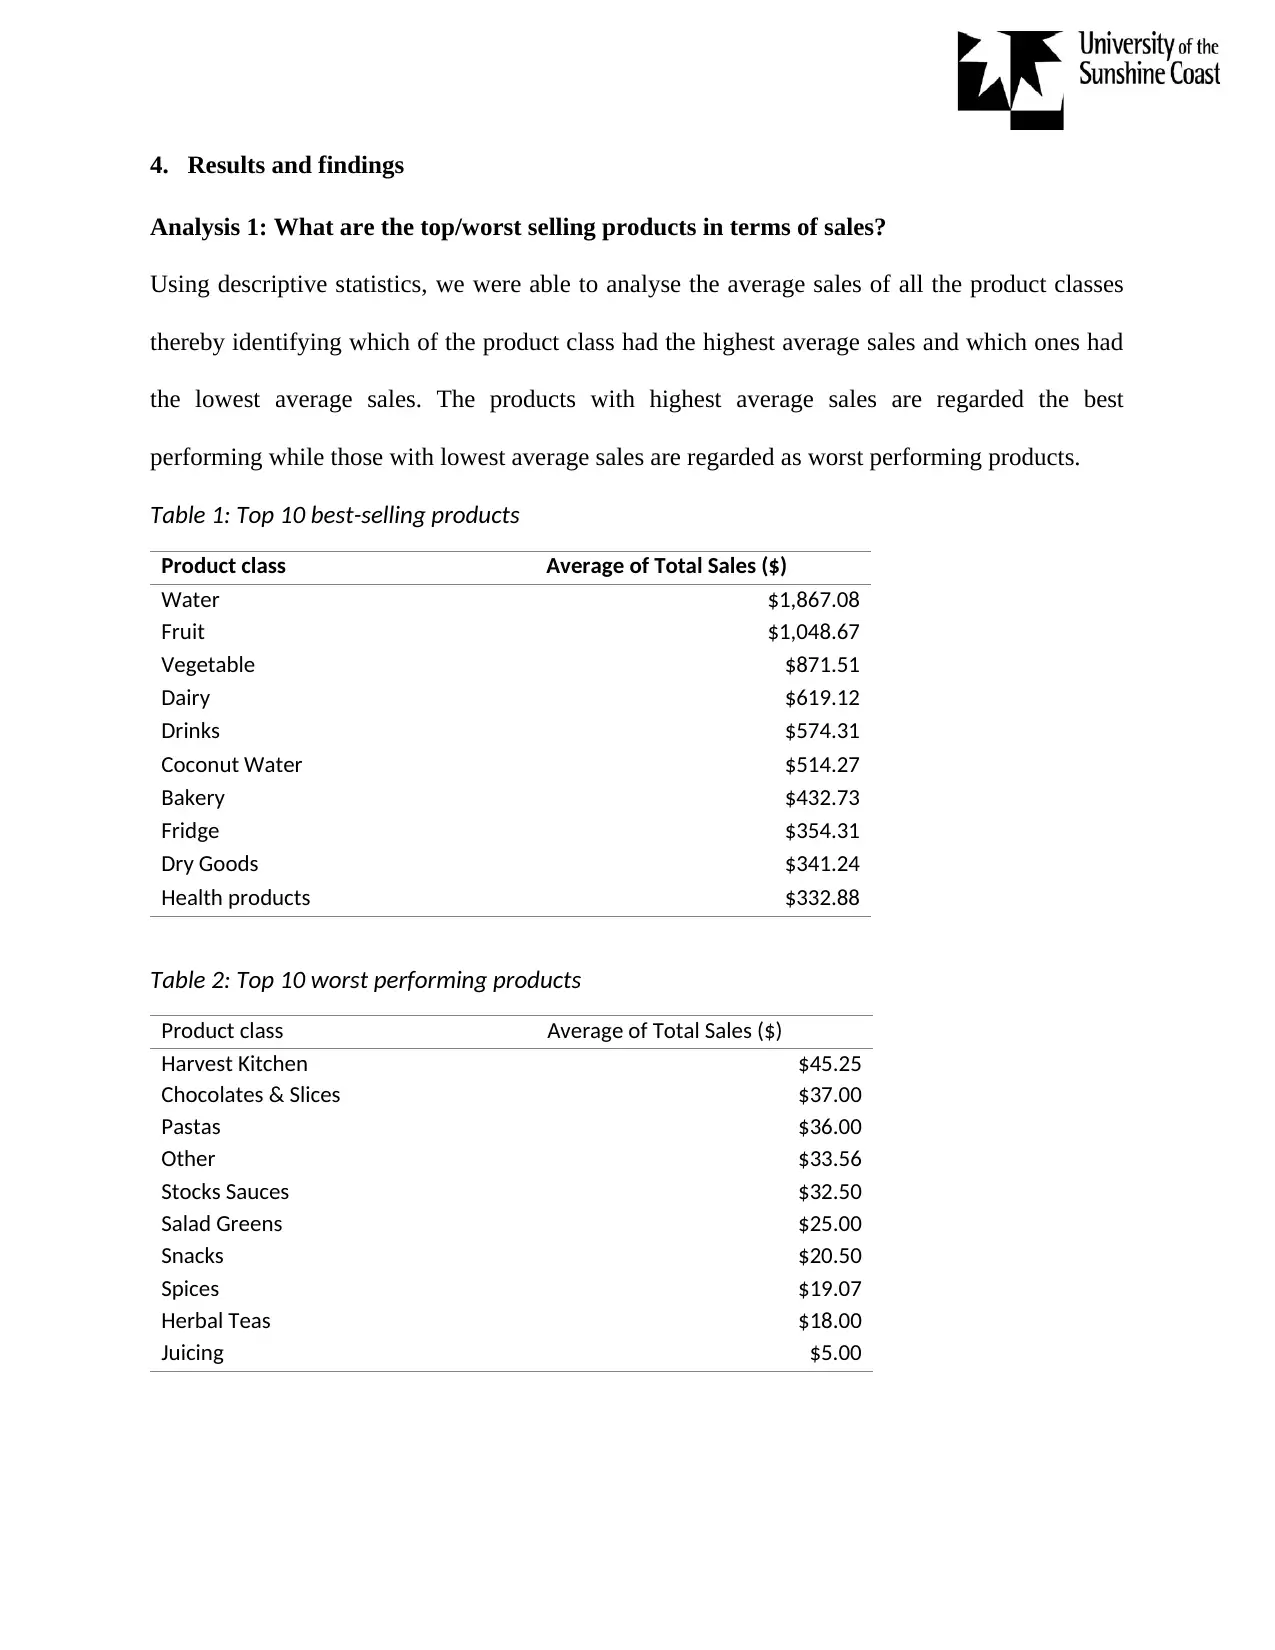
4. Results and findings
Analysis 1: What are the top/worst selling products in terms of sales?
Using descriptive statistics, we were able to analyse the average sales of all the product classes
thereby identifying which of the product class had the highest average sales and which ones had
the lowest average sales. The products with highest average sales are regarded the best
performing while those with lowest average sales are regarded as worst performing products.
Table 1: Top 10 best-selling products
Product class Average of Total Sales ($)
Water $1,867.08
Fruit $1,048.67
Vegetable $871.51
Dairy $619.12
Drinks $574.31
Coconut Water $514.27
Bakery $432.73
Fridge $354.31
Dry Goods $341.24
Health products $332.88
Table 2: Top 10 worst performing products
Product class Average of Total Sales ($)
Harvest Kitchen $45.25
Chocolates & Slices $37.00
Pastas $36.00
Other $33.56
Stocks Sauces $32.50
Salad Greens $25.00
Snacks $20.50
Spices $19.07
Herbal Teas $18.00
Juicing $5.00
The top 10 best performing products had averages sales amounting to over $300 while the worst
performing products average sales being less than $50. Some of the best performing products
include health products, dry goods, water, fruit, and vegetables among others (see table 1 above).
Worst performing products included spices, juicing, herbal teas, pastas and snacks among others
(see table 2 above).
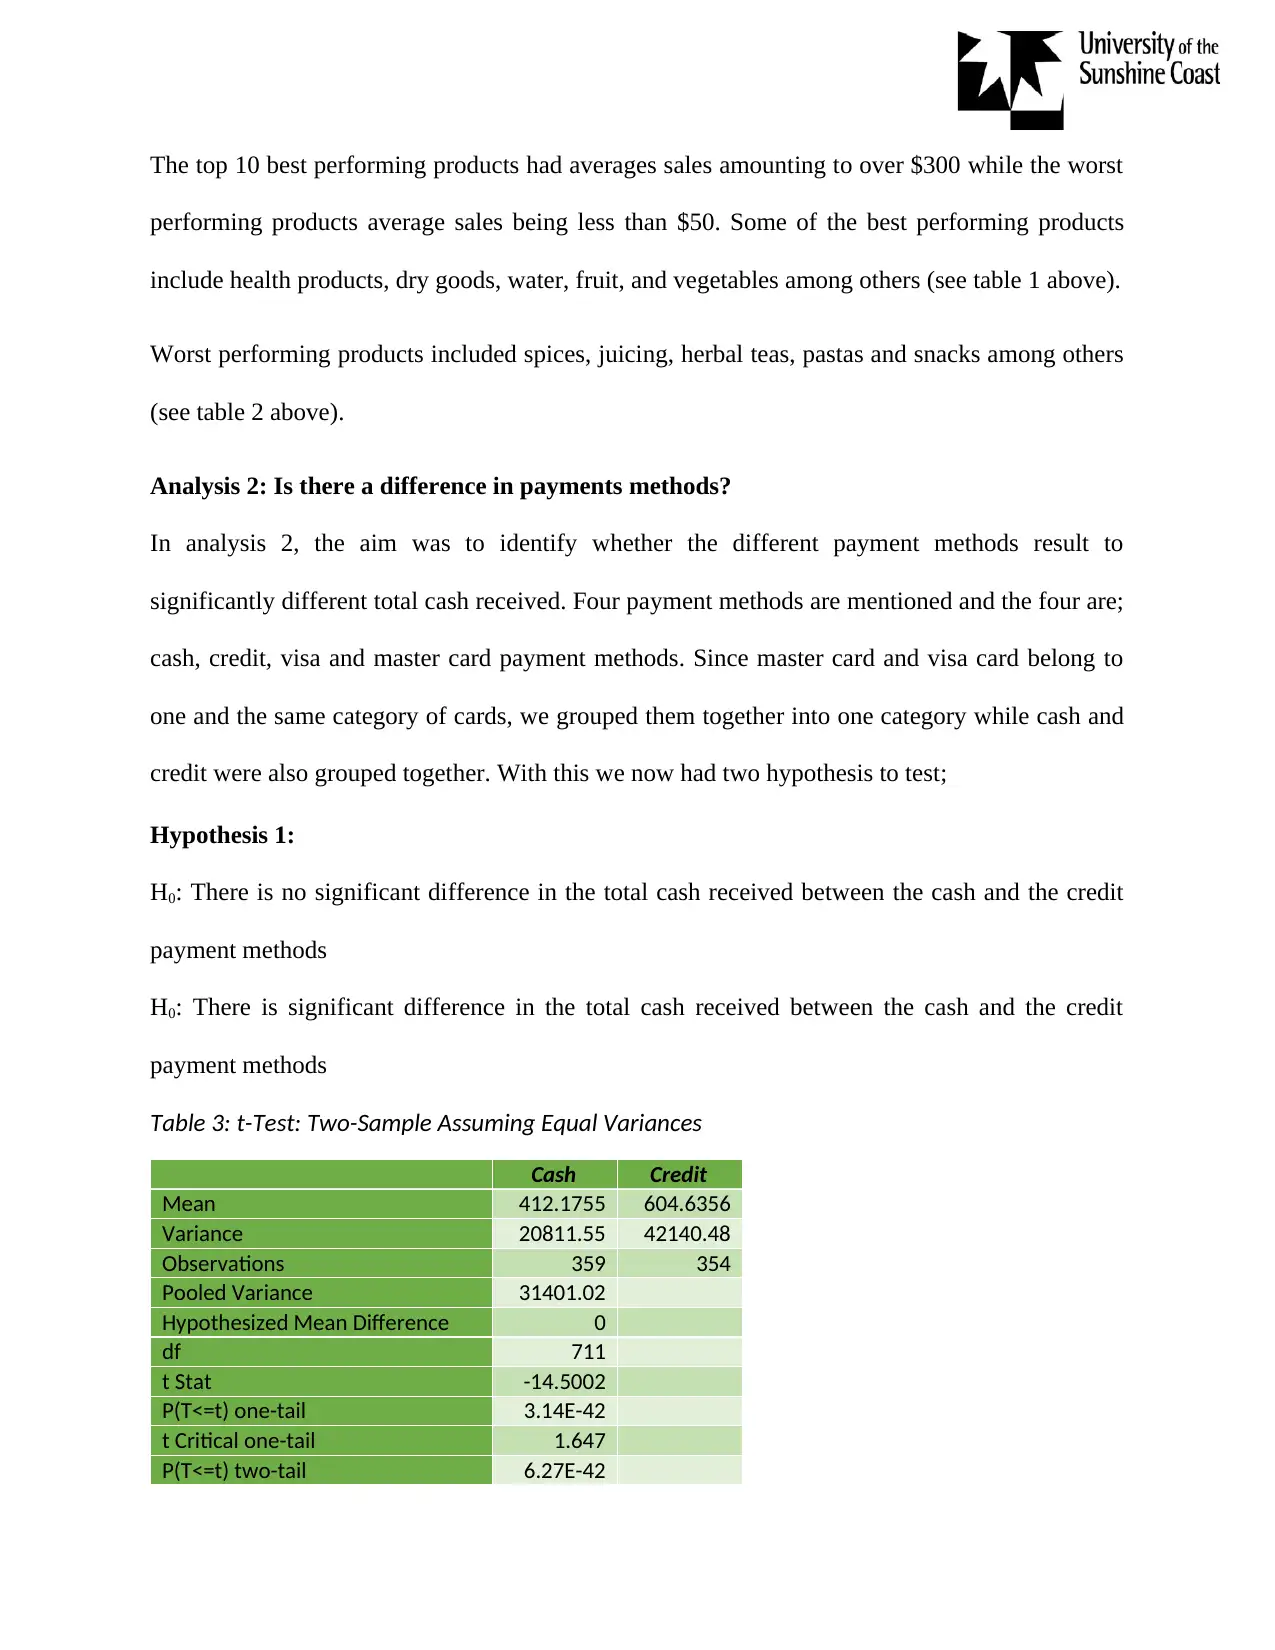
Analysis 2: Is there a difference in payments methods?
In analysis 2, the aim was to identify whether the different payment methods result to
significantly different total cash received. Four payment methods are mentioned and the four are;
cash, credit, visa and master card payment methods. Since master card and visa card belong to
one and the same category of cards, we grouped them together into one category while cash and
credit were also grouped together. With this we now had two hypothesis to test;
Hypothesis 1:
H0: There is no significant difference in the total cash received between the cash and the credit
payment methods
H0: There is significant difference in the total cash received between the cash and the credit
payment methods
Table 3: t-Test: Two-Sample Assuming Equal Variances
Cash Credit
Mean 412.1755 604.6356
Variance 20811.55 42140.48
Observations 359 354
Pooled Variance 31401.02
Hypothesized Mean Difference 0
df 711
t Stat -14.5002
P(T<=t) one-tail 3.14E-42
t Critical one-tail 1.647
P(T<=t) two-tail 6.27E-42
performing products average sales being less than $50. Some of the best performing products
include health products, dry goods, water, fruit, and vegetables among others (see table 1 above).
Worst performing products included spices, juicing, herbal teas, pastas and snacks among others
(see table 2 above).
Analysis 2: Is there a difference in payments methods?
In analysis 2, the aim was to identify whether the different payment methods result to
significantly different total cash received. Four payment methods are mentioned and the four are;
cash, credit, visa and master card payment methods. Since master card and visa card belong to
one and the same category of cards, we grouped them together into one category while cash and
credit were also grouped together. With this we now had two hypothesis to test;
Hypothesis 1:
H0: There is no significant difference in the total cash received between the cash and the credit
payment methods
H0: There is significant difference in the total cash received between the cash and the credit
payment methods
Table 3: t-Test: Two-Sample Assuming Equal Variances
Cash Credit
Mean 412.1755 604.6356
Variance 20811.55 42140.48
Observations 359 354
Pooled Variance 31401.02
Hypothesized Mean Difference 0
df 711
t Stat -14.5002
P(T<=t) one-tail 3.14E-42
t Critical one-tail 1.647
P(T<=t) two-tail 6.27E-42
Paraphrase This Document
Need a fresh take? Get an instant paraphrase of this document with our AI Paraphraser
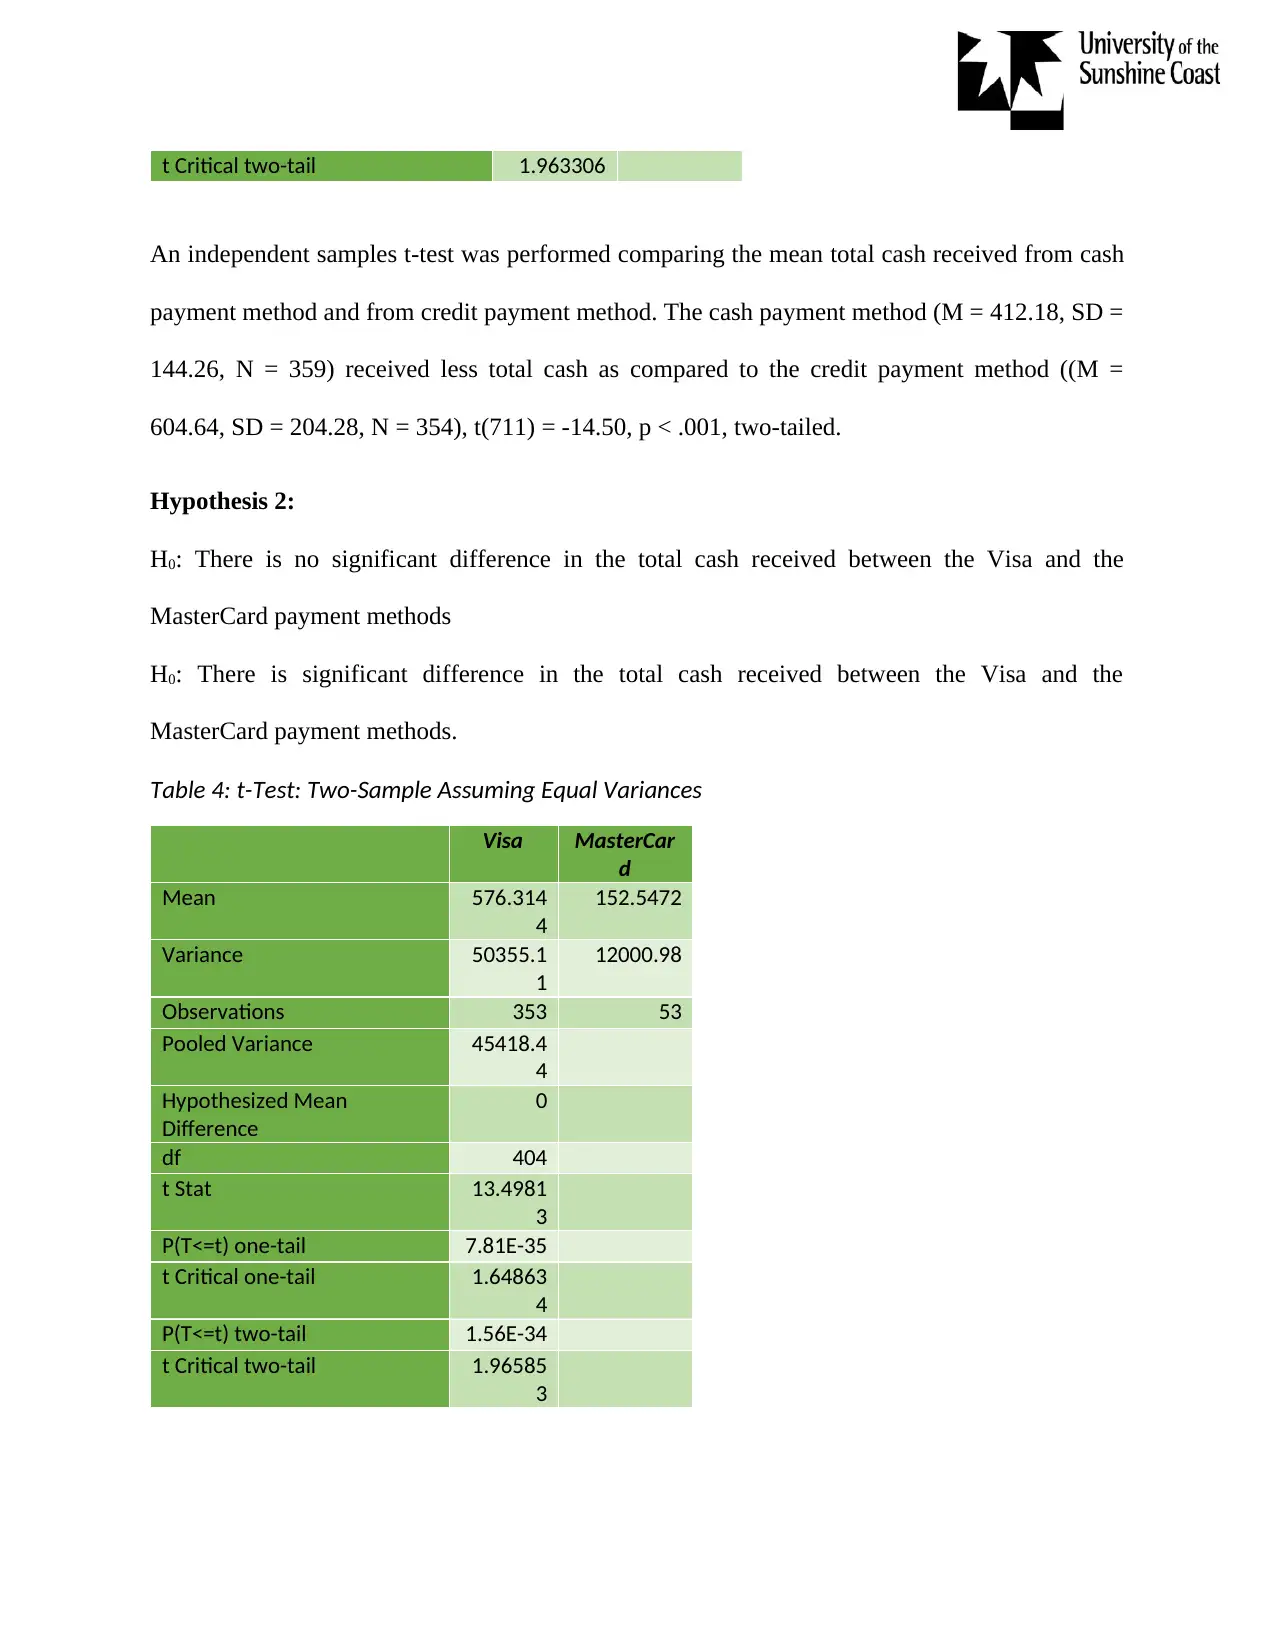
t Critical two-tail 1.963306
An independent samples t-test was performed comparing the mean total cash received from cash
payment method and from credit payment method. The cash payment method (M = 412.18, SD =
144.26, N = 359) received less total cash as compared to the credit payment method ((M =
604.64, SD = 204.28, N = 354), t(711) = -14.50, p < .001, two-tailed.
Hypothesis 2:
H0: There is no significant difference in the total cash received between the Visa and the
MasterCard payment methods
H0: There is significant difference in the total cash received between the Visa and the
MasterCard payment methods.
Table 4: t-Test: Two-Sample Assuming Equal Variances
Visa MasterCar
d
Mean 576.314
4
152.5472
Variance 50355.1
1
12000.98
Observations 353 53
Pooled Variance 45418.4
4
Hypothesized Mean
Difference
0
df 404
t Stat 13.4981
3
P(T<=t) one-tail 7.81E-35
t Critical one-tail 1.64863
4
P(T<=t) two-tail 1.56E-34
t Critical two-tail 1.96585
3
An independent samples t-test was performed comparing the mean total cash received from visa
card payment method and from master card payment method. The visa card payment method (M
= 576.31, SD = 224.40, N = 353) received less total cash as compared to the MasterCard
payment method (M = 152.55, SD = 109.55, N = 53) at the .05 level of significance (t = 13.50, df
= 404, p < .05, 95% CI for mean difference 365.02 to 485.48).
Analysis 3: Are the differences in sales performance based on where the product is located
in the shop?
The third analysis was conducted to check whether differences in sales performance exists
depending on where the product is located in the shop. The hypothesis tested is given below;
Hypothesis 4:
H0: There is no significant difference in the mean total sales between the different product
locations in the shop
H0: There is significant difference in the mean total sales between the different product locations
in the shop.
Table 5: Analysis of variance (ANOVA) for the total sales versus product location
Total Sales ($)
Sum of
Squares
df Mean Square F Sig.
Between Groups 134299725 4 33574931 37.176 .000
Within Groups 929333381 1029 903142
Total 1063633106 1033
A one-way analysis of variance (ANOVA) was conducted to compare the mean total sales
depending on the product location within the shop. Table 5 presents the results of the ANOVA
test and as can be seen, the null hypothesis is rejected at 5% level of significance (p-value <
0.05). By rejecting the null hypothesis it means that the mean total sales is significantly different
for the different product locations within the shop.
Analysis 4: Is there a difference in sales and gross profits between different months of the
year?
How does the average sales and gross profits compare for the different months of the year? This
is the question we sought to answer for this analysis. The hypothesis tested is given below ;
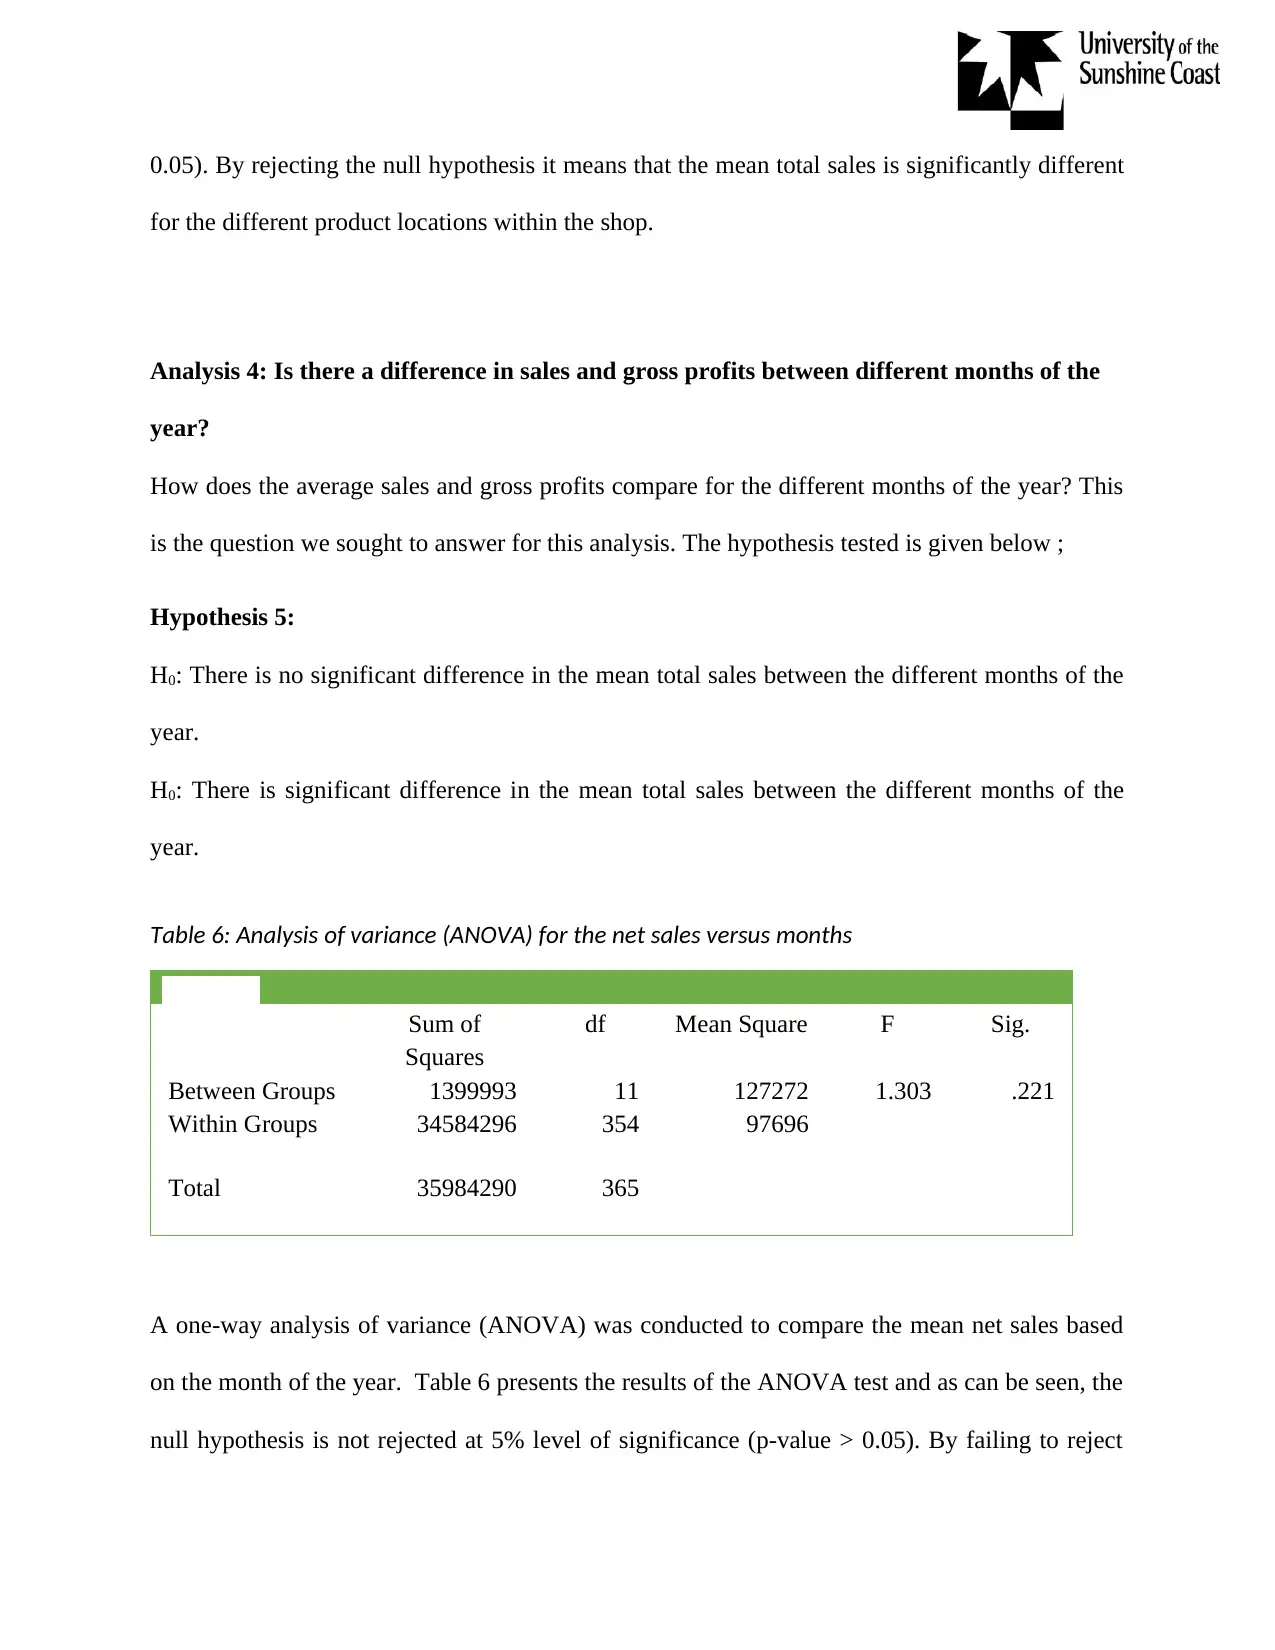
Hypothesis 5:
H0: There is no significant difference in the mean total sales between the different months of the
year.
H0: There is significant difference in the mean total sales between the different months of the
year.
Table 6: Analysis of variance (ANOVA) for the net sales versus months
Net Sales
Sum of
Squares
df Mean Square F Sig.
Between Groups 1399993 11 127272 1.303 .221
Within Groups 34584296 354 97696
Total 35984290 365
A one-way analysis of variance (ANOVA) was conducted to compare the mean net sales based
on the month of the year. Table 6 presents the results of the ANOVA test and as can be seen, the
null hypothesis is not rejected at 5% level of significance (p-value > 0.05). By failing to reject
for the different product locations within the shop.
Analysis 4: Is there a difference in sales and gross profits between different months of the
year?
How does the average sales and gross profits compare for the different months of the year? This
is the question we sought to answer for this analysis. The hypothesis tested is given below ;
Hypothesis 5:
H0: There is no significant difference in the mean total sales between the different months of the
year.
H0: There is significant difference in the mean total sales between the different months of the
year.
Table 6: Analysis of variance (ANOVA) for the net sales versus months
Net Sales
Sum of
Squares
df Mean Square F Sig.
Between Groups 1399993 11 127272 1.303 .221
Within Groups 34584296 354 97696
Total 35984290 365
A one-way analysis of variance (ANOVA) was conducted to compare the mean net sales based
on the month of the year. Table 6 presents the results of the ANOVA test and as can be seen, the
null hypothesis is not rejected at 5% level of significance (p-value > 0.05). By failing to reject
Secure Best Marks with AI Grader
Need help grading? Try our AI Grader for instant feedback on your assignments.
the null hypothesis it means that the mean net sales is not significantly different for the different
months of the year.
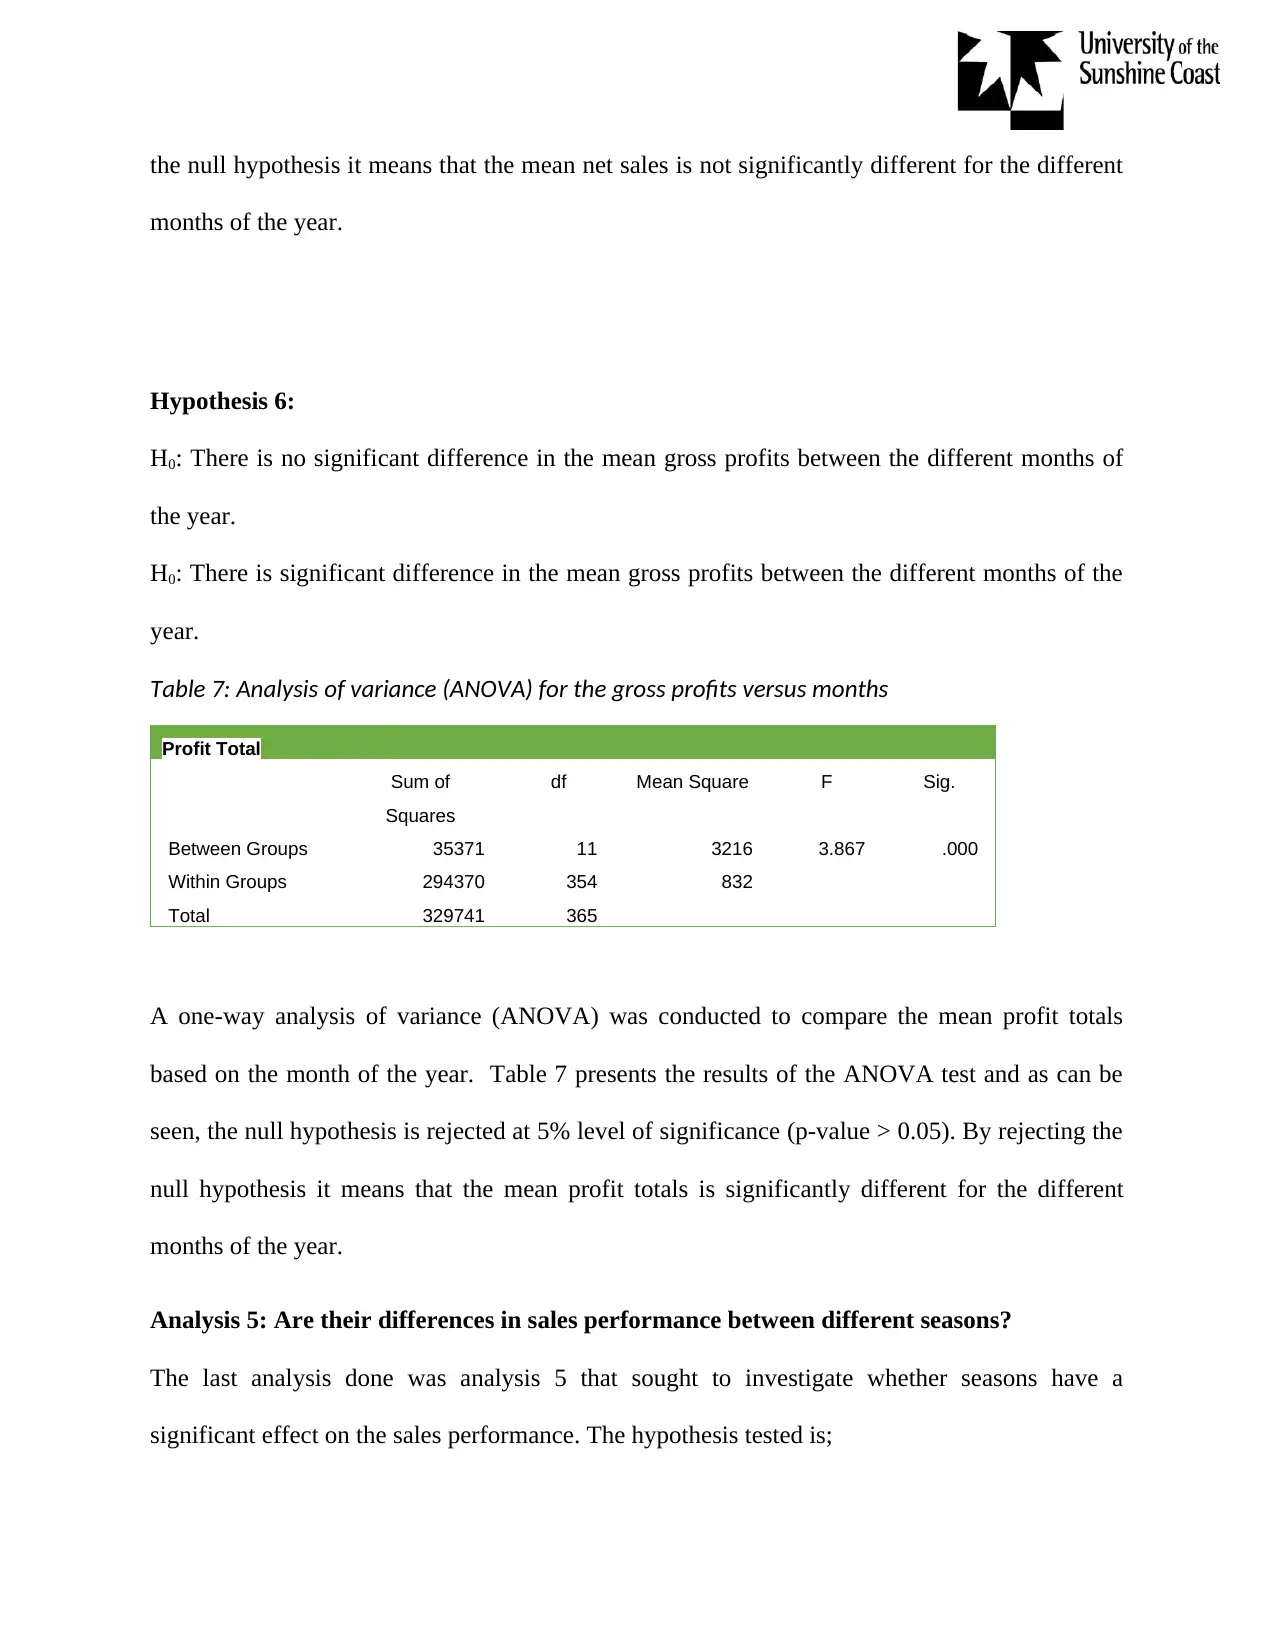
Hypothesis 6:
H0: There is no significant difference in the mean gross profits between the different months of
the year.
H0: There is significant difference in the mean gross profits between the different months of the
year.
Table 7: Analysis of variance (ANOVA) for the gross profits versus months
Profit Total
Sum of
Squares
df Mean Square F Sig.
Between Groups 35371 11 3216 3.867 .000
Within Groups 294370 354 832
Total 329741 365
A one-way analysis of variance (ANOVA) was conducted to compare the mean profit totals
based on the month of the year. Table 7 presents the results of the ANOVA test and as can be
seen, the null hypothesis is rejected at 5% level of significance (p-value > 0.05). By rejecting the
null hypothesis it means that the mean profit totals is significantly different for the different
months of the year.
Analysis 5: Are their differences in sales performance between different seasons?
The last analysis done was analysis 5 that sought to investigate whether seasons have a
significant effect on the sales performance. The hypothesis tested is;
months of the year.
Hypothesis 6:
H0: There is no significant difference in the mean gross profits between the different months of
the year.
H0: There is significant difference in the mean gross profits between the different months of the
year.
Table 7: Analysis of variance (ANOVA) for the gross profits versus months
Profit Total
Sum of
Squares
df Mean Square F Sig.
Between Groups 35371 11 3216 3.867 .000
Within Groups 294370 354 832
Total 329741 365
A one-way analysis of variance (ANOVA) was conducted to compare the mean profit totals
based on the month of the year. Table 7 presents the results of the ANOVA test and as can be
seen, the null hypothesis is rejected at 5% level of significance (p-value > 0.05). By rejecting the
null hypothesis it means that the mean profit totals is significantly different for the different
months of the year.
Analysis 5: Are their differences in sales performance between different seasons?
The last analysis done was analysis 5 that sought to investigate whether seasons have a
significant effect on the sales performance. The hypothesis tested is;
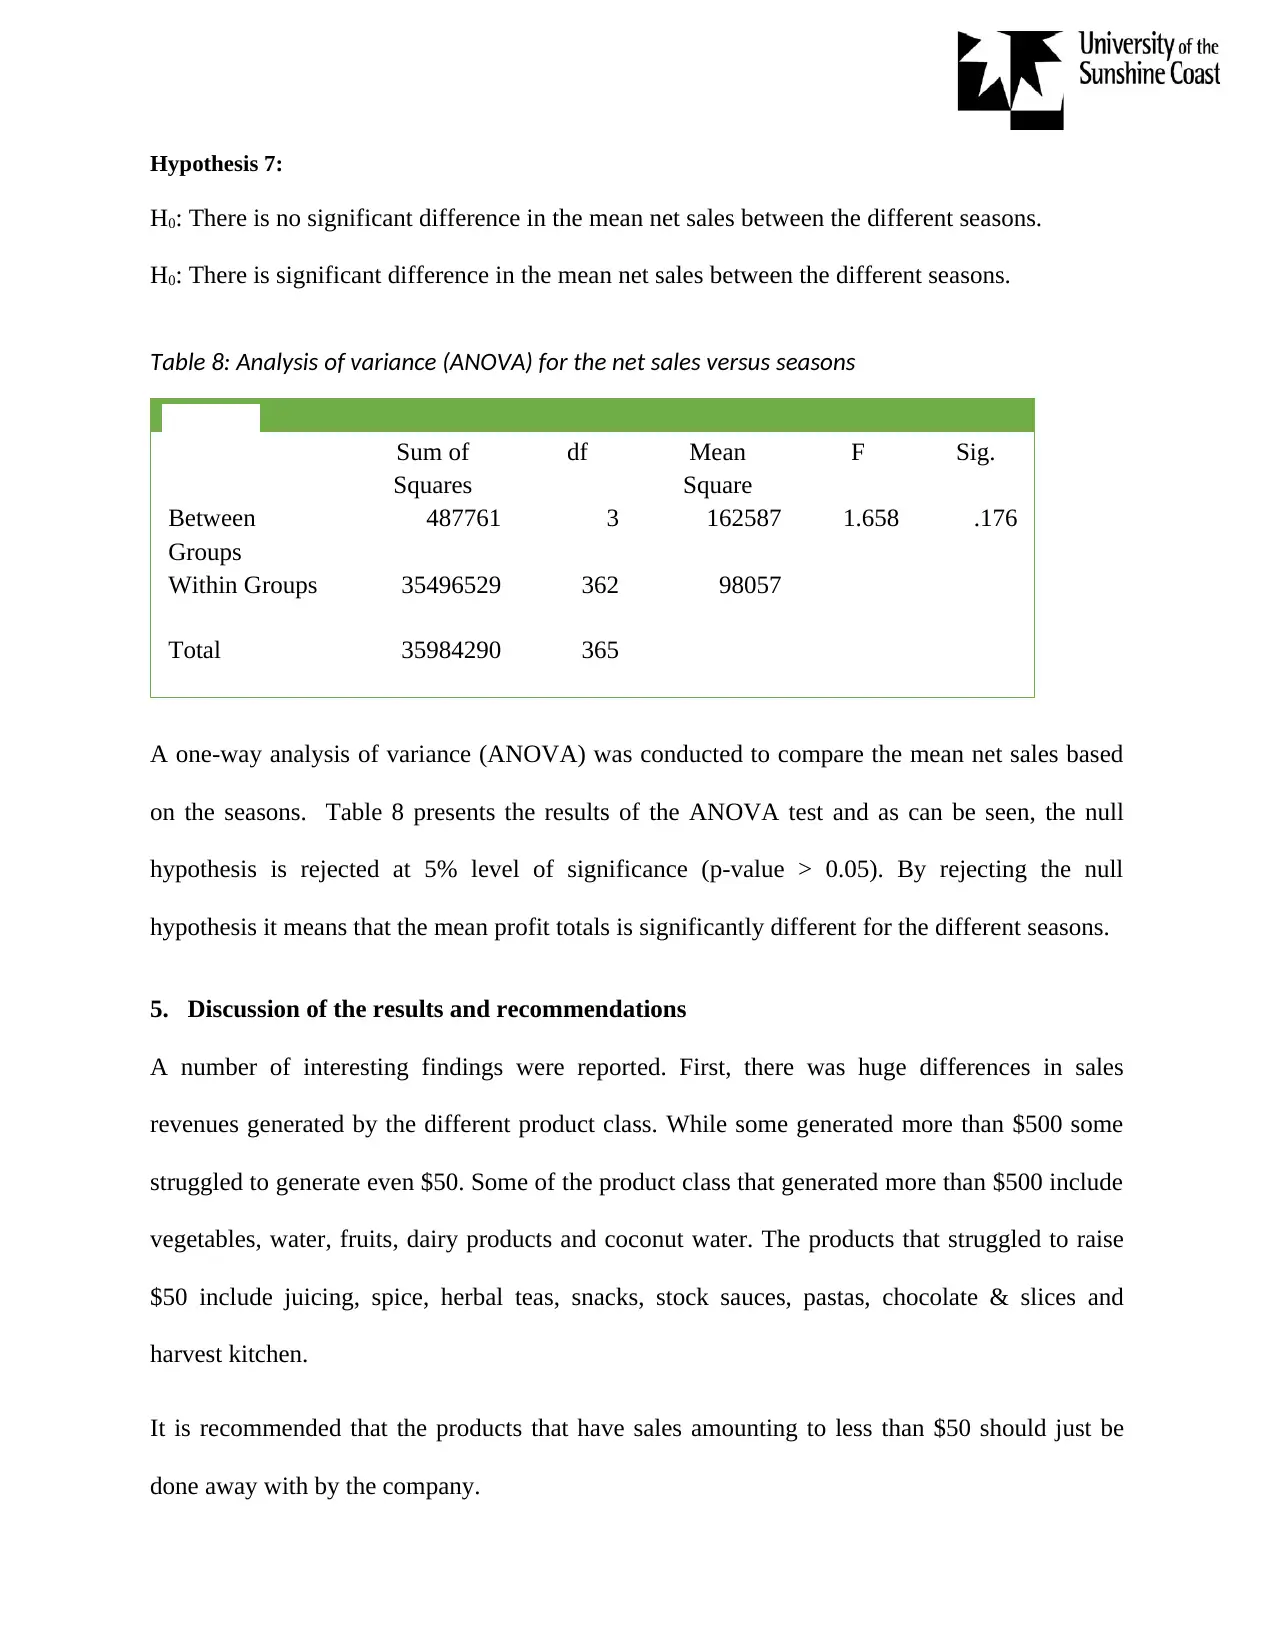
Hypothesis 7:
H0: There is no significant difference in the mean net sales between the different seasons.
H0: There is significant difference in the mean net sales between the different seasons.
Table 8: Analysis of variance (ANOVA) for the net sales versus seasons
Net Sales
Sum of
Squares
df Mean
Square
F Sig.
Between
Groups
487761 3 162587 1.658 .176
Within Groups 35496529 362 98057
Total 35984290 365
A one-way analysis of variance (ANOVA) was conducted to compare the mean net sales based
on the seasons. Table 8 presents the results of the ANOVA test and as can be seen, the null
hypothesis is rejected at 5% level of significance (p-value > 0.05). By rejecting the null
hypothesis it means that the mean profit totals is significantly different for the different seasons.
5. Discussion of the results and recommendations
A number of interesting findings were reported. First, there was huge differences in sales
revenues generated by the different product class. While some generated more than $500 some
struggled to generate even $50. Some of the product class that generated more than $500 include
vegetables, water, fruits, dairy products and coconut water. The products that struggled to raise
$50 include juicing, spice, herbal teas, snacks, stock sauces, pastas, chocolate & slices and
harvest kitchen.
It is recommended that the products that have sales amounting to less than $50 should just be
done away with by the company.
Month of the year was found to have impact on gross profits made but not on the sales; this
implies that the cost of production or may be operating costs could be higher in some months
than other months. It is this that might have resulted to some months having less profits as
compared to others. It is therefore important for the management to find out what could be
causing this.
References
Couldry, N. & Turow, J., 2014. Advertising, Big Data, and the Clearance of the Public Realm:
Marketers’ New Approaches to the Content Subsidy. International Journal of Communication,
Volume 8, p. 1710–1726.
Dedić, N. & Stanier, C., 2017. Towards Differentiating Business Intelligence, Big Data, Data
Analytics and Knowledge Discovery. Springer International Publishing, p. 285.
Derrick, B., Toher, D. & White, P., 2017. How to compare the means of two samples that
include paired observations and independent observations. The Quantitative Methods for
Psychology, 13(2), p. 120–126.
Kantardzic, M., 2003. Data Mining: Concepts, Models, Methods, and Algorithms.
Kimble, C. & Milolidakis, G., 2015. Big Data and Business Intelligence: Debunking the Myths.
Global Business and Organizational Excellence, 35(1), p. 23–34.
Reichman, O. J., Jones, M. B. & Schildhauer, M. P., 2011. Challenges and Opportunities of
Open Data in Ecology. 331 (6018), p. 703–5.
Segaran, T. & Hammerbacher, J., 2009. Beautiful Data: The Stories Behind Elegant Data
Solutions. p. 27.
Paraphrase This Document
Need a fresh take? Get an instant paraphrase of this document with our AI Paraphraser

Siegel, E., 2013. Predictive Analytics: The Power to Predict Who Will Click, Buy, Lie, or Die.
1 out of 14
Related Documents


Your All-in-One AI-Powered Toolkit for Academic Success.
+13062052269
info@desklib.com
Available 24*7 on WhatsApp / Email
![[object Object]](/_next/static/media/star-bottom.7253800d.svg)
Unlock your academic potential
© 2024 | Zucol Services PVT LTD | All rights reserved.