logo

Corporate Finance Textbook Assignment


Added on  2022-09-14

3 Pages642 Words14 Views
BUSI 320 Corporate Finance Textbook Assignment 1
NAME: Jennifer Bean
Compute each of the following ratios for 2016 and 2017 and indicate whether each ratio was
getting "better" or "worse" from 2016 to 2017 and was "good" or "bad" compared to the Industry
average for 2017. (round all numbers to 2 digits past the decimal place. ex: 22.94%)
Type your answers in the table below and submit this document.
Ratios 2016 2017
Enter
“Better” or
“Worse”
2017
Indust
ry Avg
Enter
"Good" or
"Bad"
compared to
Industry
Avg
Profit Margin 1 0.03 1
1 0.05 2
1 Better 0.09 3
1 Worse
Current Ratio 2 1.92 1
2 1.83 2
2 Worse 1.80 3
2 Better
Quick Ratio 3 1.08 1
3 0.99 2
3 Worse 1.12 3
3 Worse
Return on Assets 4 0.05 1
4 0.09 2
4 Better 0.18 3
4 Worse
Debt to Assets 5 0.51 1
5 0.55 2
5 Worse 0.60 3
5 Better
Receivables
turnover 6 12.19 1
6
12.77 2
6
Better 12.00 3
6
Better
Avg. collection
period* 7 29.54 1
7
28.20 2
7
Better 22.10 3
7
Worse
Inventory
Turnover** 8 2.95 1
8
2.74 2
8
Worse 8.25 3
8
Worse
Return on Equity 9 0.11 1
9 0.19 2
9 Better 0.16 3
9 Better
Times Interest
Earned
1
0 3.00 2
0
3.77 3
0
Better 8.15 4
0
Worse
*Assume a 360 day year
**Inventory Turnover can be computed 2 different ways. Use the formula listed in the text
(the one the text indicates many credit reporting agencies generally use)
Use the following information to answer the questions: (Balance Sheet on the next
page)
note: all sales are credit sales
Income Stmt info: 2016 2017
Sales
$
975,000
$
1,072,500
less Cost of Goods Sold: 325,000 346,125
Gross Profit
Corporate Finance Textbook Assignment_1

End of preview

Want to access all the pages? Upload your documents or become a member.

Related Documents
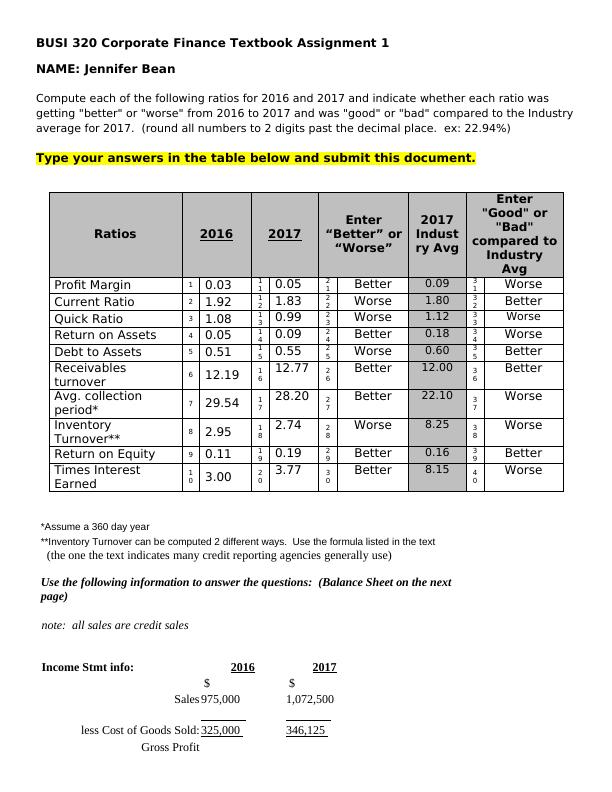
Financial Analysis: Evaluating the Financial Position of a Company
|9
|2257
|94

Assignment: Accounting for Managers
|7
|1354
|25