Financial Performance and Strategic Analysis: M&S vs Sainsbury Report
VerifiedAdded on 2023/04/17
|17
|3702
|276
Report
AI Summary
This report provides a comparative analysis of Marks & Spencer (M&S) and Sainsbury's, two major British retailers. It begins with an overview of both organizations, followed by a financial analysis using key performance indicators (KPIs) such as sales performance, profitability (gross and net margins), free cash flow, debt and investment, market share, and price-to-earnings ratio. The report then delves into strategic issues using PESTEL analysis, a modified Porter’s 6 forces model, and the Balance Scorecard (BSC) for both M&S and Sainsbury. An appraisal of the limitations of financial and conventional modeling is included. Based on the analysis, recommendations are provided to M&S to improve its overall performance. The report concludes with a summary of findings and a list of references.
ESSAY
1
1
Paraphrase This Document
Need a fresh take? Get an instant paraphrase of this document with our AI Paraphraser
Table of Contents
INTRODUCTION................................................................................................................................3
Overview of the organizations.........................................................................................................3
Financial analysis.................................................................................................................................3
Sales performance............................................................................................................................3
Profitability......................................................................................................................................5
Free cash flow..................................................................................................................................6
Debt and investment........................................................................................................................7
Market share....................................................................................................................................9
Price to earnings ratio....................................................................................................................10
ANALYSIS, INTERPRETATION AND DISCUSSION OF STRATEGIC ISSUES........................10
PESTEL analysis...........................................................................................................................10
Modified Porter’s 5 forces/Porter’s 6 forces model.......................................................................12
M&S’s Balance scorecard..............................................................................................................13
Sainsbury’s BSC............................................................................................................................14
AN APPRAISAL OF THE LIMITATIONS.......................................................................................14
Limitation of financial modelling..................................................................................................14
Limitation of conventional modelling...........................................................................................14
RECOMMENDATIONS....................................................................................................................15
CONCLUSION..................................................................................................................................15
REFERENCES...................................................................................................................................17
2
INTRODUCTION
With the changing market conditions and rising competitive age, establishments need to
make several strategies and business decisions for the performance improvement(Sheikhi., Ranjbar,
A. and Oraee., 2012). In order to reach success in the market, firms compare their own performance
over the years and with competitors as well. The aim of present project assignment is to analyse
M&S’s performance with its competitor, Sainsbury on the basis of KPIs. Moreover, strategic issues
will be identified through PESTEL, Porter’s 6 forces model and Balance Scorecard as well. On the
basis of the results, M&S will be recommended by various ways and strategies to maximize overall
performance and meet targets.
Overview of the organizations
Marks and Spencer (M&S) is British retailer firm listed on LSE and constituents of FTSE
100 Index. The company is specialised in clothing, home and food products founded in the year
1884 and currently, operates at multinational level such as UK, India, Turkey, Ireland, France ,
Greece and Finland, Hungry, Spain and many others.
Sainsbury is a public listed company constituents of FTSE 100 and traded on LSE. It has
been established 147 years ago in 1869 and currently established global market reputation all over
the world. It operates through three segments that are Sainsbury supermarket, Sainsbury’s Bank and
Sainsbury’s Argos as well. It merchandise operations through its supermarket, local convenience
stores, online operations, hypermarket and many others.
FINANCIAL ANALYSIS
Key performance indicators
In the modern corporate times, UK retail sector is growing rapidly, in which, all the British
retailers are focusing to deliver highest quality services to their customers so as to capture larger
market share and meet targets. Retailing firms are giving tough competition to each other so that
they can attract greater customer base and fulfil targets(Jiang., Kempinski. and Chappell., 2016). In
order to achieve success, companies are not only requiring comparing their own performance over
the years but also needing to examine their competitor’s performance. Key performance indicators
are an appropriate way that can be used by M&S to compare their own performance with that of
Sainsbury. It is typically used to measure the efficiency of business operations to gain larger return
and meet targets. Turnover, profitability measurement, financial risk, cash flow generating ability
and so on is considered as important KPIs for making comparative performance analysis, done
hereunder:
3
⊘ This is a preview!⊘
Do you want full access?
Subscribe today to unlock all pages.
Trusted by 1+ million students worldwide
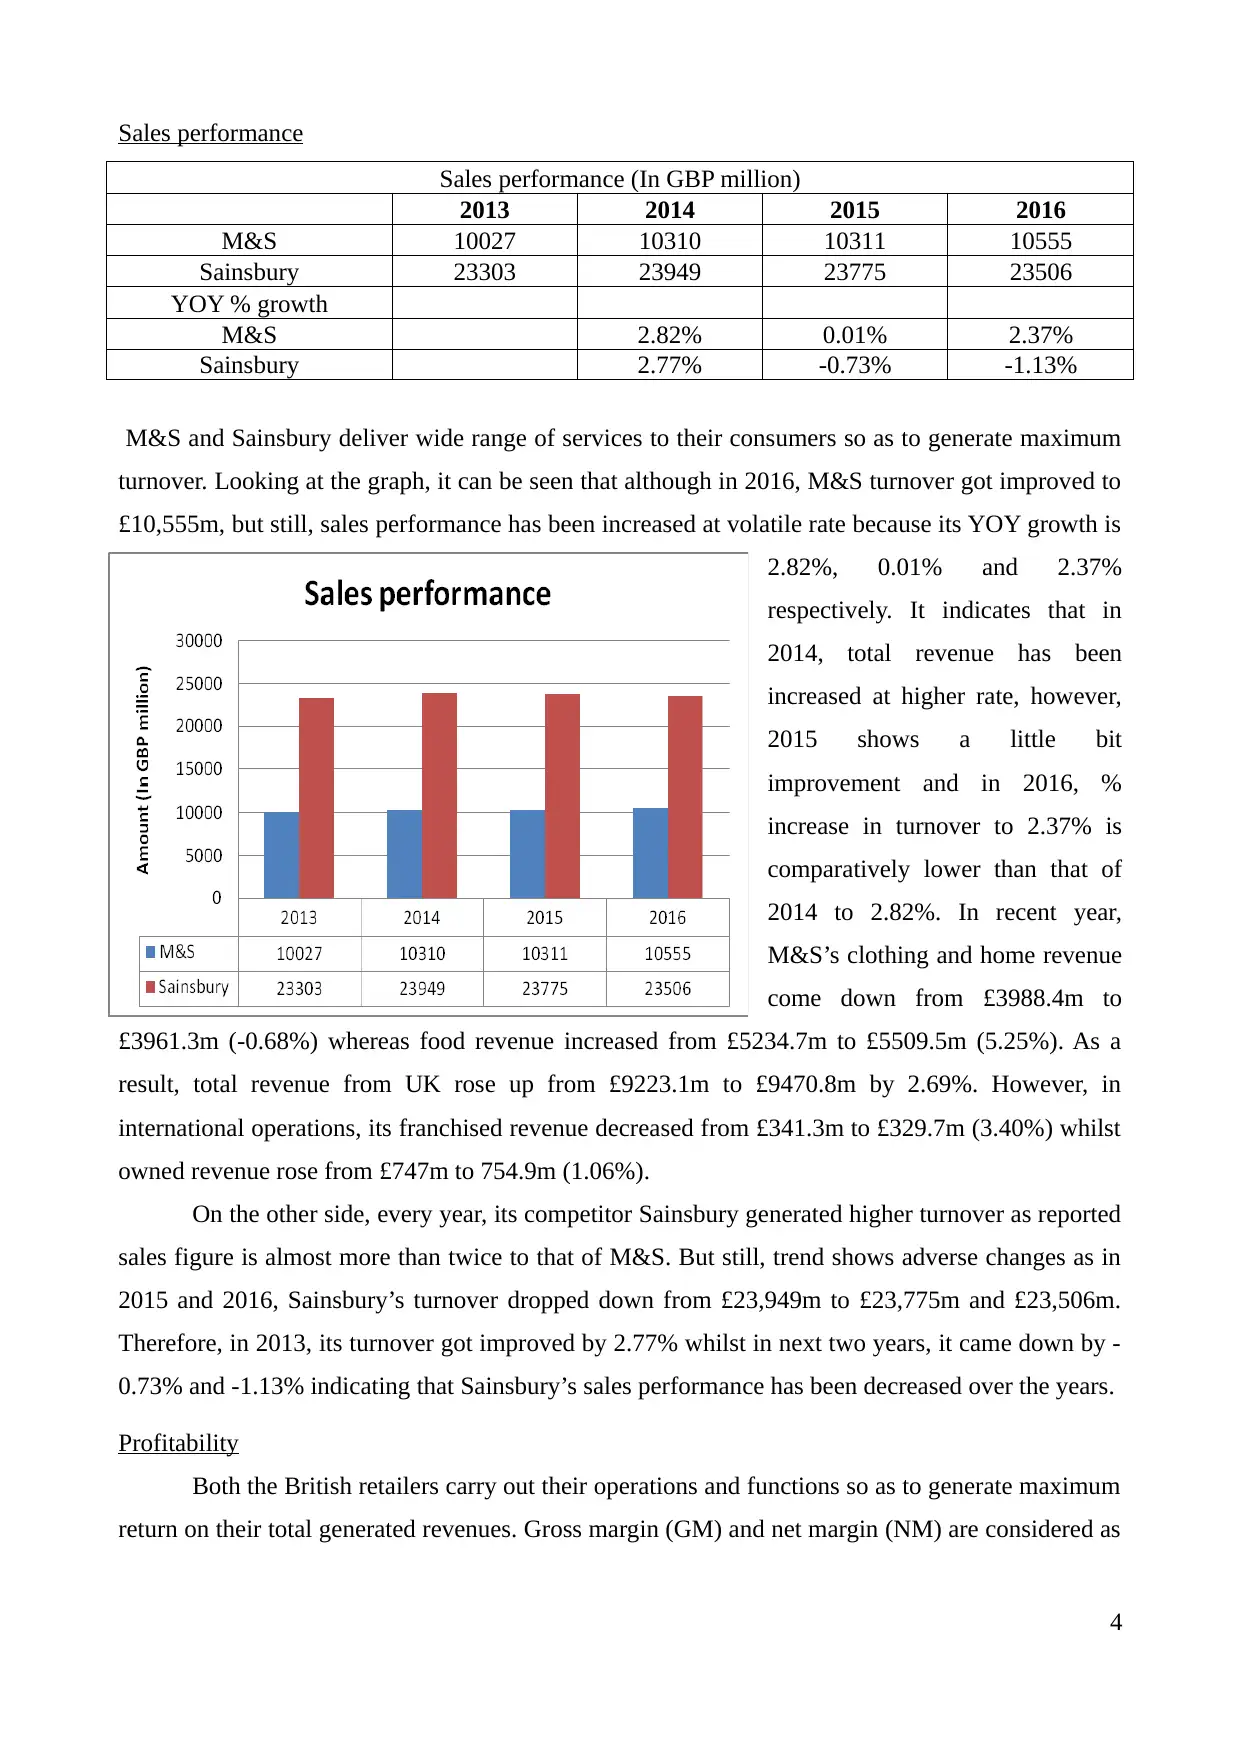
Sales performance
Sales performance (In GBP million)
2013 2014 2015 2016
M&S 10027 10310 10311 10555
Sainsbury 23303 23949 23775 23506
YOY % growth
M&S 2.82% 0.01% 2.37%
Sainsbury 2.77% -0.73% -1.13%
M&S and Sainsbury deliver wide range of services to their consumers so as to generate maximum
turnover. Looking at the graph, it can be seen that although in 2016, M&S turnover got improved to
£10,555m, but still, sales performance has been increased at volatile rate because its YOY growth is
2.82%, 0.01% and 2.37%
respectively. It indicates that in
2014, total revenue has been
increased at higher rate, however,
2015 shows a little bit
improvement and in 2016, %
increase in turnover to 2.37% is
comparatively lower than that of
2014 to 2.82%. In recent year,
M&S’s clothing and home revenue
come down from £3988.4m to
£3961.3m (-0.68%) whereas food revenue increased from £5234.7m to £5509.5m (5.25%). As a
result, total revenue from UK rose up from £9223.1m to £9470.8m by 2.69%. However, in
international operations, its franchised revenue decreased from £341.3m to £329.7m (3.40%) whilst
owned revenue rose from £747m to 754.9m (1.06%).
On the other side, every year, its competitor Sainsbury generated higher turnover as reported
sales figure is almost more than twice to that of M&S. But still, trend shows adverse changes as in
2015 and 2016, Sainsbury’s turnover dropped down from £23,949m to £23,775m and £23,506m.
Therefore, in 2013, its turnover got improved by 2.77% whilst in next two years, it came down by -
0.73% and -1.13% indicating that Sainsbury’s sales performance has been decreased over the years.
Profitability
Both the British retailers carry out their operations and functions so as to generate maximum
return on their total generated revenues. Gross margin (GM) and net margin (NM) are considered as
4
Paraphrase This Document
Need a fresh take? Get an instant paraphrase of this document with our AI Paraphraser
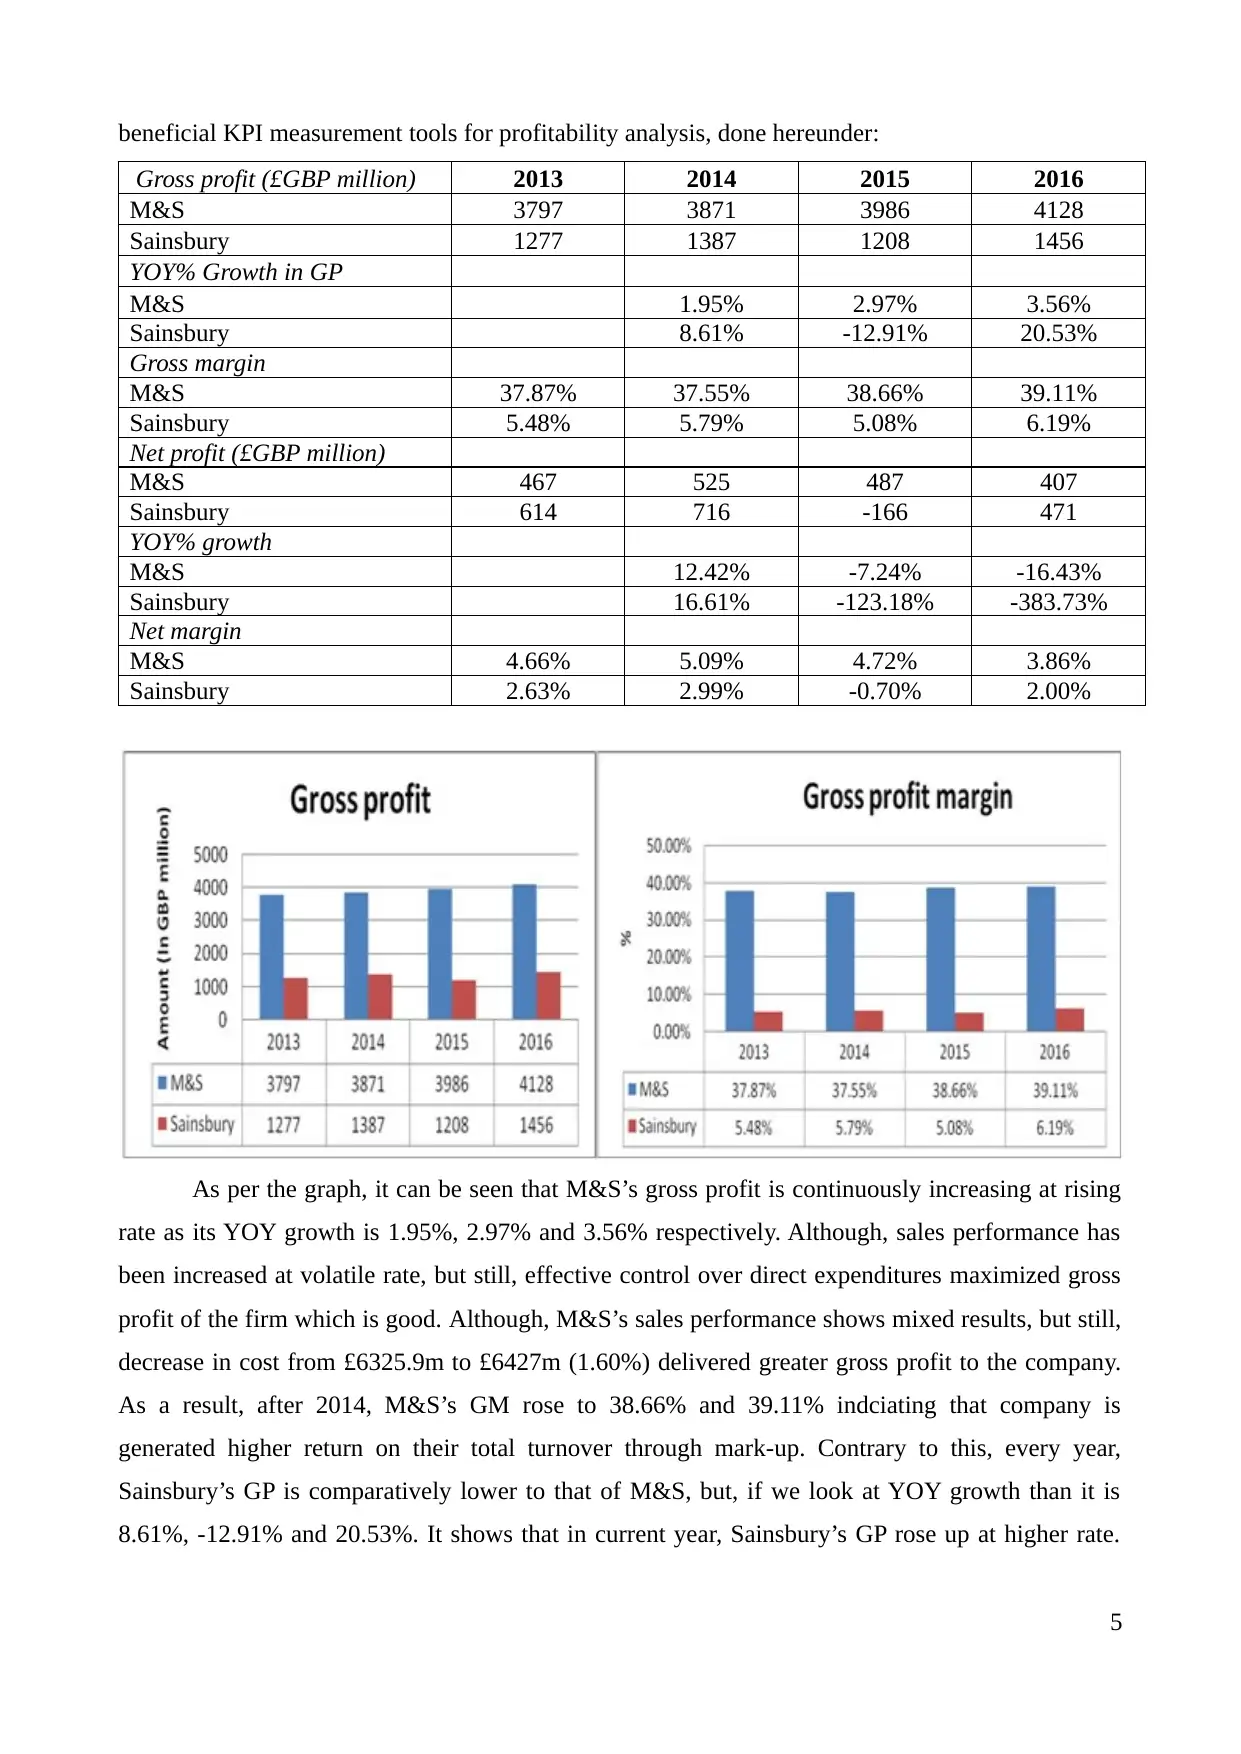
beneficial KPI measurement tools for profitability analysis, done hereunder:
Gross profit (£GBP million) 2013 2014 2015 2016
M&S 3797 3871 3986 4128
Sainsbury 1277 1387 1208 1456
YOY% Growth in GP
M&S 1.95% 2.97% 3.56%
Sainsbury 8.61% -12.91% 20.53%
Gross margin
M&S 37.87% 37.55% 38.66% 39.11%
Sainsbury 5.48% 5.79% 5.08% 6.19%
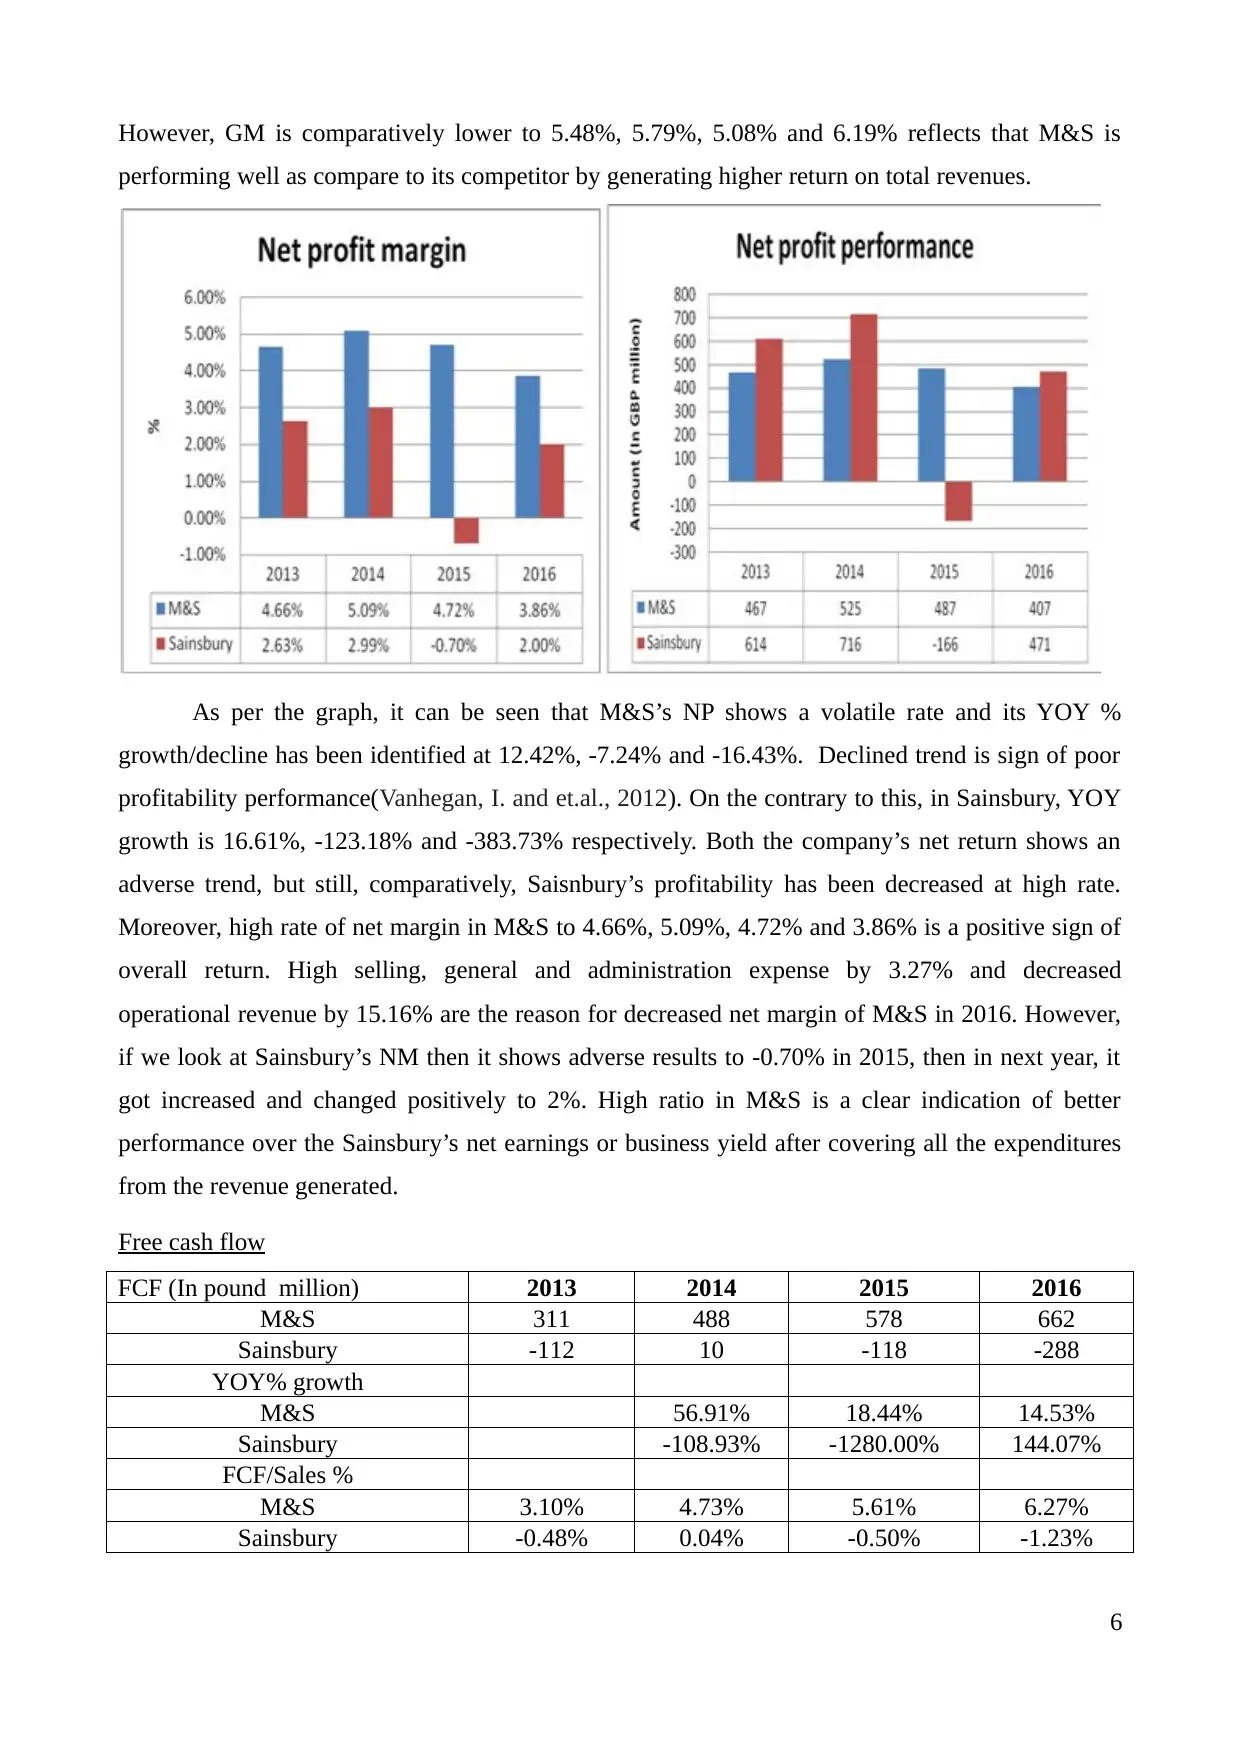
Net profit (£GBP million)
M&S 467 525 487 407
Sainsbury 614 716 -166 471
YOY% growth
M&S 12.42% -7.24% -16.43%
Sainsbury 16.61% -123.18% -383.73%
Net margin
M&S 4.66% 5.09% 4.72% 3.86%
Sainsbury 2.63% 2.99% -0.70% 2.00%
As per the graph, it can be seen that M&S’s gross profit is continuously increasing at rising
rate as its YOY growth is 1.95%, 2.97% and 3.56% respectively. Although, sales performance has
been increased at volatile rate, but still, effective control over direct expenditures maximized gross
profit of the firm which is good. Although, M&S’s sales performance shows mixed results, but still,
decrease in cost from £6325.9m to £6427m (1.60%) delivered greater gross profit to the company.
As a result, after 2014, M&S’s GM rose to 38.66% and 39.11% indciating that company is
generated higher return on their total turnover through mark-up. Contrary to this, every year,
Sainsbury’s GP is comparatively lower to that of M&S, but, if we look at YOY growth than it is
8.61%, -12.91% and 20.53%. It shows that in current year, Sainsbury’s GP rose up at higher rate.
5
Gross profit (£GBP million) 2013 2014 2015 2016
M&S 3797 3871 3986 4128
Sainsbury 1277 1387 1208 1456
YOY% Growth in GP
M&S 1.95% 2.97% 3.56%
Sainsbury 8.61% -12.91% 20.53%
Gross margin
M&S 37.87% 37.55% 38.66% 39.11%
Sainsbury 5.48% 5.79% 5.08% 6.19%
Net profit (£GBP million)
M&S 467 525 487 407
Sainsbury 614 716 -166 471
YOY% growth
M&S 12.42% -7.24% -16.43%
Sainsbury 16.61% -123.18% -383.73%
Net margin
M&S 4.66% 5.09% 4.72% 3.86%
Sainsbury 2.63% 2.99% -0.70% 2.00%
As per the graph, it can be seen that M&S’s gross profit is continuously increasing at rising
rate as its YOY growth is 1.95%, 2.97% and 3.56% respectively. Although, sales performance has
been increased at volatile rate, but still, effective control over direct expenditures maximized gross
profit of the firm which is good. Although, M&S’s sales performance shows mixed results, but still,
decrease in cost from £6325.9m to £6427m (1.60%) delivered greater gross profit to the company.
As a result, after 2014, M&S’s GM rose to 38.66% and 39.11% indciating that company is
generated higher return on their total turnover through mark-up. Contrary to this, every year,
Sainsbury’s GP is comparatively lower to that of M&S, but, if we look at YOY growth than it is
8.61%, -12.91% and 20.53%. It shows that in current year, Sainsbury’s GP rose up at higher rate.
5
However, GM is comparatively lower to 5.48%, 5.79%, 5.08% and 6.19% reflects that M&S is
performing well as compare to its competitor by generating higher return on total revenues.
As per the graph, it can be seen that M&S’s NP shows a volatile rate and its YOY %
growth/decline has been identified at 12.42%, -7.24% and -16.43%. Declined trend is sign of poor
profitability performance(Vanhegan, I. and et.al., 2012). On the contrary to this, in Sainsbury, YOY
growth is 16.61%, -123.18% and -383.73% respectively. Both the company’s net return shows an
adverse trend, but still, comparatively, Saisnbury’s profitability has been decreased at high rate.
Moreover, high rate of net margin in M&S to 4.66%, 5.09%, 4.72% and 3.86% is a positive sign of
overall return. High selling, general and administration expense by 3.27% and decreased
operational revenue by 15.16% are the reason for decreased net margin of M&S in 2016. However,
if we look at Sainsbury’s NM then it shows adverse results to -0.70% in 2015, then in next year, it
got increased and changed positively to 2%. High ratio in M&S is a clear indication of better
performance over the Sainsbury’s net earnings or business yield after covering all the expenditures
from the revenue generated.
Free cash flow
FCF (In pound million) 2013 2014 2015 2016
M&S 311 488 578 662
Sainsbury -112 10 -118 -288
YOY% growth
M&S 56.91% 18.44% 14.53%
Sainsbury -108.93% -1280.00% 144.07%
FCF/Sales %
M&S 3.10% 4.73% 5.61% 6.27%
Sainsbury -0.48% 0.04% -0.50% -1.23%
6
⊘ This is a preview!⊘
Do you want full access?
Subscribe today to unlock all pages.
Trusted by 1+ million students worldwide
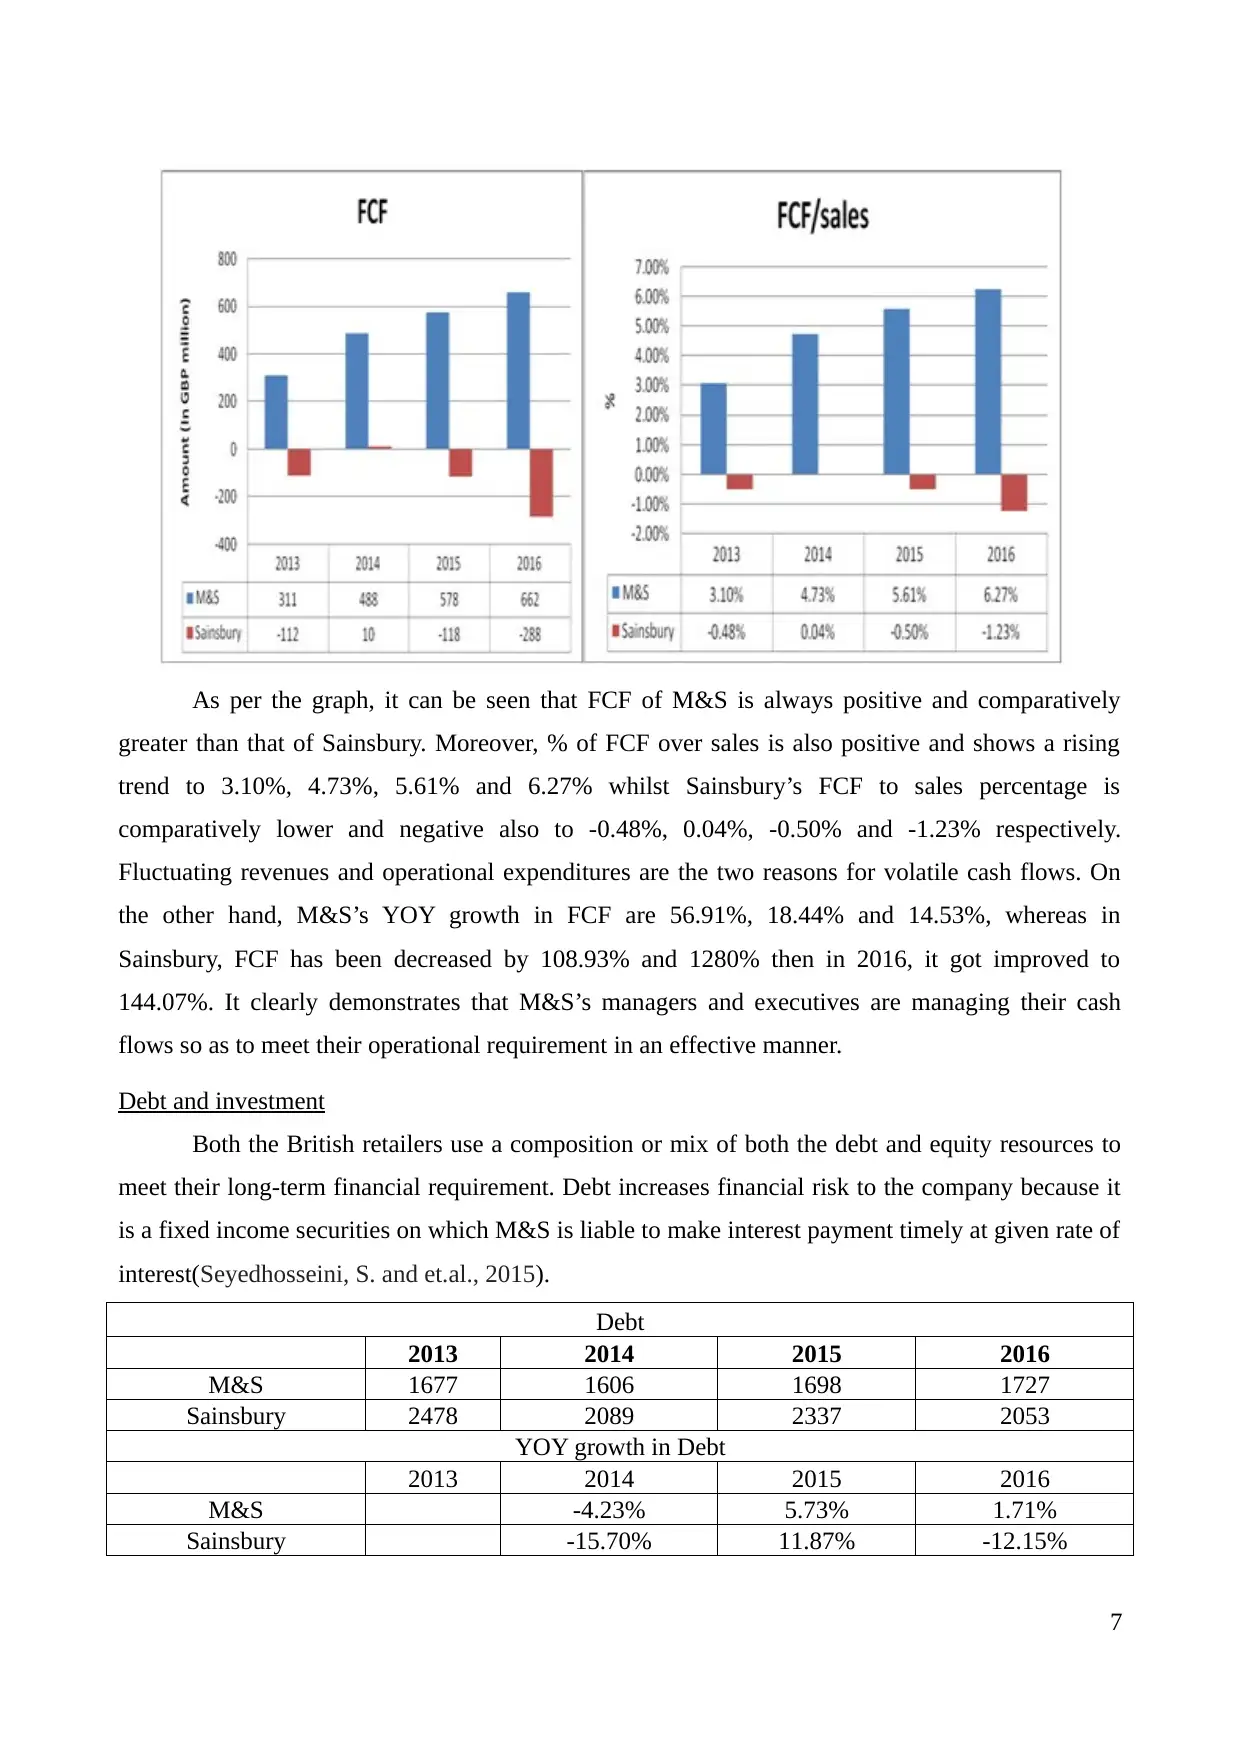
As per the graph, it can be seen that FCF of M&S is always positive and comparatively
greater than that of Sainsbury. Moreover, % of FCF over sales is also positive and shows a rising
trend to 3.10%, 4.73%, 5.61% and 6.27% whilst Sainsbury’s FCF to sales percentage is
comparatively lower and negative also to -0.48%, 0.04%, -0.50% and -1.23% respectively.
Fluctuating revenues and operational expenditures are the two reasons for volatile cash flows. On
the other hand, M&S’s YOY growth in FCF are 56.91%, 18.44% and 14.53%, whereas in
Sainsbury, FCF has been decreased by 108.93% and 1280% then in 2016, it got improved to
144.07%. It clearly demonstrates that M&S’s managers and executives are managing their cash
flows so as to meet their operational requirement in an effective manner.
Debt and investment
Both the British retailers use a composition or mix of both the debt and equity resources to
meet their long-term financial requirement. Debt increases financial risk to the company because it
is a fixed income securities on which M&S is liable to make interest payment timely at given rate of
interest(Seyedhosseini, S. and et.al., 2015).
Debt
2013 2014 2015 2016
M&S 1677 1606 1698 1727
Sainsbury 2478 2089 2337 2053
YOY growth in Debt
2013 2014 2015 2016
M&S -4.23% 5.73% 1.71%
Sainsbury -15.70% 11.87% -12.15%
7
Paraphrase This Document
Need a fresh take? Get an instant paraphrase of this document with our AI Paraphraser
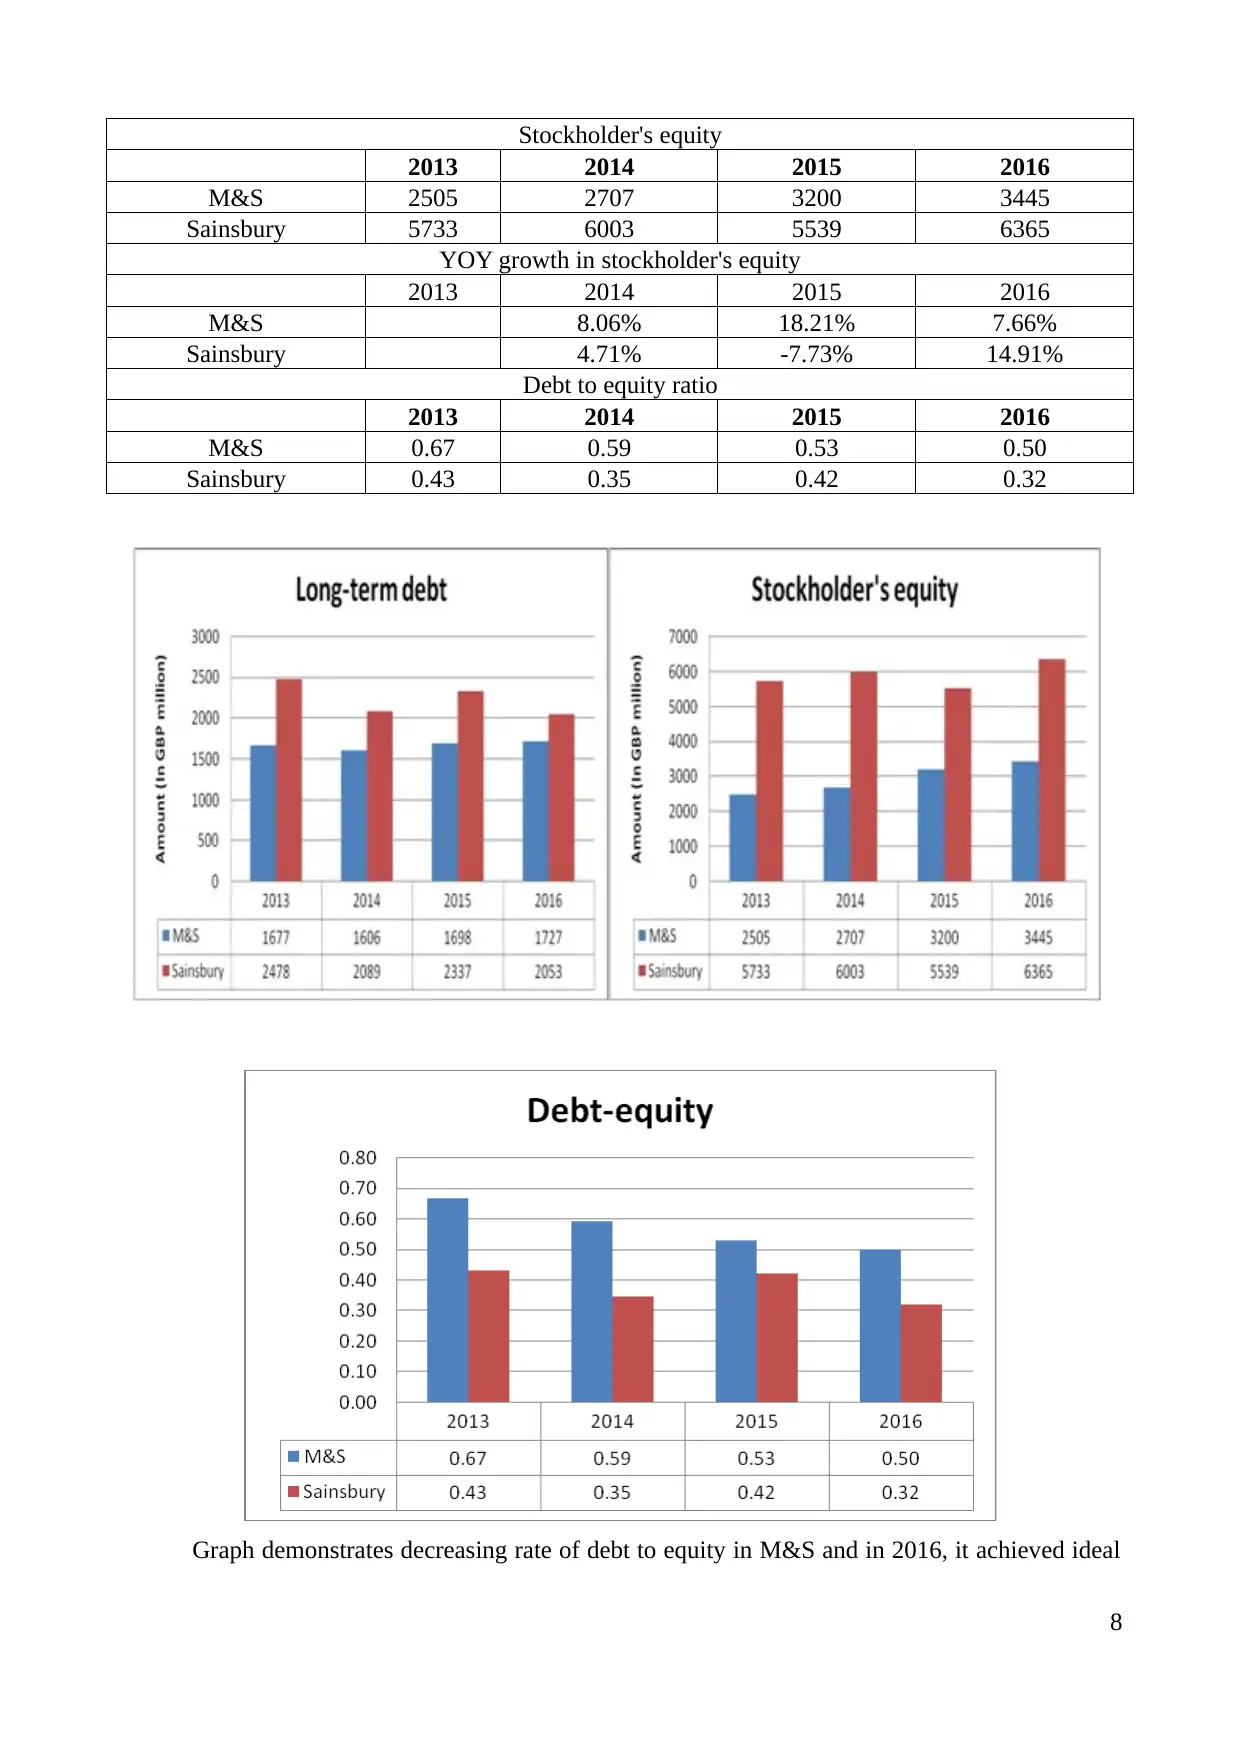
Stockholder's equity
2013 2014 2015 2016
M&S 2505 2707 3200 3445
Sainsbury 5733 6003 5539 6365
YOY growth in stockholder's equity
2013 2014 2015 2016
M&S 8.06% 18.21% 7.66%
Sainsbury 4.71% -7.73% 14.91%
Debt to equity ratio
2013 2014 2015 2016
M&S 0.67 0.59 0.53 0.50
Sainsbury 0.43 0.35 0.42 0.32
Graph demonstrates decreasing rate of debt to equity in M&S and in 2016, it achieved ideal
8
2013 2014 2015 2016
M&S 2505 2707 3200 3445
Sainsbury 5733 6003 5539 6365
YOY growth in stockholder's equity
2013 2014 2015 2016
M&S 8.06% 18.21% 7.66%
Sainsbury 4.71% -7.73% 14.91%
Debt to equity ratio
2013 2014 2015 2016
M&S 0.67 0.59 0.53 0.50
Sainsbury 0.43 0.35 0.42 0.32
Graph demonstrates decreasing rate of debt to equity in M&S and in 2016, it achieved ideal
8
ratio of 0.50:1. It became possible by excessive collection of equity fund and less through debt
securities. It reflects that M&S managed its capital structure so as to repay long-term obligation on
right time as per repayment schedule. In M&S, YOY growth in debt is -4.23%, 5.73% and 1.71%.
On the other hand, Sainsbury’s D/E ratio came down from 0.43 to 0.35, 0.42 and 0.32 due to YOY
growth in debt at -15.70%, 11.87% and -12.15% whereas % increase in equity is by 4.71%, -7.73%
and 14.91% respectively. Decreased debt to equity ratio indicates less financial risk but still as cost
of debt is comparatively cheaper than equity helps to reduce overall cost of capital.
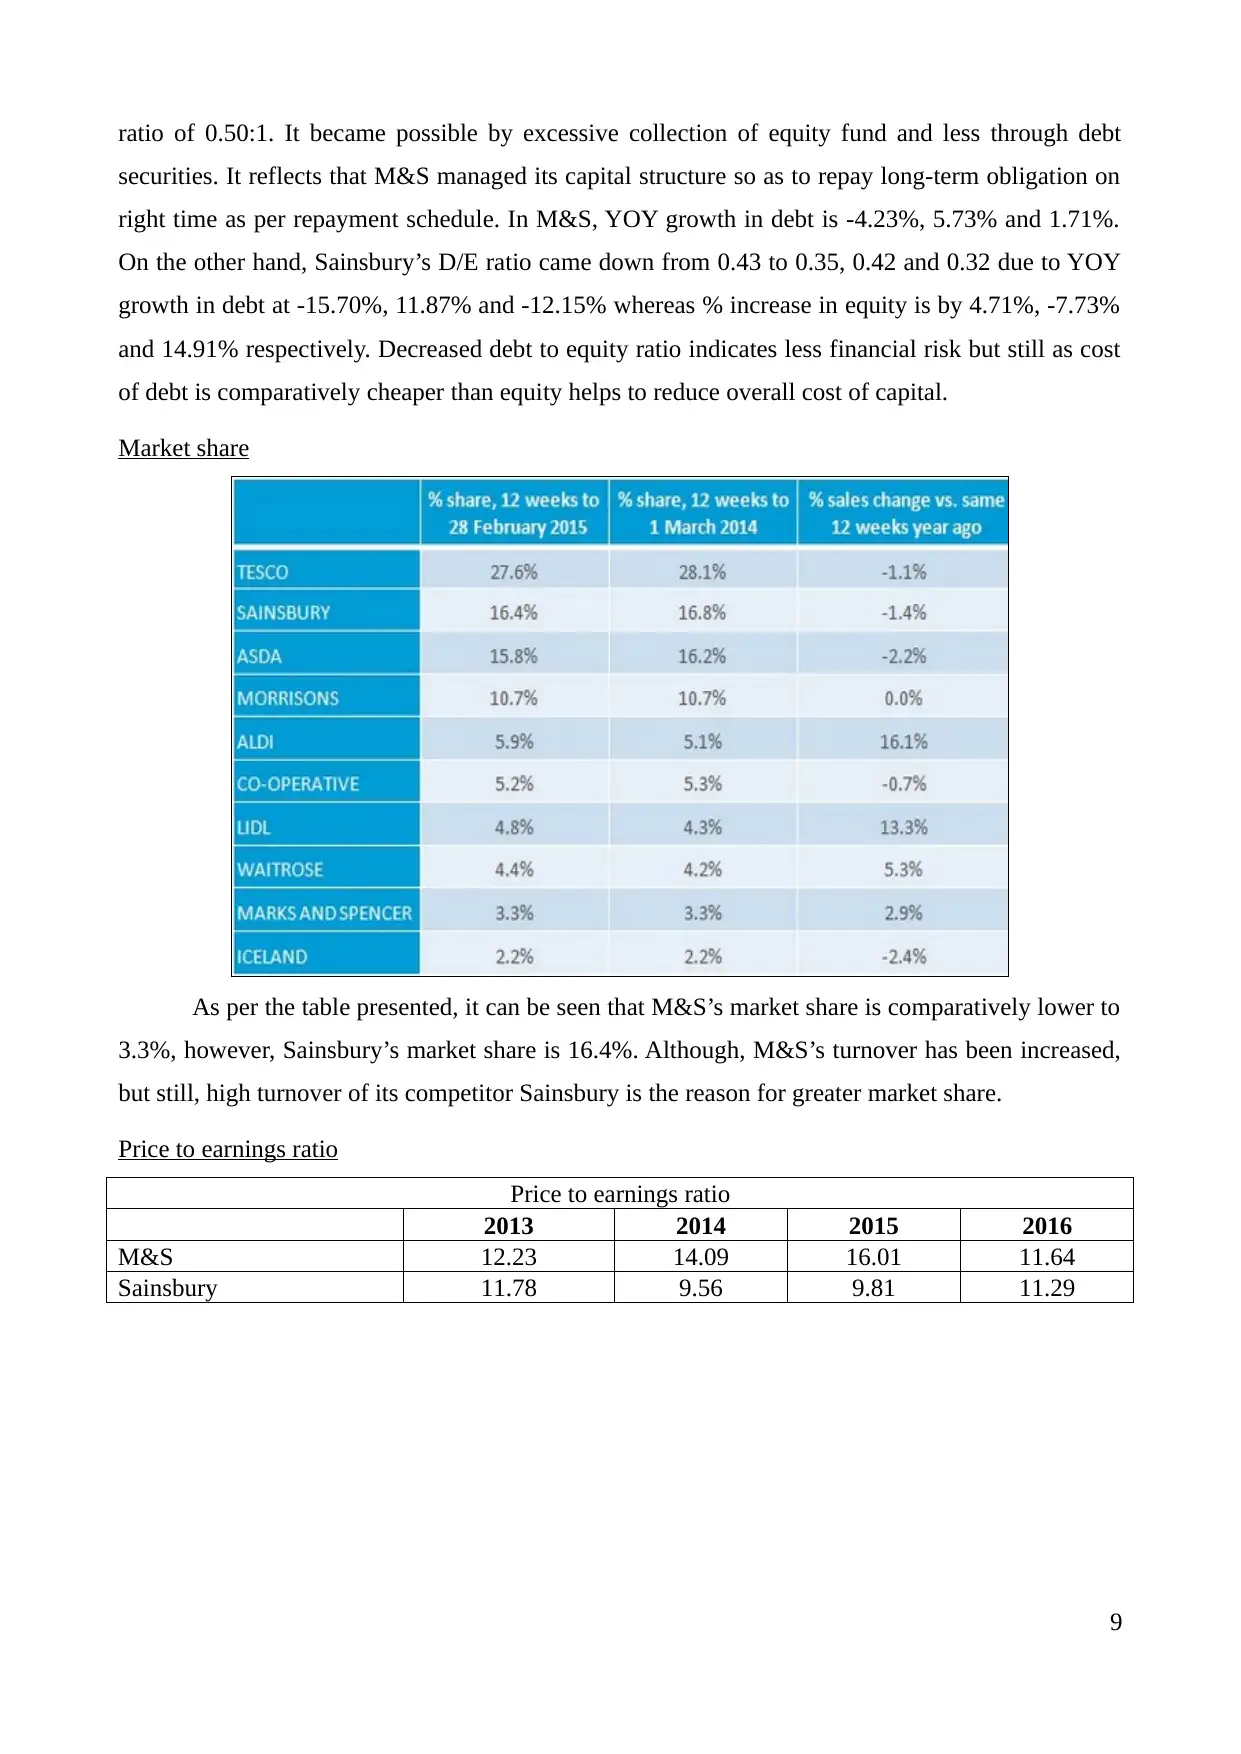
Market share
As per the table presented, it can be seen that M&S’s market share is comparatively lower to
3.3%, however, Sainsbury’s market share is 16.4%. Although, M&S’s turnover has been increased,
but still, high turnover of its competitor Sainsbury is the reason for greater market share.
Price to earnings ratio
Price to earnings ratio
2013 2014 2015 2016
M&S 12.23 14.09 16.01 11.64
Sainsbury 11.78 9.56 9.81 11.29
9
securities. It reflects that M&S managed its capital structure so as to repay long-term obligation on
right time as per repayment schedule. In M&S, YOY growth in debt is -4.23%, 5.73% and 1.71%.
On the other hand, Sainsbury’s D/E ratio came down from 0.43 to 0.35, 0.42 and 0.32 due to YOY
growth in debt at -15.70%, 11.87% and -12.15% whereas % increase in equity is by 4.71%, -7.73%
and 14.91% respectively. Decreased debt to equity ratio indicates less financial risk but still as cost
of debt is comparatively cheaper than equity helps to reduce overall cost of capital.
Market share
As per the table presented, it can be seen that M&S’s market share is comparatively lower to
3.3%, however, Sainsbury’s market share is 16.4%. Although, M&S’s turnover has been increased,
but still, high turnover of its competitor Sainsbury is the reason for greater market share.
Price to earnings ratio
Price to earnings ratio
2013 2014 2015 2016
M&S 12.23 14.09 16.01 11.64
Sainsbury 11.78 9.56 9.81 11.29
9
⊘ This is a preview!⊘
Do you want full access?
Subscribe today to unlock all pages.
Trusted by 1+ million students worldwide
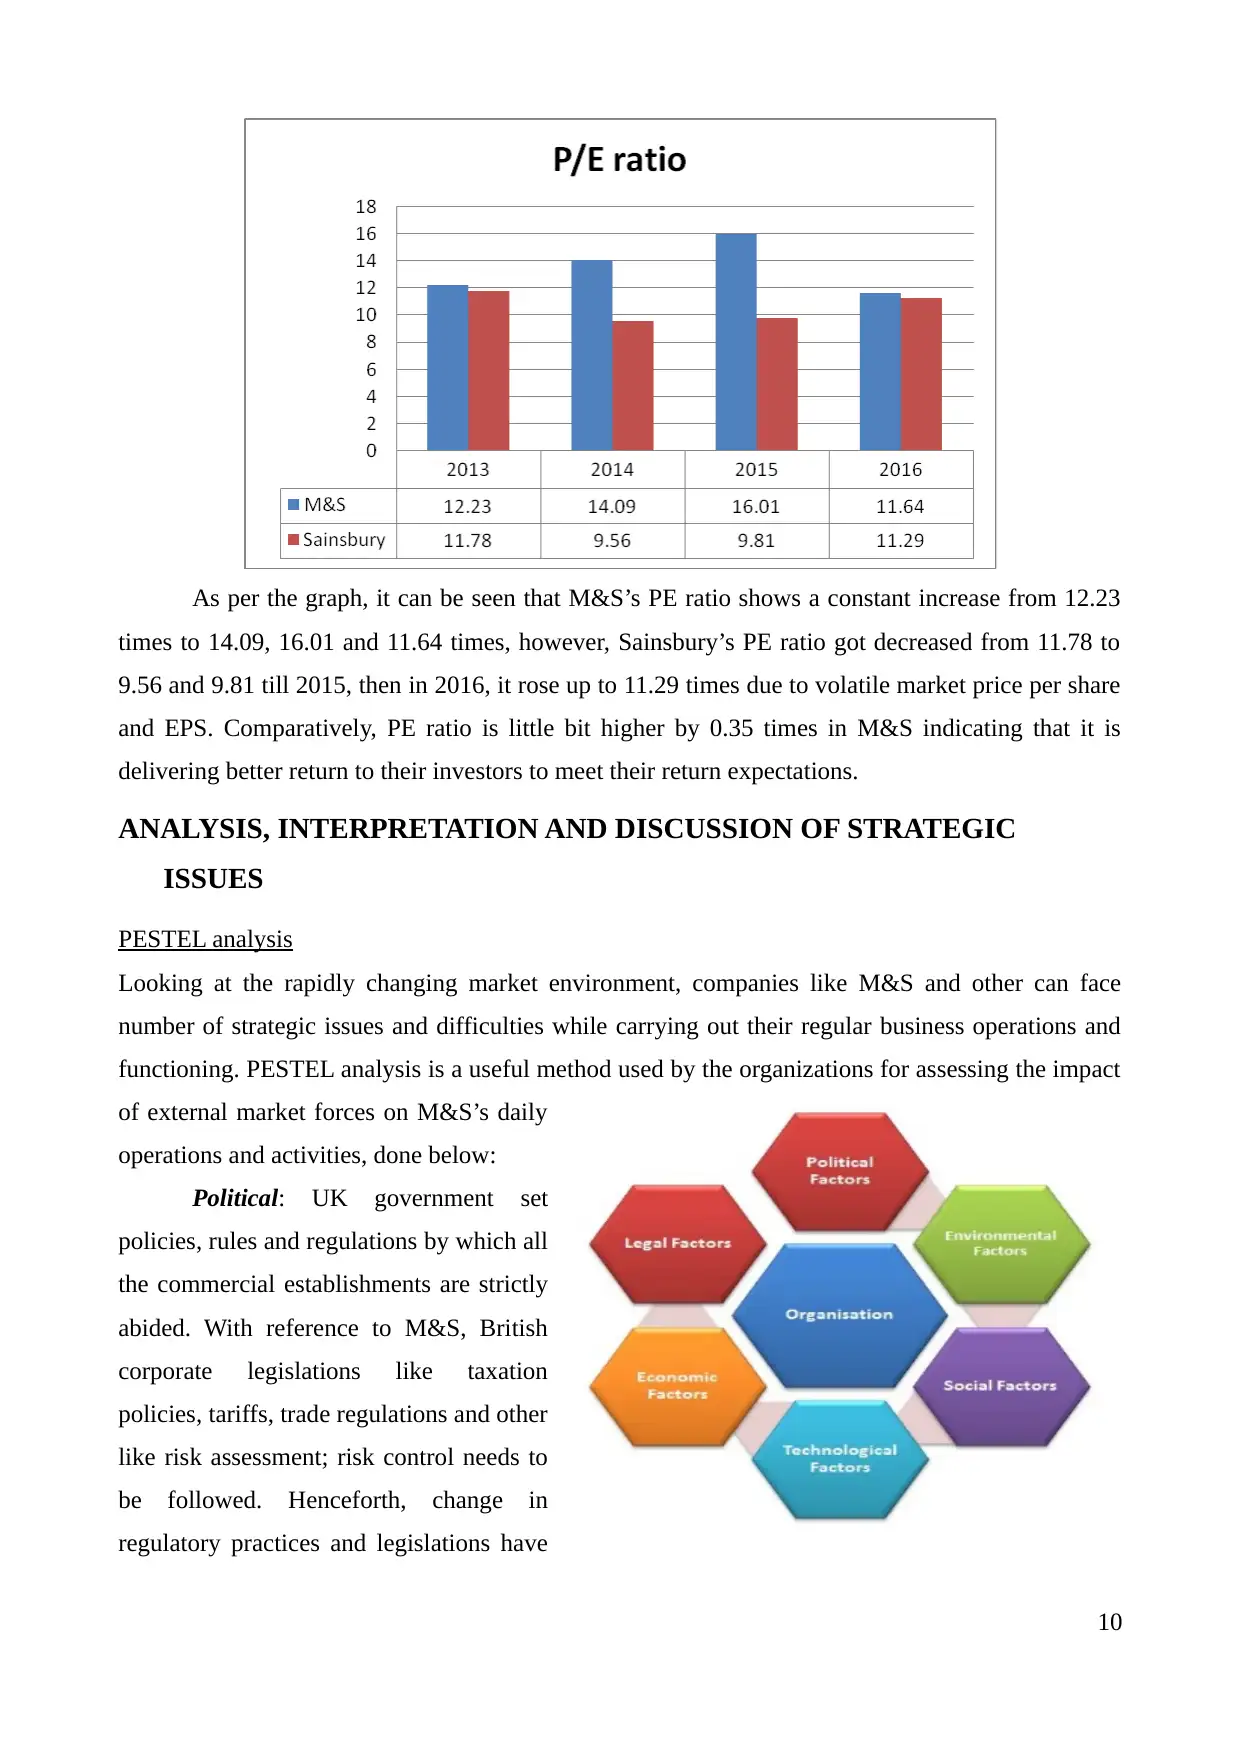
As per the graph, it can be seen that M&S’s PE ratio shows a constant increase from 12.23
times to 14.09, 16.01 and 11.64 times, however, Sainsbury’s PE ratio got decreased from 11.78 to
9.56 and 9.81 till 2015, then in 2016, it rose up to 11.29 times due to volatile market price per share
and EPS. Comparatively, PE ratio is little bit higher by 0.35 times in M&S indicating that it is
delivering better return to their investors to meet their return expectations.
ANALYSIS, INTERPRETATION AND DISCUSSION OF STRATEGIC
ISSUES
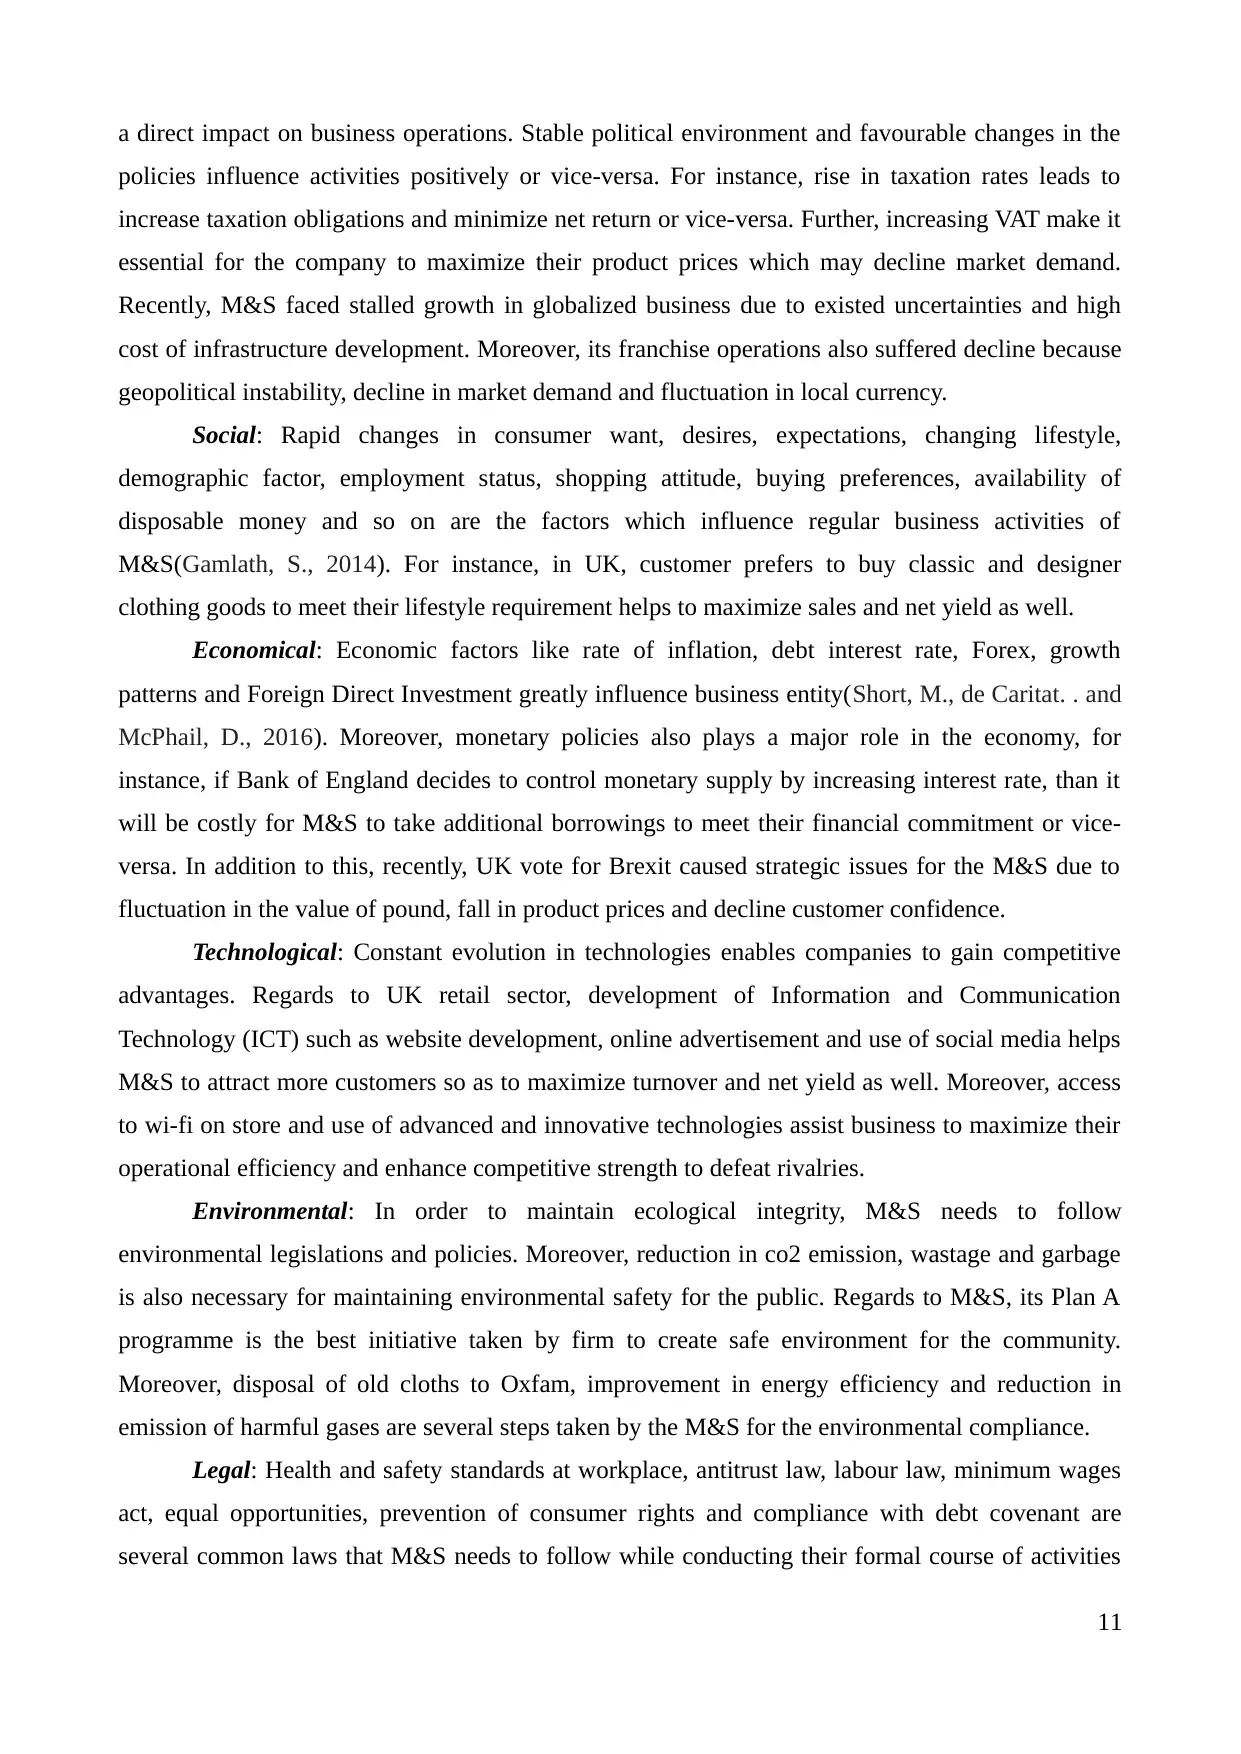
PESTEL analysis
Looking at the rapidly changing market environment, companies like M&S and other can face
number of strategic issues and difficulties while carrying out their regular business operations and
functioning. PESTEL analysis is a useful method used by the organizations for assessing the impact
of external market forces on M&S’s daily
operations and activities, done below:
Political: UK government set
policies, rules and regulations by which all
the commercial establishments are strictly
abided. With reference to M&S, British
corporate legislations like taxation
policies, tariffs, trade regulations and other
like risk assessment; risk control needs to
be followed. Henceforth, change in
regulatory practices and legislations have
10
times to 14.09, 16.01 and 11.64 times, however, Sainsbury’s PE ratio got decreased from 11.78 to
9.56 and 9.81 till 2015, then in 2016, it rose up to 11.29 times due to volatile market price per share
and EPS. Comparatively, PE ratio is little bit higher by 0.35 times in M&S indicating that it is
delivering better return to their investors to meet their return expectations.
ANALYSIS, INTERPRETATION AND DISCUSSION OF STRATEGIC
ISSUES
PESTEL analysis
Looking at the rapidly changing market environment, companies like M&S and other can face
number of strategic issues and difficulties while carrying out their regular business operations and
functioning. PESTEL analysis is a useful method used by the organizations for assessing the impact
of external market forces on M&S’s daily
operations and activities, done below:
Political: UK government set
policies, rules and regulations by which all
the commercial establishments are strictly
abided. With reference to M&S, British
corporate legislations like taxation
policies, tariffs, trade regulations and other
like risk assessment; risk control needs to
be followed. Henceforth, change in
regulatory practices and legislations have
10
Paraphrase This Document
Need a fresh take? Get an instant paraphrase of this document with our AI Paraphraser
a direct impact on business operations. Stable political environment and favourable changes in the
policies influence activities positively or vice-versa. For instance, rise in taxation rates leads to
increase taxation obligations and minimize net return or vice-versa. Further, increasing VAT make it
essential for the company to maximize their product prices which may decline market demand.
Recently, M&S faced stalled growth in globalized business due to existed uncertainties and high
cost of infrastructure development. Moreover, its franchise operations also suffered decline because
geopolitical instability, decline in market demand and fluctuation in local currency.
Social: Rapid changes in consumer want, desires, expectations, changing lifestyle,
demographic factor, employment status, shopping attitude, buying preferences, availability of
disposable money and so on are the factors which influence regular business activities of
M&S(Gamlath, S., 2014). For instance, in UK, customer prefers to buy classic and designer
clothing goods to meet their lifestyle requirement helps to maximize sales and net yield as well.
Economical: Economic factors like rate of inflation, debt interest rate, Forex, growth
patterns and Foreign Direct Investment greatly influence business entity(Short, M., de Caritat. . and
McPhail, D., 2016). Moreover, monetary policies also plays a major role in the economy, for
instance, if Bank of England decides to control monetary supply by increasing interest rate, than it
will be costly for M&S to take additional borrowings to meet their financial commitment or vice-
versa. In addition to this, recently, UK vote for Brexit caused strategic issues for the M&S due to
fluctuation in the value of pound, fall in product prices and decline customer confidence.
Technological: Constant evolution in technologies enables companies to gain competitive
advantages. Regards to UK retail sector, development of Information and Communication
Technology (ICT) such as website development, online advertisement and use of social media helps
M&S to attract more customers so as to maximize turnover and net yield as well. Moreover, access
to wi-fi on store and use of advanced and innovative technologies assist business to maximize their
operational efficiency and enhance competitive strength to defeat rivalries.
Environmental: In order to maintain ecological integrity, M&S needs to follow
environmental legislations and policies. Moreover, reduction in co2 emission, wastage and garbage
is also necessary for maintaining environmental safety for the public. Regards to M&S, its Plan A
programme is the best initiative taken by firm to create safe environment for the community.
Moreover, disposal of old cloths to Oxfam, improvement in energy efficiency and reduction in
emission of harmful gases are several steps taken by the M&S for the environmental compliance.
Legal: Health and safety standards at workplace, antitrust law, labour law, minimum wages
act, equal opportunities, prevention of consumer rights and compliance with debt covenant are
several common laws that M&S needs to follow while conducting their formal course of activities
11
and operations(Vogel, H., 2014).
Modified Porter’s 5 forces/Porter’s 6 forces model
This model extended previous porter’s 5 forces model by adding one additional element that
is complementary products. M&S’s competitor analysis by porter’s 5 forces model is conducted
here as under:
Threat of new entrants: British retail industry has a low entry threats mainly due to excess
capital requirement for infrastructure development, high level of competition and well-established
and branded firms. Despite this, currently, M&S is facing intense competition from the existed
retailers like Tesco, Sainsbury and WM Morrison as well. Furthermore, fashion brands like Hennes
& Mauritz, Zara and Next Plc are offering fashionable and designer clothing goods to the
consumers. M&S’s online operations are considered as an effective step to gain competitive
advantageous over the rivalries.
Threat of substitute products: Every British retailer is highly focusing to design innovative
products to keep in-line with the changing customer requirement and expectations. Henceforth,
threats in relation to availability of substitute products are high. M&S’s global market position is
strongly threatened by the the homogenous and similar kind of products and service offered by
competitors like Tesco, Sainsbury and ASDA.
Bargaining power of customers: Customers have high bargaining power and they are price
sensitive also who demand designer and fashionable items at cheaper prices(Khatkar, B., Barak,.
and Mudgil., 2013.). In the beginning times, M&S adopted product-oriented business strategy so as
to strongly emphasize their brand loyalty among audiences. But with the changing conditions, this
strategy does not proven beneficial for the company and competitors employed customer–
orientation strategy to build stronger relationship. Recently, in June 2016, UK voted to leave EU
results in decreased customer confidence make it essential for the M&S to cut down their product
prices and affect sales adversely.
Bargaining power of Suppliers: M&S buy required materials from many British suppliers,
in the beginning period; they have high power to bargain. High cost charged by suppliers resulted in
decreased return and as a result, over the years, M&S started to buy material at competitive prices
from overseas suppliers. This move of retailers decreased suppliers bargaining power to a great
extent. Henceforth, it can be interpreted that now-a-days, British suppliers have less bargaining
power.
Intensity of competitive rivalries: M&S is facing intense competition from the rivalries like
Tesco Plc, Sainsbury, ASDA and WM Morrison. Online offering, high-quality product, pricing
12
⊘ This is a preview!⊘
Do you want full access?
Subscribe today to unlock all pages.
Trusted by 1+ million students worldwide
1 out of 17
Related Documents


Your All-in-One AI-Powered Toolkit for Academic Success.
+13062052269
info@desklib.com
Available 24*7 on WhatsApp / Email
![[object Object]](/_next/static/media/star-bottom.7253800d.svg)
Unlock your academic potential
Copyright © 2020–2026 A2Z Services. All Rights Reserved. Developed and managed by ZUCOL.