Comprehensive Business Analysis: Stationary Market Trends in Europe
VerifiedAdded on 2020/07/22
|11
|2547
|132
Report
AI Summary
This report presents a comprehensive business analysis of the stationary market, focusing on Germany and other European nations. It begins with an introduction to the industry and its growth, followed by an analysis of market trends, including the decline in demand for stationary items due to digitalization and a decreasing number of children. The report examines per capita expenditure on stationary items, highlighting the UK, Germany, and France as potential expansion markets. It analyzes total sales data, forecasts future sales, and presents a mixed pie chart illustrating sales of various items. Correlation coefficients and scatter diagrams are used to analyze the relationship between sales and years. The report also includes a table showing expansion opportunities in Germany and Belgium, along with an application of international standards. Financial calculations, such as loan repayment amounts and confidence intervals, are also included. The report concludes with recommendations based on the analysis, emphasizing the need for businesses to improve product quality to meet customer expectations. The data was gathered using questionnaires, and descriptive statistics were used to analyze the data.

BUSINESS ANALYSIS
Paraphrase This Document
Need a fresh take? Get an instant paraphrase of this document with our AI Paraphraser
TABLE OF CONTENTS
INTRODUCTION...........................................................................................................................1
TASK 1............................................................................................................................................1
TASK 2............................................................................................................................................1
Per capital expenditure on stationary items in European nations................................................1
TASK 3............................................................................................................................................2
(a)Total sales................................................................................................................................2
(b)Mixed pie chart.......................................................................................................................2
© Coorelation cofficient and scatter diagram.............................................................................3
(d) Forecast total sales for 2018 and 2019...................................................................................3
TASK 4............................................................................................................................................4
(a)Table to show expansion opportunity in Germany and Belgium............................................4
(b) Application of international standards to EU nations............................................................4
TASK 5............................................................................................................................................4
(a)Repayment amount..................................................................................................................4
(b) Interest payment only.............................................................................................................5
TASK 6............................................................................................................................................5
Calcualtion of confidence interval...............................................................................................5
TASK 7............................................................................................................................................6
(a)Problem of non filling of questionnaire..................................................................................6
(b) Descriptive statistics..............................................................................................................6
TASK 8............................................................................................................................................7
Conclusion and recomendation....................................................................................................7
REFERENCE..................................................................................................................................8
APPENDIX......................................................................................................................................9

⊘ This is a preview!⊘
Do you want full access?
Subscribe today to unlock all pages.
Trusted by 1+ million students worldwide
INTRODUCTION
Statioanry business is one of the busines that is growing in Germany and other European
nations. In present research study data analysis is done and on that basis trends that are in market
are identified. Firm related varied facts and figures are analyzed in proper manner by applying
relevant tools and preparing graphs. Descriptive statistics are also used to analyze data that is
gathered by distributing questionnaire. At end of the report, conclusion is prepard and
recommendation is made.
TASK 1
Trends are not good in Germany for wholesale retail as it can be seen that day by day
demand for stationary is reducing consistently which is not good for business. There are number
of reasons behind this as it can be seen that in comparison to past years there are small number of
childrens and due to this reason demand for stationary items declined sharply (Musiolik and
Markard, 2011). Apart from this, digitalization also happened across the nation and due to this
reason also more and more work is now done on papers and this lead to decline in demand of
office supplies which heavily affect wholesale staionary business in Germany and other
European nations. Hence, it can be said that condition for wholesale stationary business firms is
critical and they need to do lots of things to survive in tough conditiions.
TASK 2
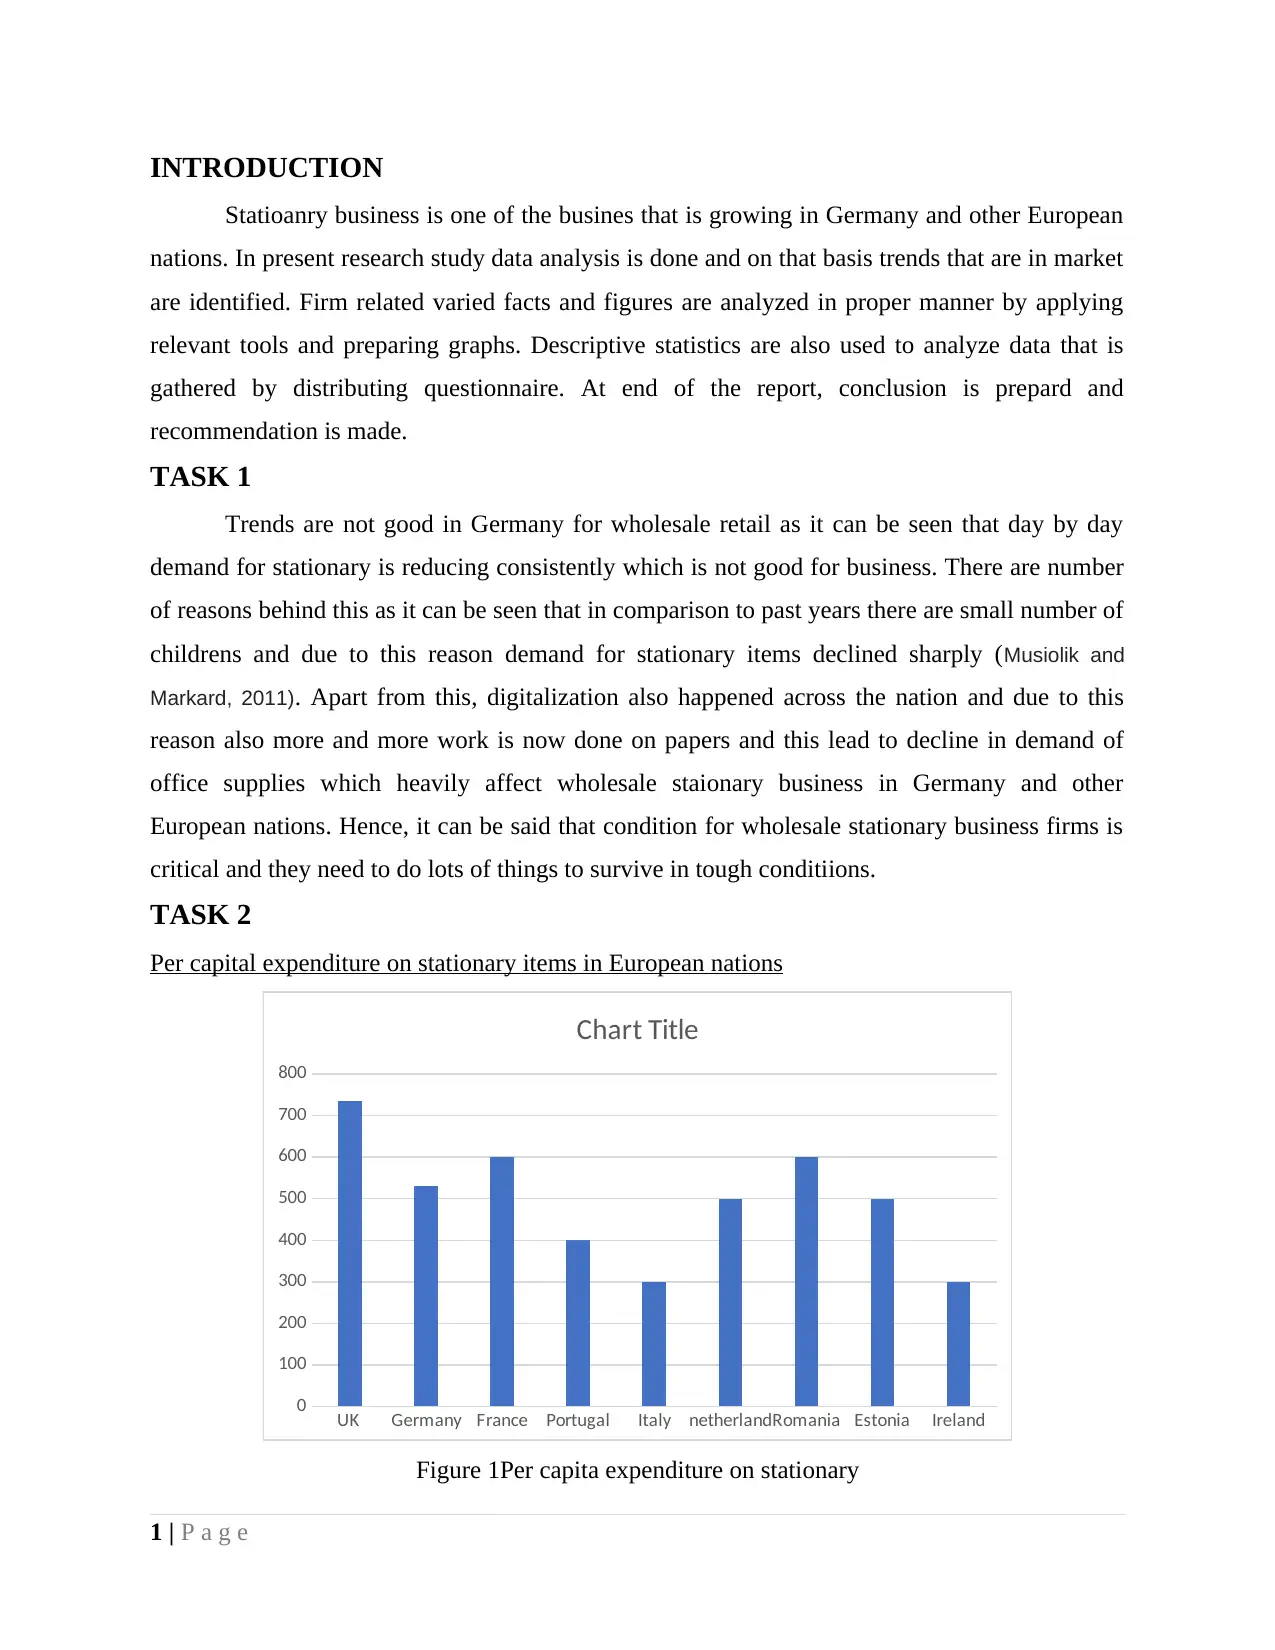
Per capital expenditure on stationary items in European nations
UK Germany France Portugal Italy netherlandRomania Estonia Ireland
0
100
200
300
400
500
600
700
800
Chart Title
Figure 1Per capita expenditure on stationary
1 | P a g e
Statioanry business is one of the busines that is growing in Germany and other European
nations. In present research study data analysis is done and on that basis trends that are in market
are identified. Firm related varied facts and figures are analyzed in proper manner by applying
relevant tools and preparing graphs. Descriptive statistics are also used to analyze data that is
gathered by distributing questionnaire. At end of the report, conclusion is prepard and
recommendation is made.
TASK 1
Trends are not good in Germany for wholesale retail as it can be seen that day by day
demand for stationary is reducing consistently which is not good for business. There are number
of reasons behind this as it can be seen that in comparison to past years there are small number of
childrens and due to this reason demand for stationary items declined sharply (Musiolik and
Markard, 2011). Apart from this, digitalization also happened across the nation and due to this
reason also more and more work is now done on papers and this lead to decline in demand of
office supplies which heavily affect wholesale staionary business in Germany and other
European nations. Hence, it can be said that condition for wholesale stationary business firms is
critical and they need to do lots of things to survive in tough conditiions.
TASK 2
Per capital expenditure on stationary items in European nations
UK Germany France Portugal Italy netherlandRomania Estonia Ireland
0
100
200
300
400
500
600
700
800
Chart Title
Figure 1Per capita expenditure on stationary
1 | P a g e
Paraphrase This Document
Need a fresh take? Get an instant paraphrase of this document with our AI Paraphraser
It can be observed that higher customer spending per capital on staionary products is in
case of UK, Germany and France in comparison to other nations of EU (How much is spend per
student, 2014). Hence, if any firm wants to expand its business in EU then these nations may be
preffered choice.
TASK 3
(a)Total sales
Total sales in year 2015 was 165000 and same for 2016 is 175000 followed by year 2017
in which sales was 385000. It can be said that sales increased by 6% in year 2016 and same
increased by 2% in next year. On this basis it can be said that sales is increasing but relatively at
slow rate on yearly basis. It can be said thast there is pressure on sales and increased automation
as well as use of computers lead to decline in price of stationary items at workplace. There is
need to formulate appropriate strategy in the busienss so that performance can be improved to
great extent. In the industry there are few players that are oprating retail chains where staitionary
items are available of any sort at all price levels. People prefer to make purchase from such kind
of shops. Hence, overall conclusion is that sitiatio is going to be worse and step need to be taken
to handle situation.
(b)Mixed pie chart
15%
15%
10%
14%
17%
11%
17%
12%
13%
10%
15%16%
15%
18%
Printet cartridges
General office supplies
Low cost printers
Office furniture
Shredders
Paper based supplies
Writing/Drawing materials
Figure 2Mixed pie chart of sales of items
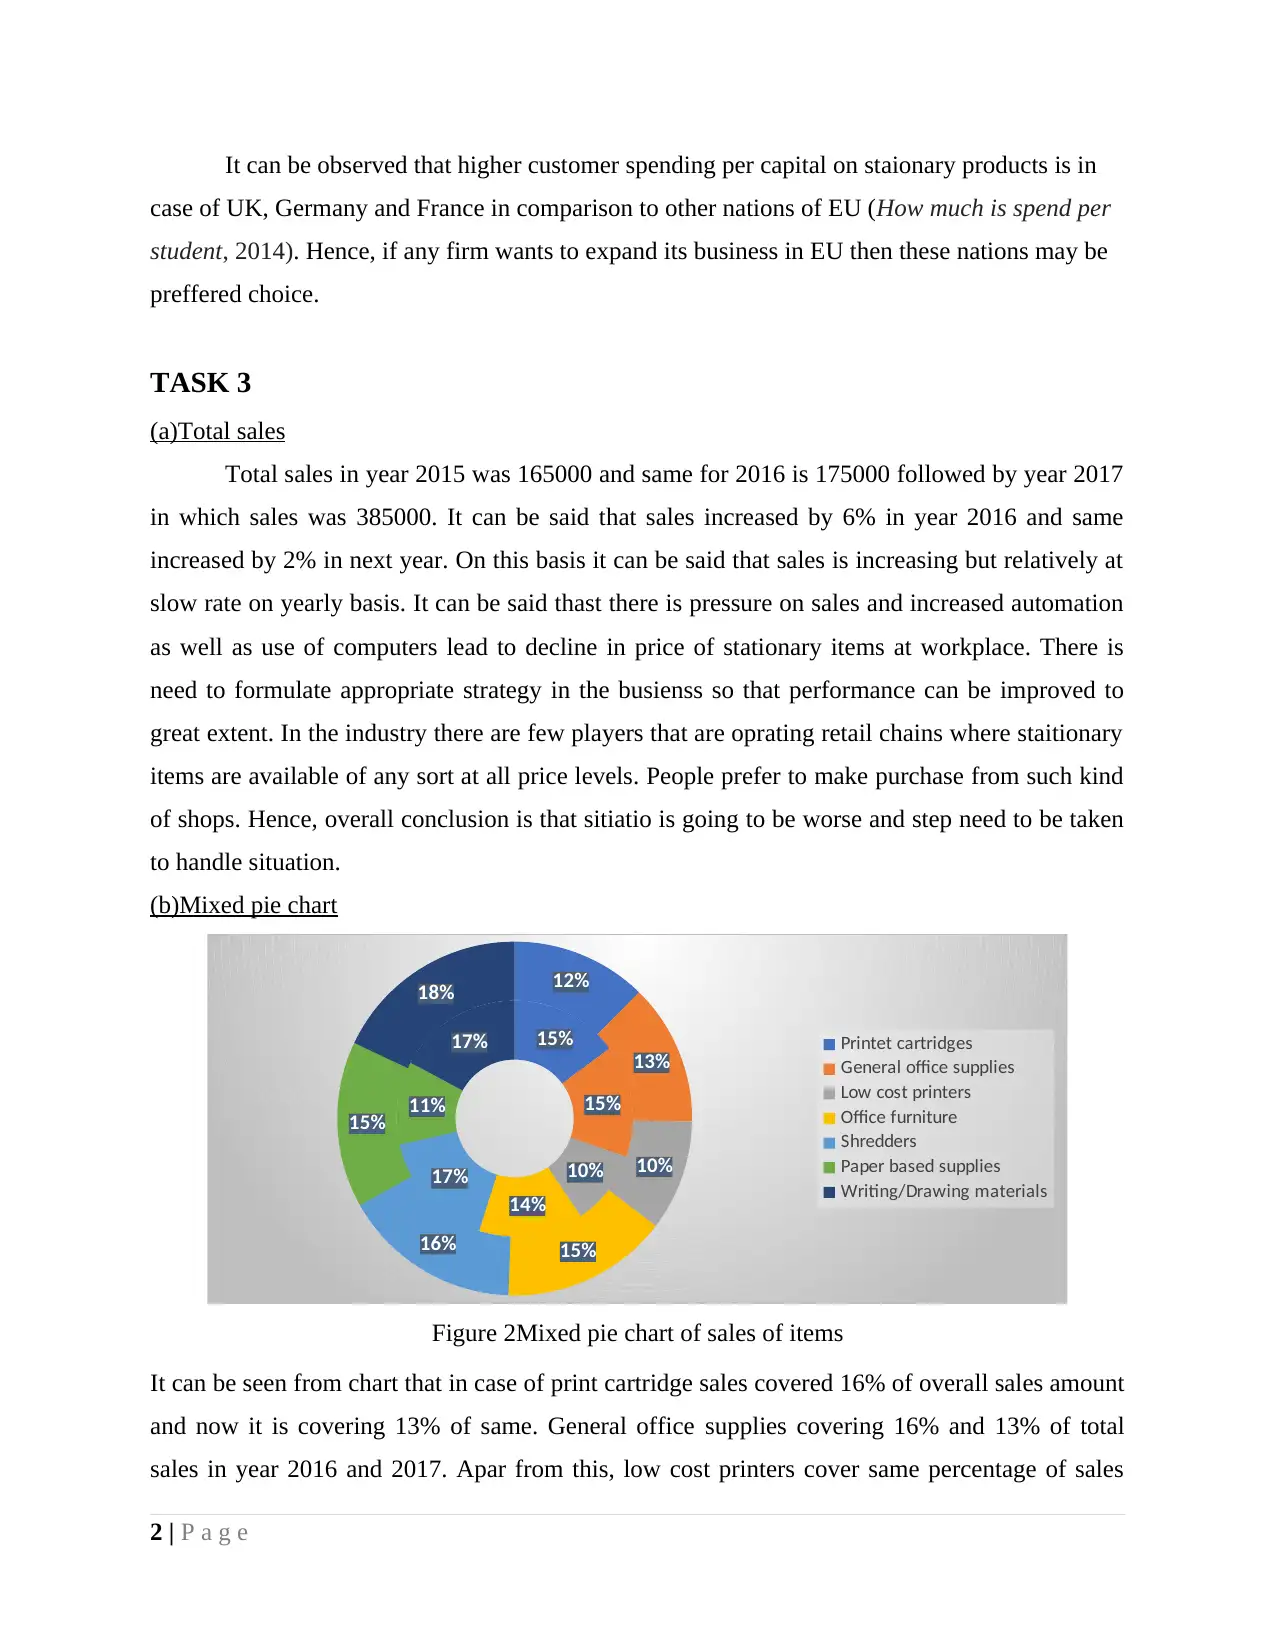
It can be seen from chart that in case of print cartridge sales covered 16% of overall sales amount
and now it is covering 13% of same. General office supplies covering 16% and 13% of total
sales in year 2016 and 2017. Apar from this, low cost printers cover same percentage of sales
2 | P a g e
case of UK, Germany and France in comparison to other nations of EU (How much is spend per
student, 2014). Hence, if any firm wants to expand its business in EU then these nations may be
preffered choice.
TASK 3
(a)Total sales
Total sales in year 2015 was 165000 and same for 2016 is 175000 followed by year 2017
in which sales was 385000. It can be said that sales increased by 6% in year 2016 and same
increased by 2% in next year. On this basis it can be said that sales is increasing but relatively at
slow rate on yearly basis. It can be said thast there is pressure on sales and increased automation
as well as use of computers lead to decline in price of stationary items at workplace. There is
need to formulate appropriate strategy in the busienss so that performance can be improved to
great extent. In the industry there are few players that are oprating retail chains where staitionary
items are available of any sort at all price levels. People prefer to make purchase from such kind
of shops. Hence, overall conclusion is that sitiatio is going to be worse and step need to be taken
to handle situation.
(b)Mixed pie chart
15%
15%
10%
14%
17%
11%
17%
12%
13%
10%
15%16%
15%
18%
Printet cartridges
General office supplies
Low cost printers
Office furniture
Shredders
Paper based supplies
Writing/Drawing materials
Figure 2Mixed pie chart of sales of items
It can be seen from chart that in case of print cartridge sales covered 16% of overall sales amount
and now it is covering 13% of same. General office supplies covering 16% and 13% of total
sales in year 2016 and 2017. Apar from this, low cost printers cover same percentage of sales
2 | P a g e
11% in 2016 and same increased to 10% in year 2017. It can be seen from image that furnitutre
cover 15% of sales in 2016 and this percentage coverage remain same in year 2017. Shreeders
cover 18% and 17% portion of sales in year 2016 and 2017. Along with this, paper based supply
cover 12% and 15% of total sales that was made in year 2016 and 2017. Like furnitutre drawing
materials cover same percentage of sales which is 18% in year 2016 and 2017. It can be said that
there is not so big difference in proportion that different items sold by the firm cover of sales.
Means that all product lines are equally important for the firm.
© Coorelation cofficient and scatter diagram
2014.5 2015 2015.5 2016 2016.5 2017 2017.5
155000
160000
165000
170000
175000
180000
165000
175000
178000
f(x) = 85.6492003047708 x
R² = 0.998989719296272
Sales
Figure 3Scatter plot
Regression Statistics
Multiple R
0.9549
19
R Square
0.9118
71
Adjusted R Square
0.8237
41
Standard Error
2857.7
38
Observations 3
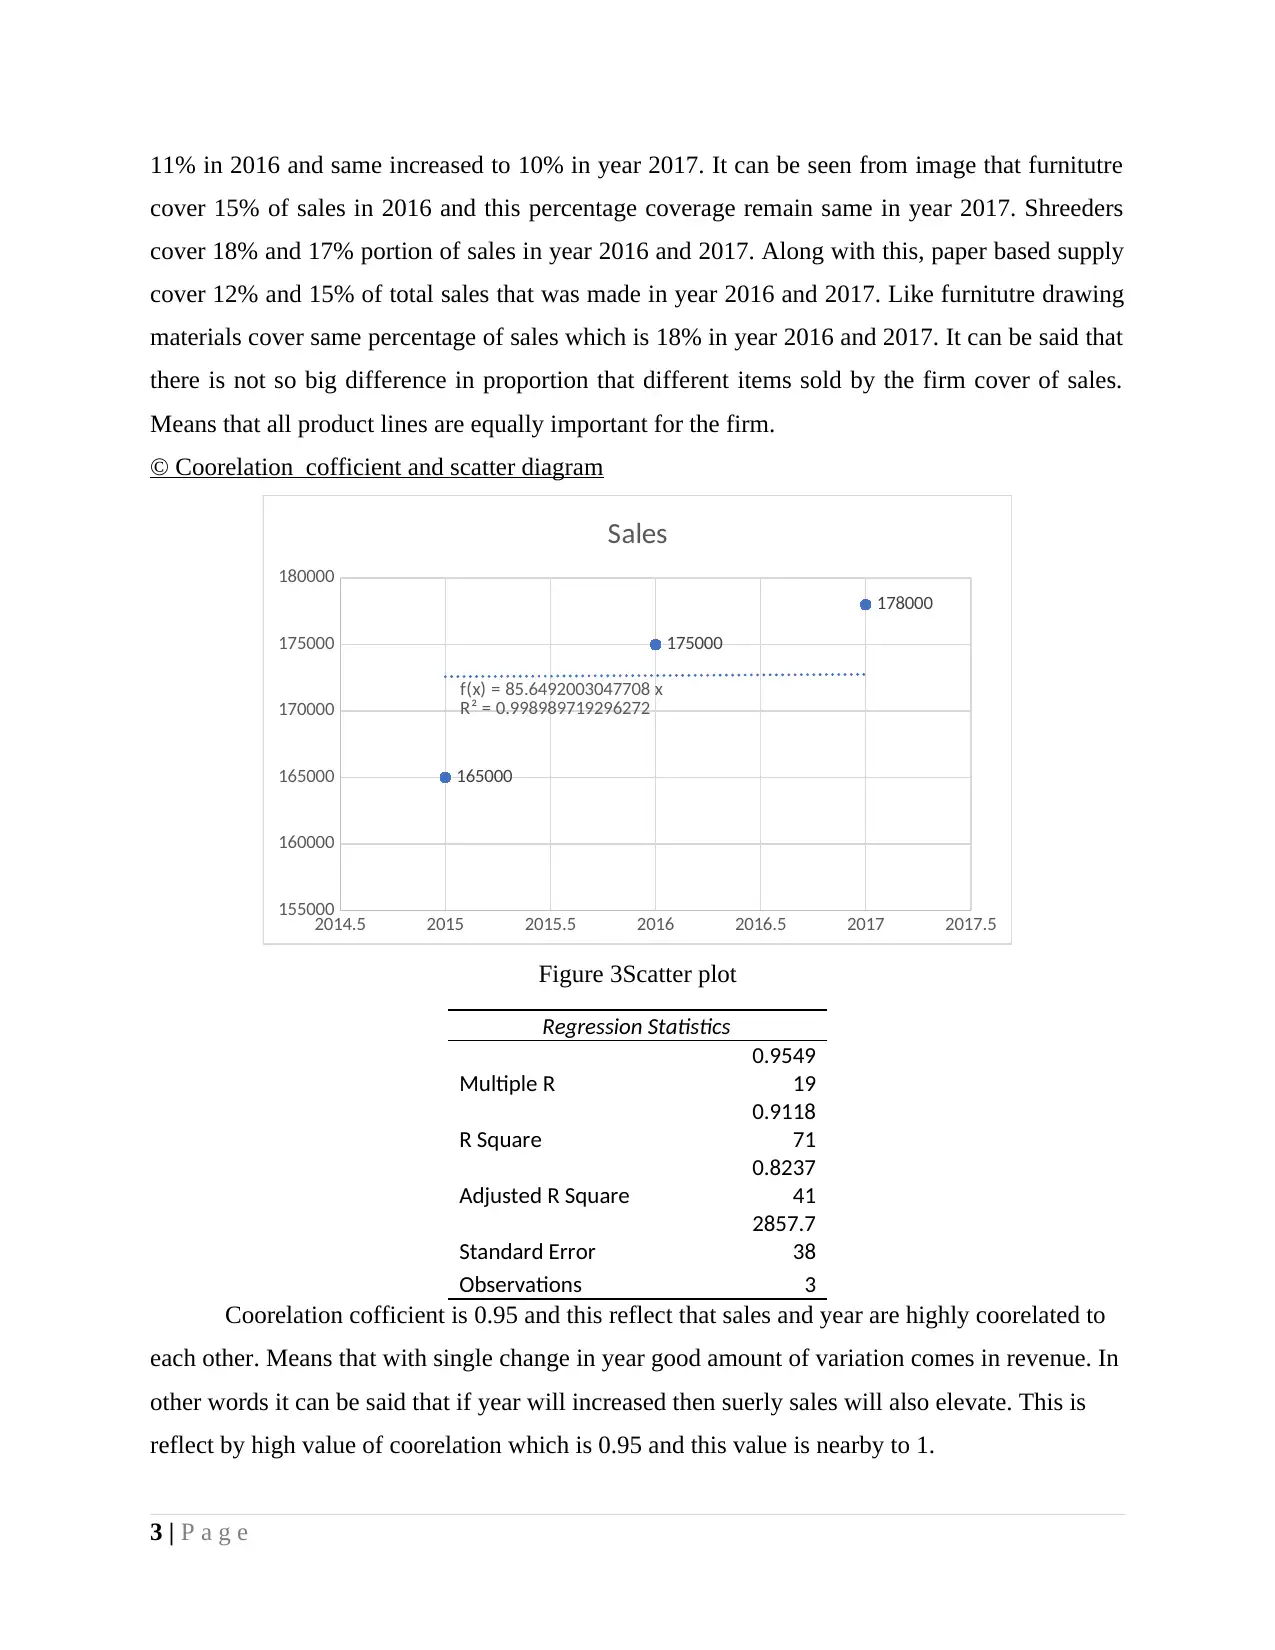
Coorelation cofficient is 0.95 and this reflect that sales and year are highly coorelated to
each other. Means that with single change in year good amount of variation comes in revenue. In
other words it can be said that if year will increased then suerly sales will also elevate. This is
reflect by high value of coorelation which is 0.95 and this value is nearby to 1.
3 | P a g e
cover 15% of sales in 2016 and this percentage coverage remain same in year 2017. Shreeders
cover 18% and 17% portion of sales in year 2016 and 2017. Along with this, paper based supply
cover 12% and 15% of total sales that was made in year 2016 and 2017. Like furnitutre drawing
materials cover same percentage of sales which is 18% in year 2016 and 2017. It can be said that
there is not so big difference in proportion that different items sold by the firm cover of sales.
Means that all product lines are equally important for the firm.
© Coorelation cofficient and scatter diagram
2014.5 2015 2015.5 2016 2016.5 2017 2017.5
155000
160000
165000
170000
175000
180000
165000
175000
178000
f(x) = 85.6492003047708 x
R² = 0.998989719296272
Sales
Figure 3Scatter plot
Regression Statistics
Multiple R
0.9549
19
R Square
0.9118
71
Adjusted R Square
0.8237
41
Standard Error
2857.7
38
Observations 3
Coorelation cofficient is 0.95 and this reflect that sales and year are highly coorelated to
each other. Means that with single change in year good amount of variation comes in revenue. In
other words it can be said that if year will increased then suerly sales will also elevate. This is
reflect by high value of coorelation which is 0.95 and this value is nearby to 1.
3 | P a g e
⊘ This is a preview!⊘
Do you want full access?
Subscribe today to unlock all pages.
Trusted by 1+ million students worldwide
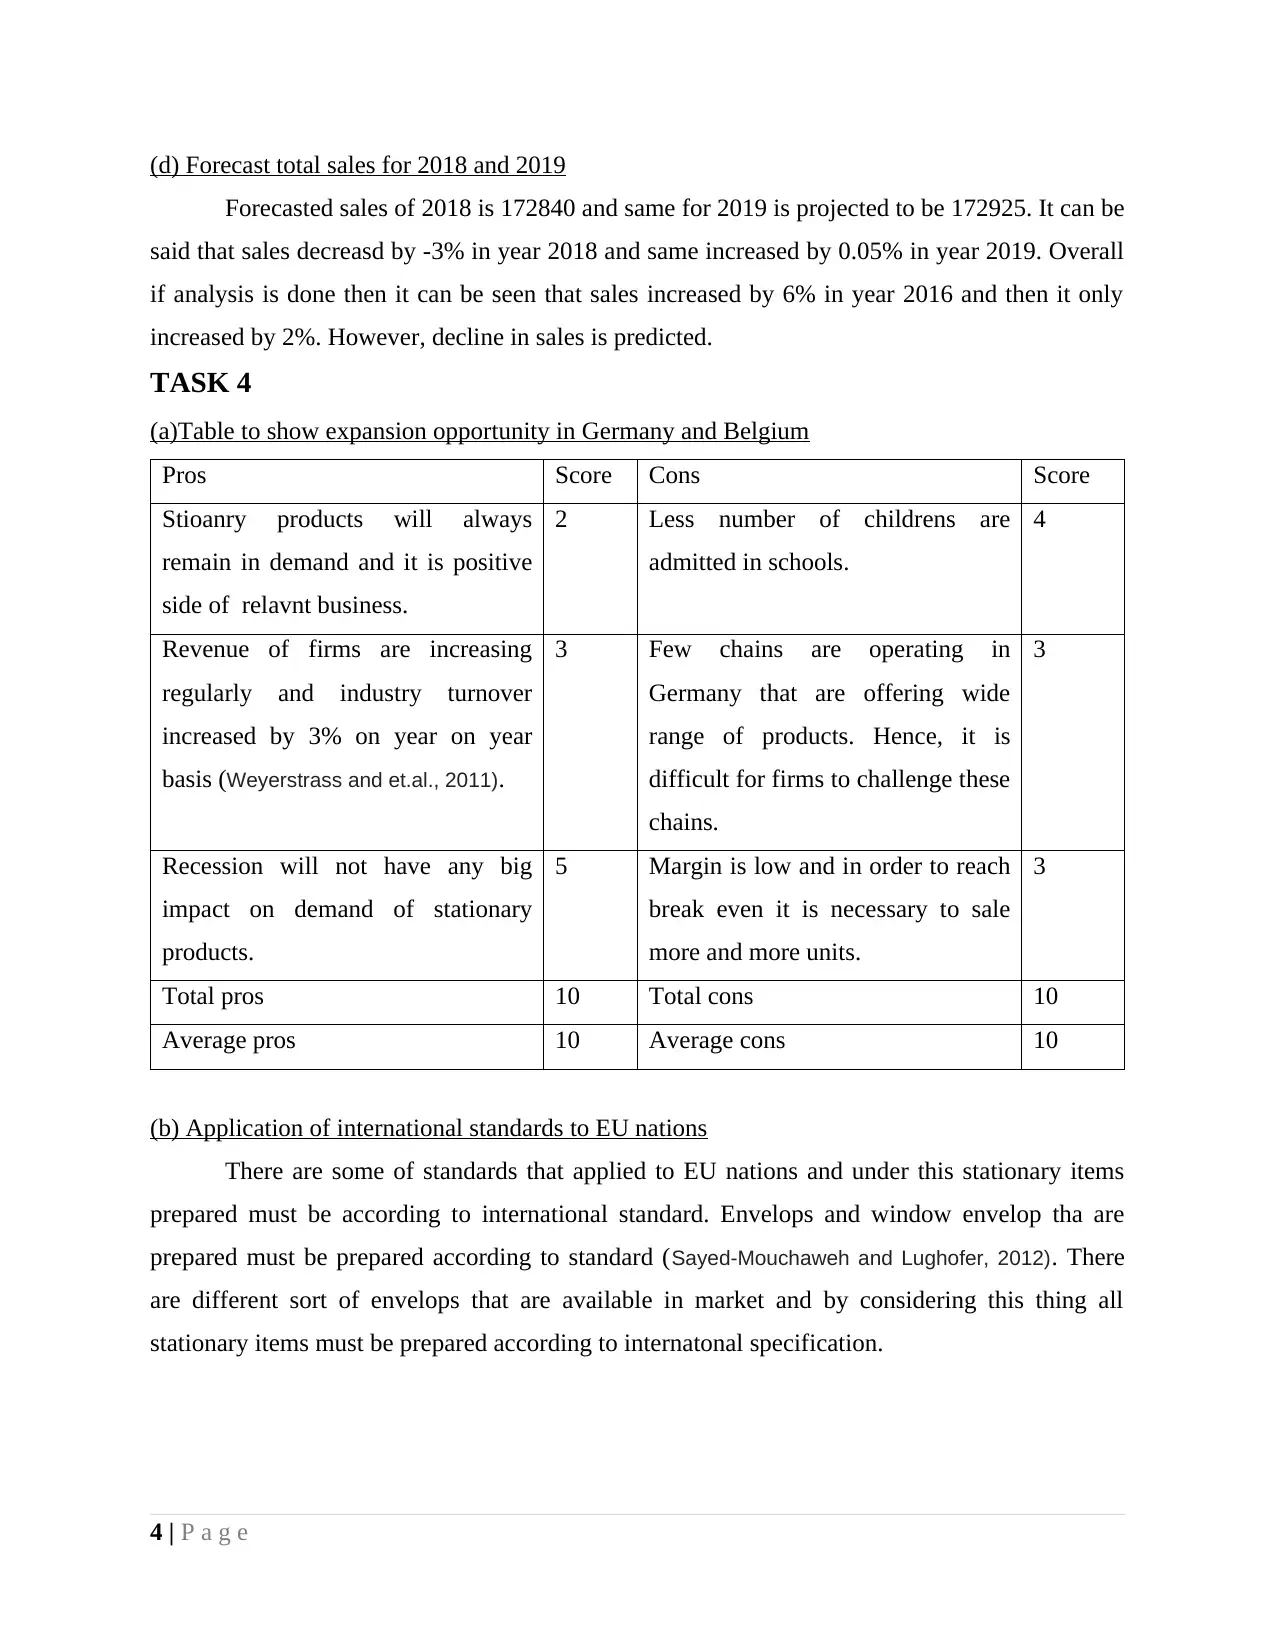
(d) Forecast total sales for 2018 and 2019
Forecasted sales of 2018 is 172840 and same for 2019 is projected to be 172925. It can be
said that sales decreasd by -3% in year 2018 and same increased by 0.05% in year 2019. Overall
if analysis is done then it can be seen that sales increased by 6% in year 2016 and then it only
increased by 2%. However, decline in sales is predicted.
TASK 4
(a)Table to show expansion opportunity in Germany and Belgium
Pros Score Cons Score
Stioanry products will always
remain in demand and it is positive
side of relavnt business.
2 Less number of childrens are
admitted in schools.
4
Revenue of firms are increasing
regularly and industry turnover
increased by 3% on year on year
basis (Weyerstrass and et.al., 2011).
3 Few chains are operating in
Germany that are offering wide
range of products. Hence, it is
difficult for firms to challenge these
chains.
3
Recession will not have any big
impact on demand of stationary
products.
5 Margin is low and in order to reach
break even it is necessary to sale
more and more units.
3
Total pros 10 Total cons 10
Average pros 10 Average cons 10
(b) Application of international standards to EU nations
There are some of standards that applied to EU nations and under this stationary items
prepared must be according to international standard. Envelops and window envelop tha are
prepared must be prepared according to standard (Sayed-Mouchaweh and Lughofer, 2012). There
are different sort of envelops that are available in market and by considering this thing all
stationary items must be prepared according to internatonal specification.
4 | P a g e
Paraphrase This Document
Need a fresh take? Get an instant paraphrase of this document with our AI Paraphraser
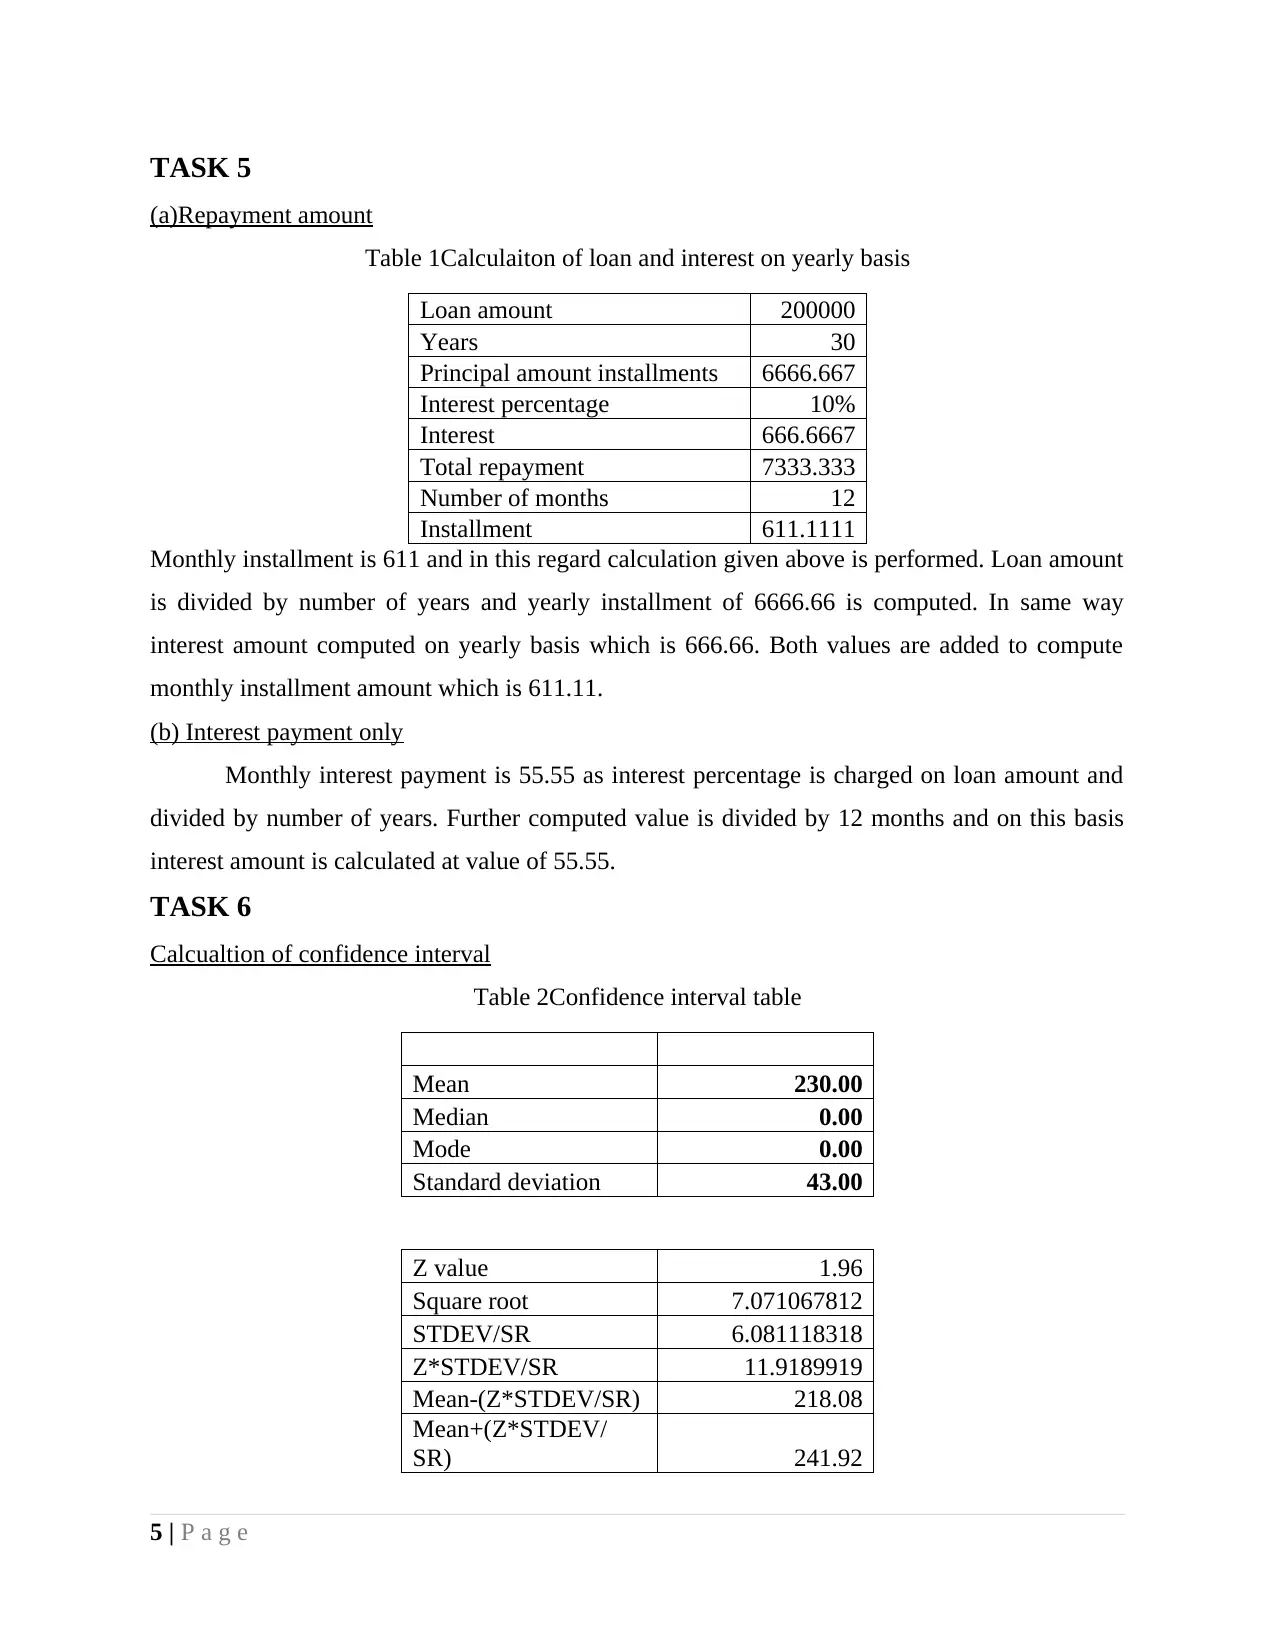
TASK 5
(a)Repayment amount
Table 1Calculaiton of loan and interest on yearly basis
Loan amount 200000
Years 30
Principal amount installments 6666.667
Interest percentage 10%
Interest 666.6667
Total repayment 7333.333
Number of months 12
Installment 611.1111
Monthly installment is 611 and in this regard calculation given above is performed. Loan amount
is divided by number of years and yearly installment of 6666.66 is computed. In same way
interest amount computed on yearly basis which is 666.66. Both values are added to compute
monthly installment amount which is 611.11.
(b) Interest payment only
Monthly interest payment is 55.55 as interest percentage is charged on loan amount and
divided by number of years. Further computed value is divided by 12 months and on this basis
interest amount is calculated at value of 55.55.
TASK 6
Calcualtion of confidence interval
Table 2Confidence interval table
Mean 230.00
Median 0.00
Mode 0.00
Standard deviation 43.00
Z value 1.96
Square root 7.071067812
STDEV/SR 6.081118318
Z*STDEV/SR 11.9189919
Mean-(Z*STDEV/SR) 218.08
Mean+(Z*STDEV/
SR) 241.92
5 | P a g e
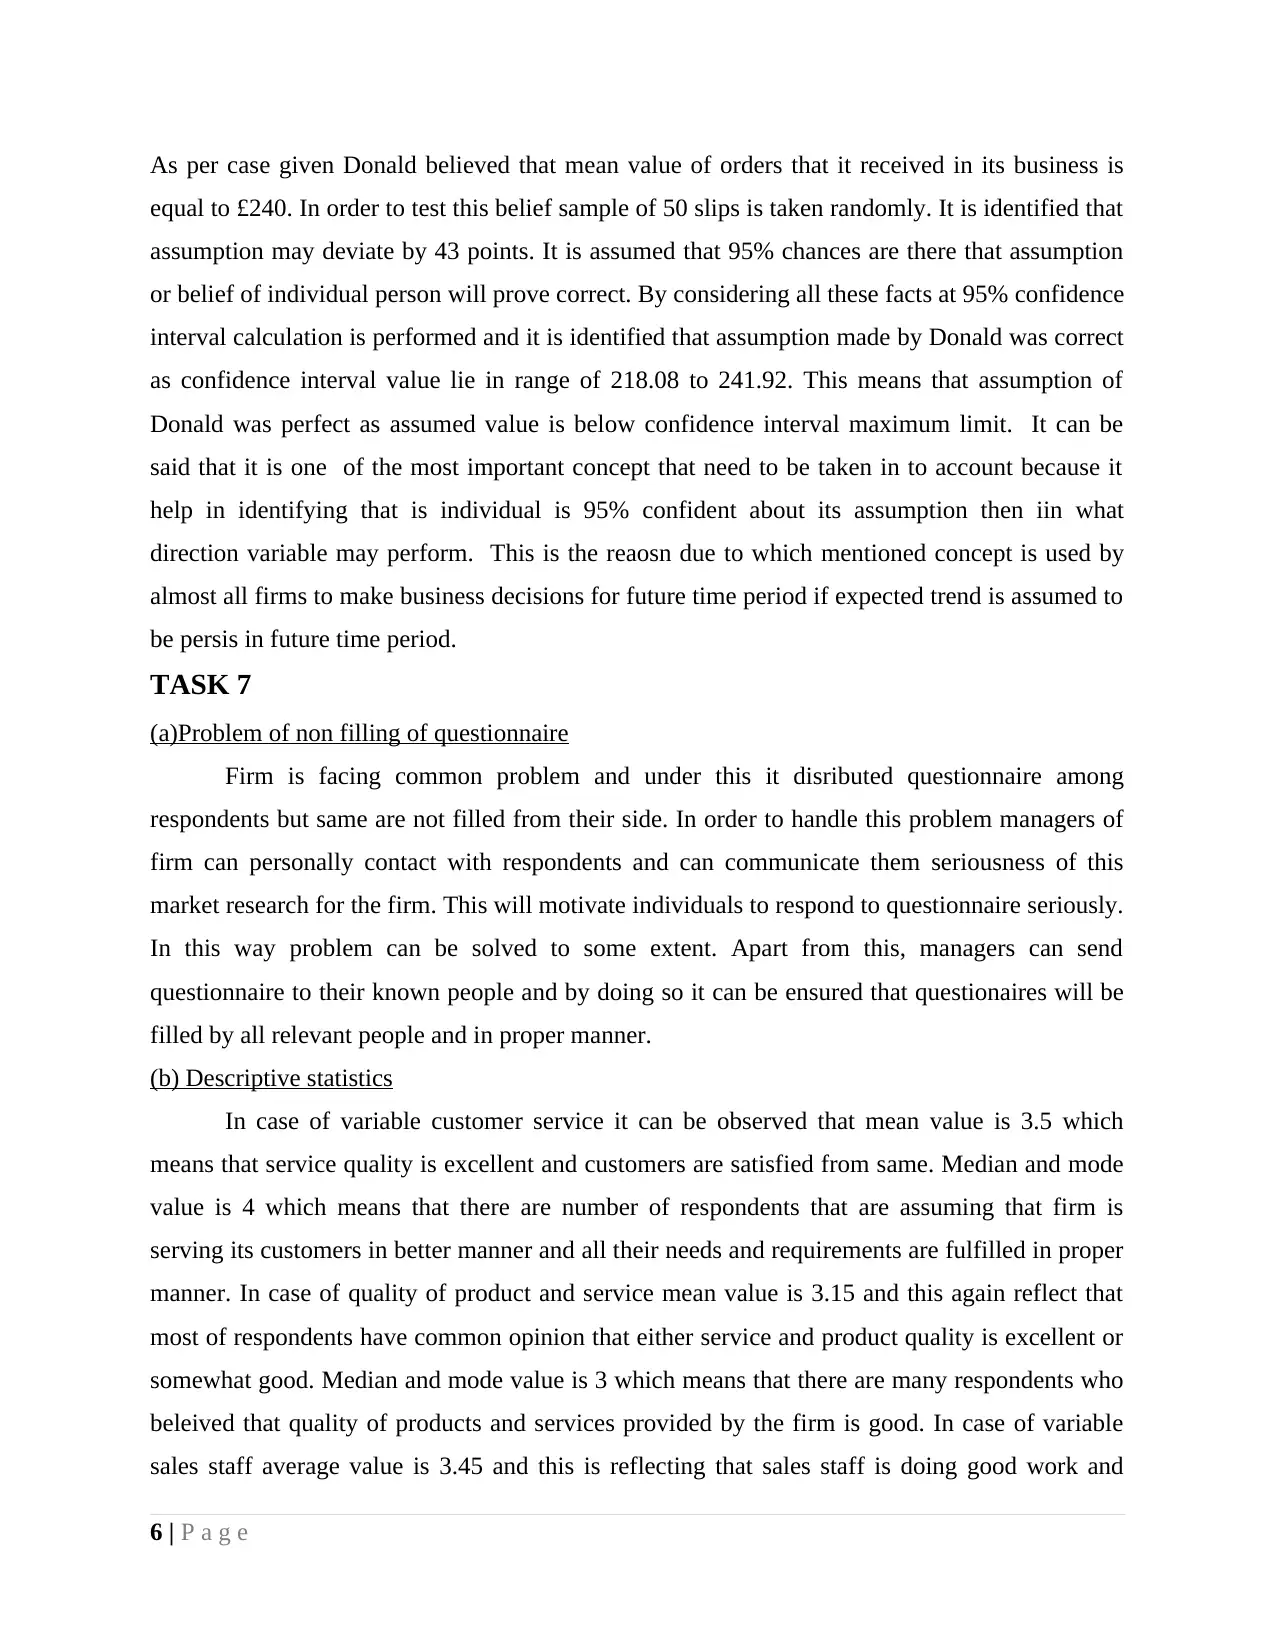
As per case given Donald believed that mean value of orders that it received in its business is
equal to £240. In order to test this belief sample of 50 slips is taken randomly. It is identified that
assumption may deviate by 43 points. It is assumed that 95% chances are there that assumption
or belief of individual person will prove correct. By considering all these facts at 95% confidence
interval calculation is performed and it is identified that assumption made by Donald was correct
as confidence interval value lie in range of 218.08 to 241.92. This means that assumption of
Donald was perfect as assumed value is below confidence interval maximum limit. It can be
said that it is one of the most important concept that need to be taken in to account because it
help in identifying that is individual is 95% confident about its assumption then iin what
direction variable may perform. This is the reaosn due to which mentioned concept is used by
almost all firms to make business decisions for future time period if expected trend is assumed to
be persis in future time period.
TASK 7
(a)Problem of non filling of questionnaire
Firm is facing common problem and under this it disributed questionnaire among
respondents but same are not filled from their side. In order to handle this problem managers of
firm can personally contact with respondents and can communicate them seriousness of this
market research for the firm. This will motivate individuals to respond to questionnaire seriously.
In this way problem can be solved to some extent. Apart from this, managers can send
questionnaire to their known people and by doing so it can be ensured that questionaires will be
filled by all relevant people and in proper manner.
(b) Descriptive statistics
In case of variable customer service it can be observed that mean value is 3.5 which
means that service quality is excellent and customers are satisfied from same. Median and mode
value is 4 which means that there are number of respondents that are assuming that firm is
serving its customers in better manner and all their needs and requirements are fulfilled in proper
manner. In case of quality of product and service mean value is 3.15 and this again reflect that
most of respondents have common opinion that either service and product quality is excellent or
somewhat good. Median and mode value is 3 which means that there are many respondents who
beleived that quality of products and services provided by the firm is good. In case of variable
sales staff average value is 3.45 and this is reflecting that sales staff is doing good work and
6 | P a g e
⊘ This is a preview!⊘
Do you want full access?
Subscribe today to unlock all pages.
Trusted by 1+ million students worldwide
make customers understand about firm product in proper manner. Median and mode value is 4
which meas that there are number of respondents that are extemely satisfied with the firm sales
force. It can be said that there is big role that sales force is playing in creating new customers for
the firm and retaining same in business. While making purchase of any product customers give
main priority to value for money factor. Means that people are prepared to pay more amount for
product but same must deliever good quality. Mean value in respect to variable is 1.95 which can
be considered 2 and this reflect that respondents have common opinion that product made
available to them are of fair quality but does not comes in category of good and excellent. Hence,
it can be said that firm needs to bring improvement in is stationary products. Median and mode
both values are 2 which is reflecting same fact. On this basis, it can be said that almost all
respondents or majority of them are giving same response. This can not be considered good for
the firm in any way and it need to make its product of high quality with some innovative
features.
TASK 8
Conclusion and recomendation
On basis of analysis of facts it is clear that people are satisfied from firm services but
think that its product quality is not so good. Products are available at high price in comparison to
quality that is offered in them. Business firm needs to ensure that it is only offering quality
staionary products in its business to customers. By doing so customers can not only be retained
in the business but new one can also be created. Facts also revealed that there is huge
competition in the market and due to this reason either firm can make available excellent quality
stationary items or it can sale them at low price. It is not possible to reduce product price and due
to this reason it will be better to offer best quality of product to the customers.
7 | P a g e
Paraphrase This Document
Need a fresh take? Get an instant paraphrase of this document with our AI Paraphraser
REFERENCE
Books and Journals
Musiolik, J. and Markard, J., 2011. Creating and shaping innovation systems: Formal networks
in the innovation system for stationary fuel cells in Germany. Energy Policy. 39(4). pp.1909-
1922.
Weyerstrass, K., Van Aarle, B., Kappler, M. and Seymen, A., 2011. Business cycle
synchronisation with (in) the Euro Area: in search of a ‘Euro Effect’. open economies
review. 22(3). pp.427-446.
Sayed-Mouchaweh, M. and Lughofer, E. eds., 2012. Learning in non-stationary environments:
methods and applications. Springer Science & Business Media.
Online
How much is spend per student, 2014. [PDF]. Available through:<
https://www.oecd.org/edu/EAG2014-Indicator%20B1%20(eng).pdf>.
8 | P a g e
1 out of 11
Related Documents


Your All-in-One AI-Powered Toolkit for Academic Success.
+13062052269
info@desklib.com
Available 24*7 on WhatsApp / Email
![[object Object]](/_next/static/media/star-bottom.7253800d.svg)
Unlock your academic potential
Copyright © 2020–2026 A2Z Services. All Rights Reserved. Developed and managed by ZUCOL.