Business Analytics HARVEST KITCHEN 12 HARVEST KITCHEN
Added on 2020-03-16
14 Pages2948 Words82 Views
Running head: HARVEST KITCHEN
Business Analytics – Harvest Kitchen
Name
Course Number
Date
Faculty Name
Business Analytics – Harvest Kitchen
Name
Course Number
Date
Faculty Name
Running head: HARVEST KITCHEN
Table of Contents
1. Introduction........................................................................................................................ 3
2. Problem Statement............................................................................................................... 3
Research Questions................................................................................................................. 4
3. Descriptive Analysis............................................................................................................. 4
4. Results.............................................................................................................................. 7
4.1 Top/worst selling products............................................................................................... 7
4.2 Payment methods.......................................................................................................... 9
4.3 Sales performance by location........................................................................................... 9
4.4 Sales and gross profits by months.................................................................................... 10
4.5 Sales performance by season.......................................................................................... 11
4.6 Correlation between rainfall and profits.............................................................................11
4.7 Days of the week and total orders..................................................................................... 12
4.8 Chi-Square test: Association between product class and location on the shop...............................12
5. Discussions and Recommendations......................................................................................... 14
References............................................................................................................................. 14
BUSINESS ANALYSIS HARVEST KITCHEN 3
Business Analytics – Harvest Kitchen
1. Introduction
Good harvest investments is an agribusiness organization which grows organic food and offers
delivery of their products’ package to their customers. They are determined in making a better
community by producing and delivering quality products. The agricultural production process is
determined by various factors, hence the need for time, money, water among other resources. Some
natural resources such as rainfall may inconvenience the production process. Therefore, artificial sources
of such resources should be developed to ensure that the agricultural activities continue effectively
throughout the year regardless of the climatic conditions. In some cases, structures such as greenhouses
might be required to elevate the production levels for the plants. All these forms of dedication are
focused on improved production amounts to maximize the available resources. From a business
perspective, the investors should minimize the agricultural inputs and produce maximum outputs. Good
harvest has compiled all these resources for efficient and effective production and supply of their
products (GoodHarvest, 2017).
Despite the production process, it is also important for agribusiness investors to learn the likes and
preference of their customers. Achieving this business principle, they will be able to produce their
products proportionally based on their demands. In cases of underselling products, it is the responsibility
of the investors to inform their potential and existing customers of the existing products and their
benefits (Agrawal & Anil, 2009). For instance, vegetables are very important for their sufficiency in
vitamins, which nourish the body. Enabling the customers to learn how vitamins are important for
improving body’s immunity will improve the products demand hence boosting their sales. Therefore,
performing blinded business might affect the sales and demands negatively. Business indicators are also
important to avoid investing in products that are not selling well in the market. This paper will focus on
answering the hypothetical business question to develop inferences about sales performances and profits
(Dlamini, Kirsten & Masuku, 2014).
2. Problem Statement
Good harvest needs to understand the best and the worst selling products on their investments. This
will help them focus on the best performing specializations. Profit levels assist the investors to quantify
the level of success achieved. Customer shopping behaviours also affect levels of product sales based on
BUSINESS ANALYSIS HARVEST KITCHEN 4
their location in the shop. Some of the customers prefer to shop on the products that are closer to the exit
because they're not interested in walking around the outlet. In addition, products that are located in the
visible area are likely to be bought because of the concept that a customer will see, like and make a
purchase. Therefore, a business needs to understand the relationship between the location of a product
on the shop and their respective sales. Based on purchasing behaviours, it is assumed that time is a
determining factor, hence the need to understand what time of the year the sales are high or low in
consideration with product type to make effective investment plans (Dlamini, Kirsten & Masuku,
2014).
Research Questions
i. What is the top/worst selling products in terms of sales?
ii. Is there a difference in payment methods?
iii. Are there differences in sales performance based on the location of products in the shop?
How are the profits and revenue affected?
iv. Is there a difference in sales and gross profits between months of the year?
v. Is the difference in sales performance between different seasons?
vi. What is a relationship between rainfall and profits?
vii. Is there any relationship between days of the week and total orders?
viii. Is there any difference between product sales and net profit?
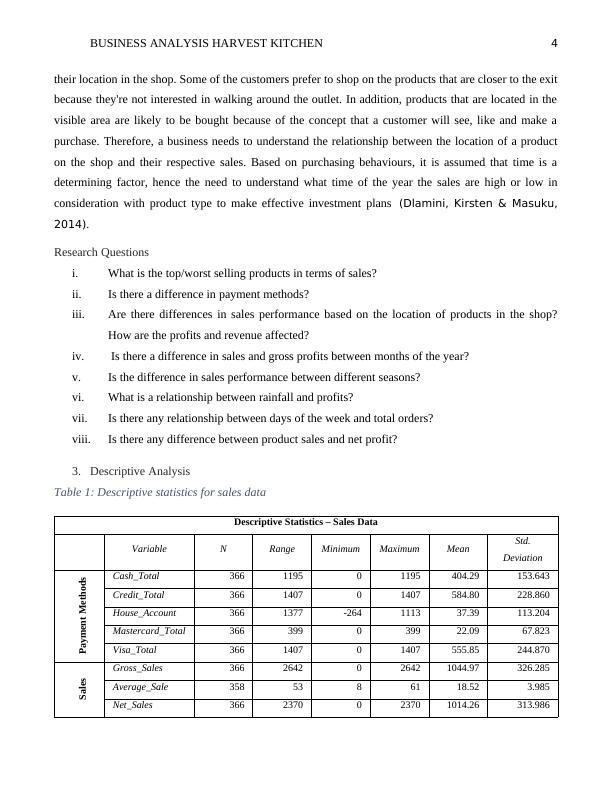
3. Descriptive Analysis
Table 1: Descriptive statistics for sales data
Descriptive Statistics – Sales Data
Variable N Range Minimum Maximum Mean Std.
Deviation
Payment Methods Cash_Total 366 1195 0 1195 404.29 153.643
Credit_Total 366 1407 0 1407 584.80 228.860
House_Account 366 1377 -264 1113 37.39 113.204
Mastercard_Total 366 399 0 399 22.09 67.823
Visa_Total 366 1407 0 1407 555.85 244.870
Sales Gross_Sales 366 2642 0 2642 1044.97 326.285
Average_Sale 358 53 8 61 18.52 3.985
Net_Sales 366 2370 0 2370 1014.26 313.986
their location in the shop. Some of the customers prefer to shop on the products that are closer to the exit
because they're not interested in walking around the outlet. In addition, products that are located in the
visible area are likely to be bought because of the concept that a customer will see, like and make a
purchase. Therefore, a business needs to understand the relationship between the location of a product
on the shop and their respective sales. Based on purchasing behaviours, it is assumed that time is a
determining factor, hence the need to understand what time of the year the sales are high or low in
consideration with product type to make effective investment plans (Dlamini, Kirsten & Masuku,
2014).
Research Questions
i. What is the top/worst selling products in terms of sales?
ii. Is there a difference in payment methods?
iii. Are there differences in sales performance based on the location of products in the shop?
How are the profits and revenue affected?
iv. Is there a difference in sales and gross profits between months of the year?
v. Is the difference in sales performance between different seasons?
vi. What is a relationship between rainfall and profits?
vii. Is there any relationship between days of the week and total orders?
viii. Is there any difference between product sales and net profit?
3. Descriptive Analysis
Table 1: Descriptive statistics for sales data
Descriptive Statistics – Sales Data
Variable N Range Minimum Maximum Mean Std.
Deviation
Payment Methods Cash_Total 366 1195 0 1195 404.29 153.643
Credit_Total 366 1407 0 1407 584.80 228.860
House_Account 366 1377 -264 1113 37.39 113.204
Mastercard_Total 366 399 0 399 22.09 67.823
Visa_Total 366 1407 0 1407 555.85 244.870
Sales Gross_Sales 366 2642 0 2642 1044.97 326.285
Average_Sale 358 53 8 61 18.52 3.985
Net_Sales 366 2370 0 2370 1014.26 313.986
End of preview
Want to access all the pages? Upload your documents or become a member.
Related Documents
Report | Harvest Kitchen Shop and Managementlg...
|11
|1806
|56
Research Report on Good Harvest Food Shoplg...
|12
|2264
|103
Harvest Kitchen Shop Reportlg...
|12
|1822
|58
The Harvest Kitchen Shoplg...
|12
|2245
|146
Report on Harvest Kitchen Shop and Managementlg...
|13
|2194
|270
Business Report Assignment - Doclg...
|17
|3075
|35