Business Analysis of Tesco
VerifiedAdded on 2021/02/20
|36
|5275
|26
AI Summary
Contribute Materials
Your contribution can guide someone’s learning journey. Share your
documents today.
BUSINESS ANALYSIS
Secure Best Marks with AI Grader
Need help grading? Try our AI Grader for instant feedback on your assignments.
TABLE OF CONTENTS
1. INTRODUCTION.......................................................................................................................1
1.1 Objectives of the study..........................................................................................................1
1.2 Overview of 3 organisations.................................................................................................1
1.3 Rationale for choosing Tesco................................................................................................2
1.4 Current key issues.................................................................................................................3
2. STRATEGIC ANALYSIS...........................................................................................................5
2.1 Macro environmental analysis – PESTLE............................................................................5
2.2 Micro environmental analysis – Porter’s 5 forces.................................................................7
3.0 Financial analysis and benchmarking........................................................................................8
3.1 Profitability ratios.................................................................................................................9
3.2 Liquidity..............................................................................................................................10
3.3 Shareholders ratios..............................................................................................................12
3.4.1 Market share analysis.......................................................................................................13
3.4.2 Line capacity....................................................................................................................13
4.0 LIMITATIONS OF STRATEGIC ANALYSIS......................................................................14
4.1 PESTLE..............................................................................................................................14
4.2 Porter’s 5 forces..................................................................................................................15
4.3 Financial analysis................................................................................................................15
5. CONCLUSION..........................................................................................................................16
6. RECOMMENDATIONS...........................................................................................................17
6.1 Potential strategy direction..................................................................................................17
7.0 STRATEGY EVALUATION..................................................................................................19
7.1 Suitability............................................................................................................................19
7.2 Acceptability.......................................................................................................................20
7.3 Feasibility............................................................................................................................20
8.0 FINANCIAL DATA MODELLING.......................................................................................20
8.1 Past trend.............................................................................................................................20
8.2 Assumptions........................................................................................................................21
8.3 Future trend.........................................................................................................................21
8.4 Future trend analysis...........................................................................................................22
REFERENCES..............................................................................................................................26
APPENDICES...............................................................................................................................27
Appendix 1: Ratio analysis.......................................................................................................27
Appendix 2: Line chart.............................................................................................................29
Appendix 3: Trend analysis......................................................................................................30
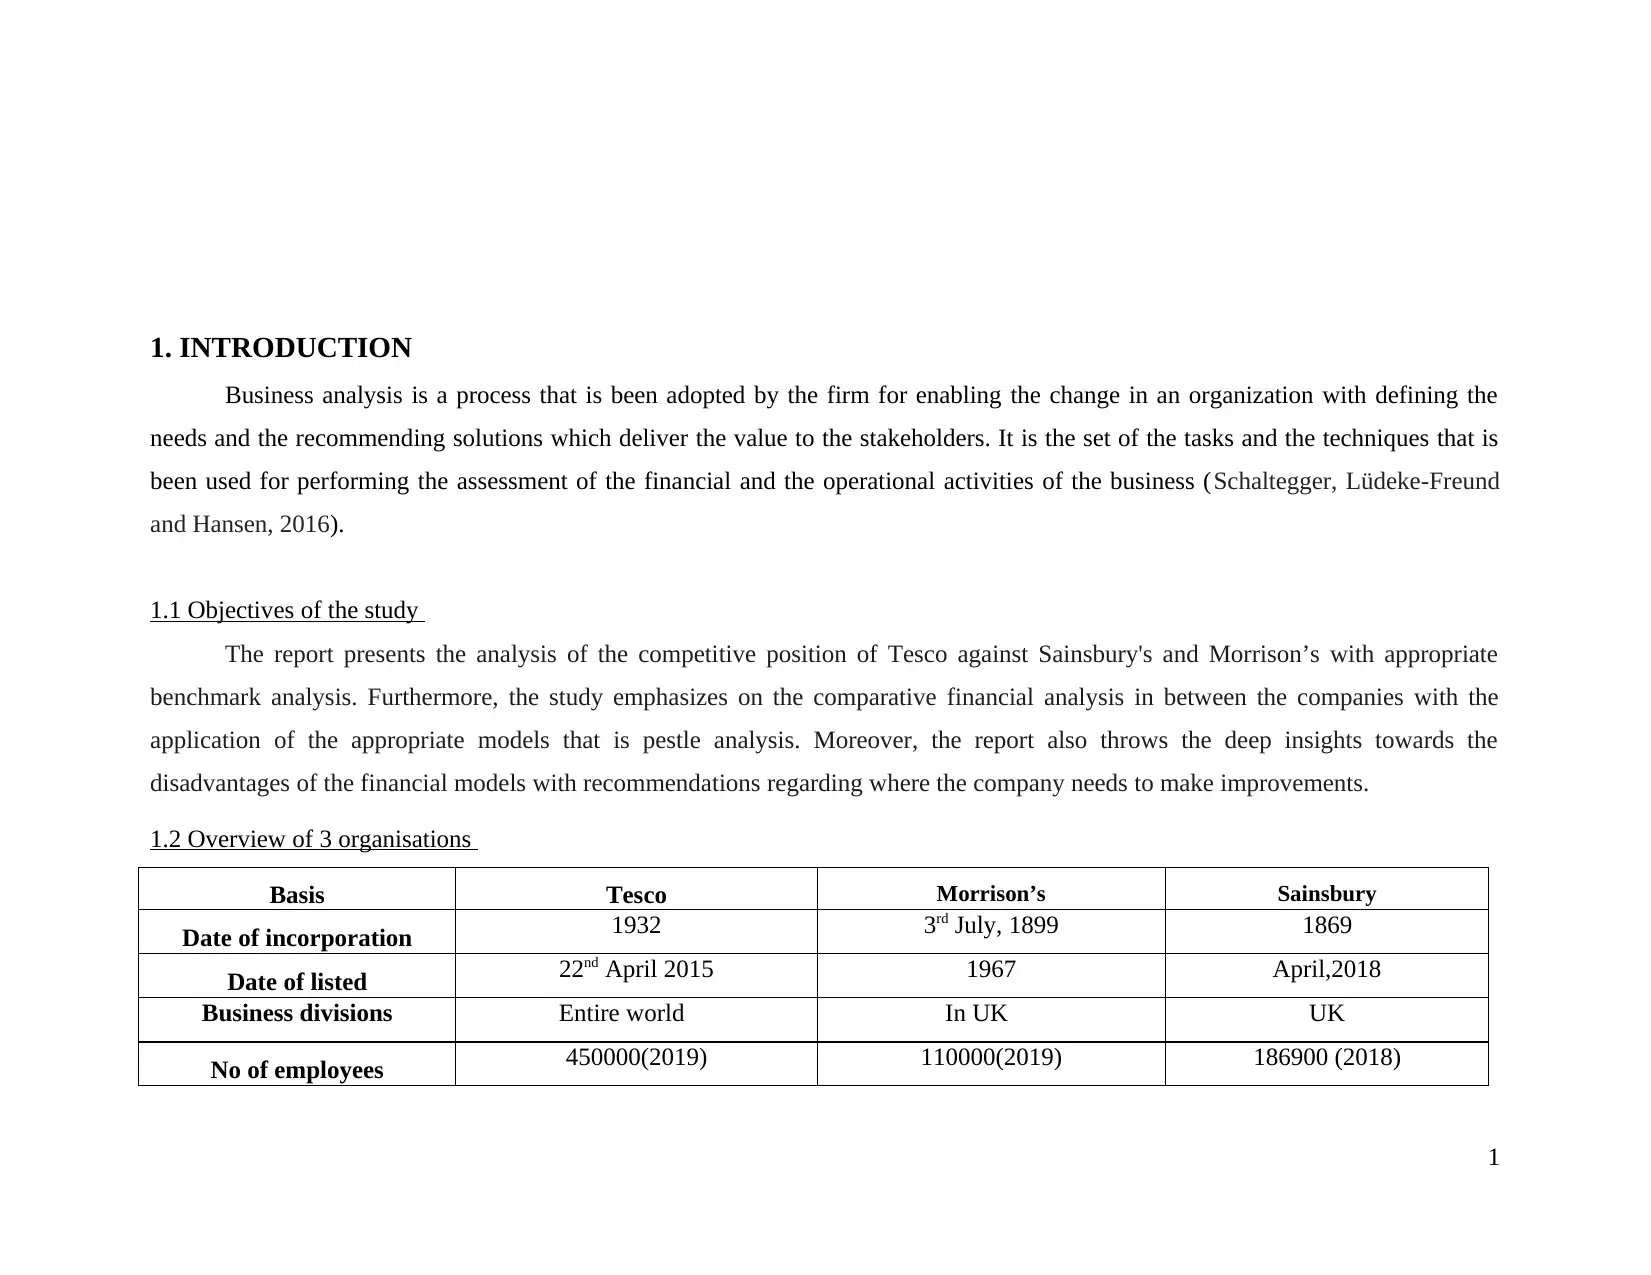
1. INTRODUCTION
Business analysis is a process that is been adopted by the firm for enabling the change in an organization with defining the
needs and the recommending solutions which deliver the value to the stakeholders. It is the set of the tasks and the techniques that is
been used for performing the assessment of the financial and the operational activities of the business (Schaltegger, Lüdeke-Freund
and Hansen, 2016).
1.1 Objectives of the study
The report presents the analysis of the competitive position of Tesco against Sainsbury's and Morrison’s with appropriate
benchmark analysis. Furthermore, the study emphasizes on the comparative financial analysis in between the companies with the
application of the appropriate models that is pestle analysis. Moreover, the report also throws the deep insights towards the
disadvantages of the financial models with recommendations regarding where the company needs to make improvements.
1.2 Overview of 3 organisations
Basis Tesco Morrison’s Sainsbury
Date of incorporation 1932 3rd July, 1899 1869
Date of listed 22nd April 2015 1967 April,2018
Business divisions Entire world In UK UK
No of employees 450000(2019) 110000(2019) 186900 (2018)
1
Secure Best Marks with AI Grader
Need help grading? Try our AI Grader for instant feedback on your assignments.
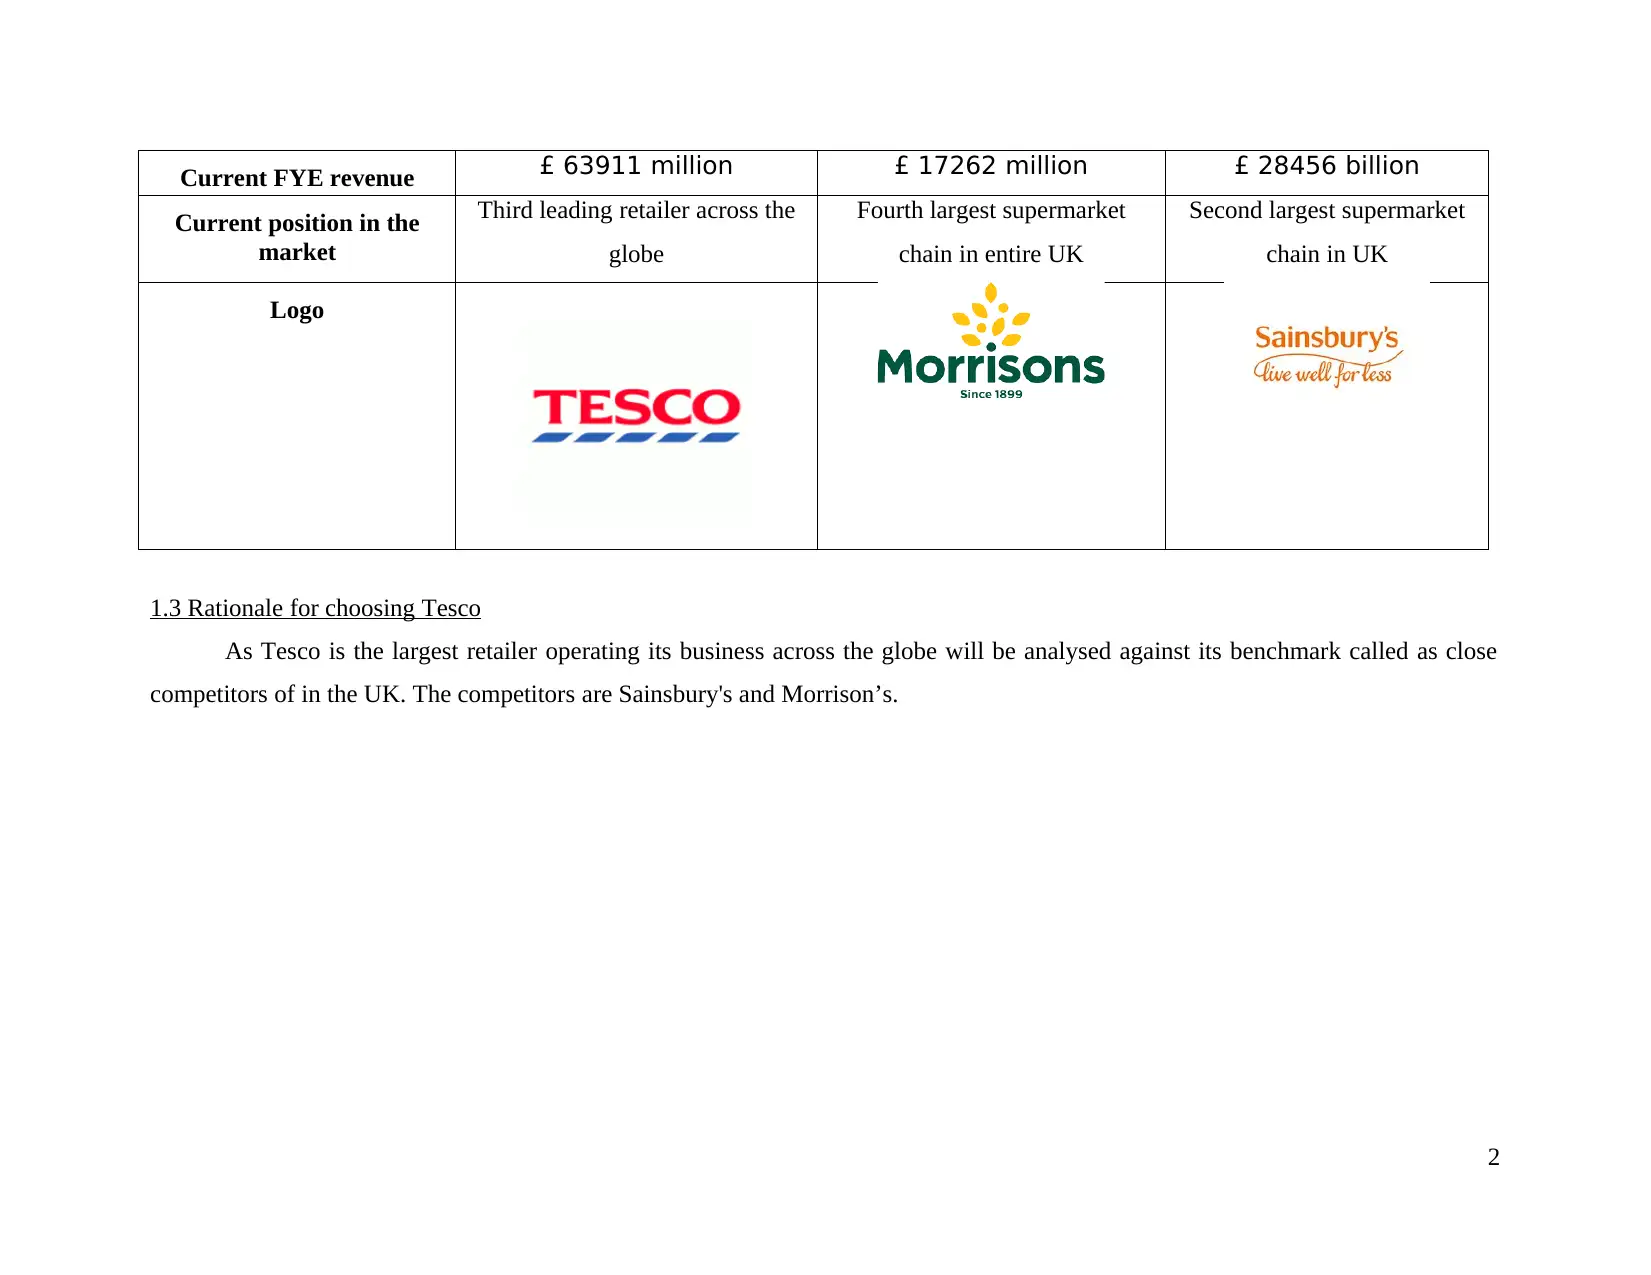
Current FYE revenue £ 63911 million £ 17262 million £ 28456 billion
Current position in the
market
Third leading retailer across the
globe
Fourth largest supermarket
chain in entire UK
Second largest supermarket
chain in UK
Logo
1.3 Rationale for choosing Tesco
As Tesco is the largest retailer operating its business across the globe will be analysed against its benchmark called as close
competitors of in the UK. The competitors are Sainsbury's and Morrison’s.
2
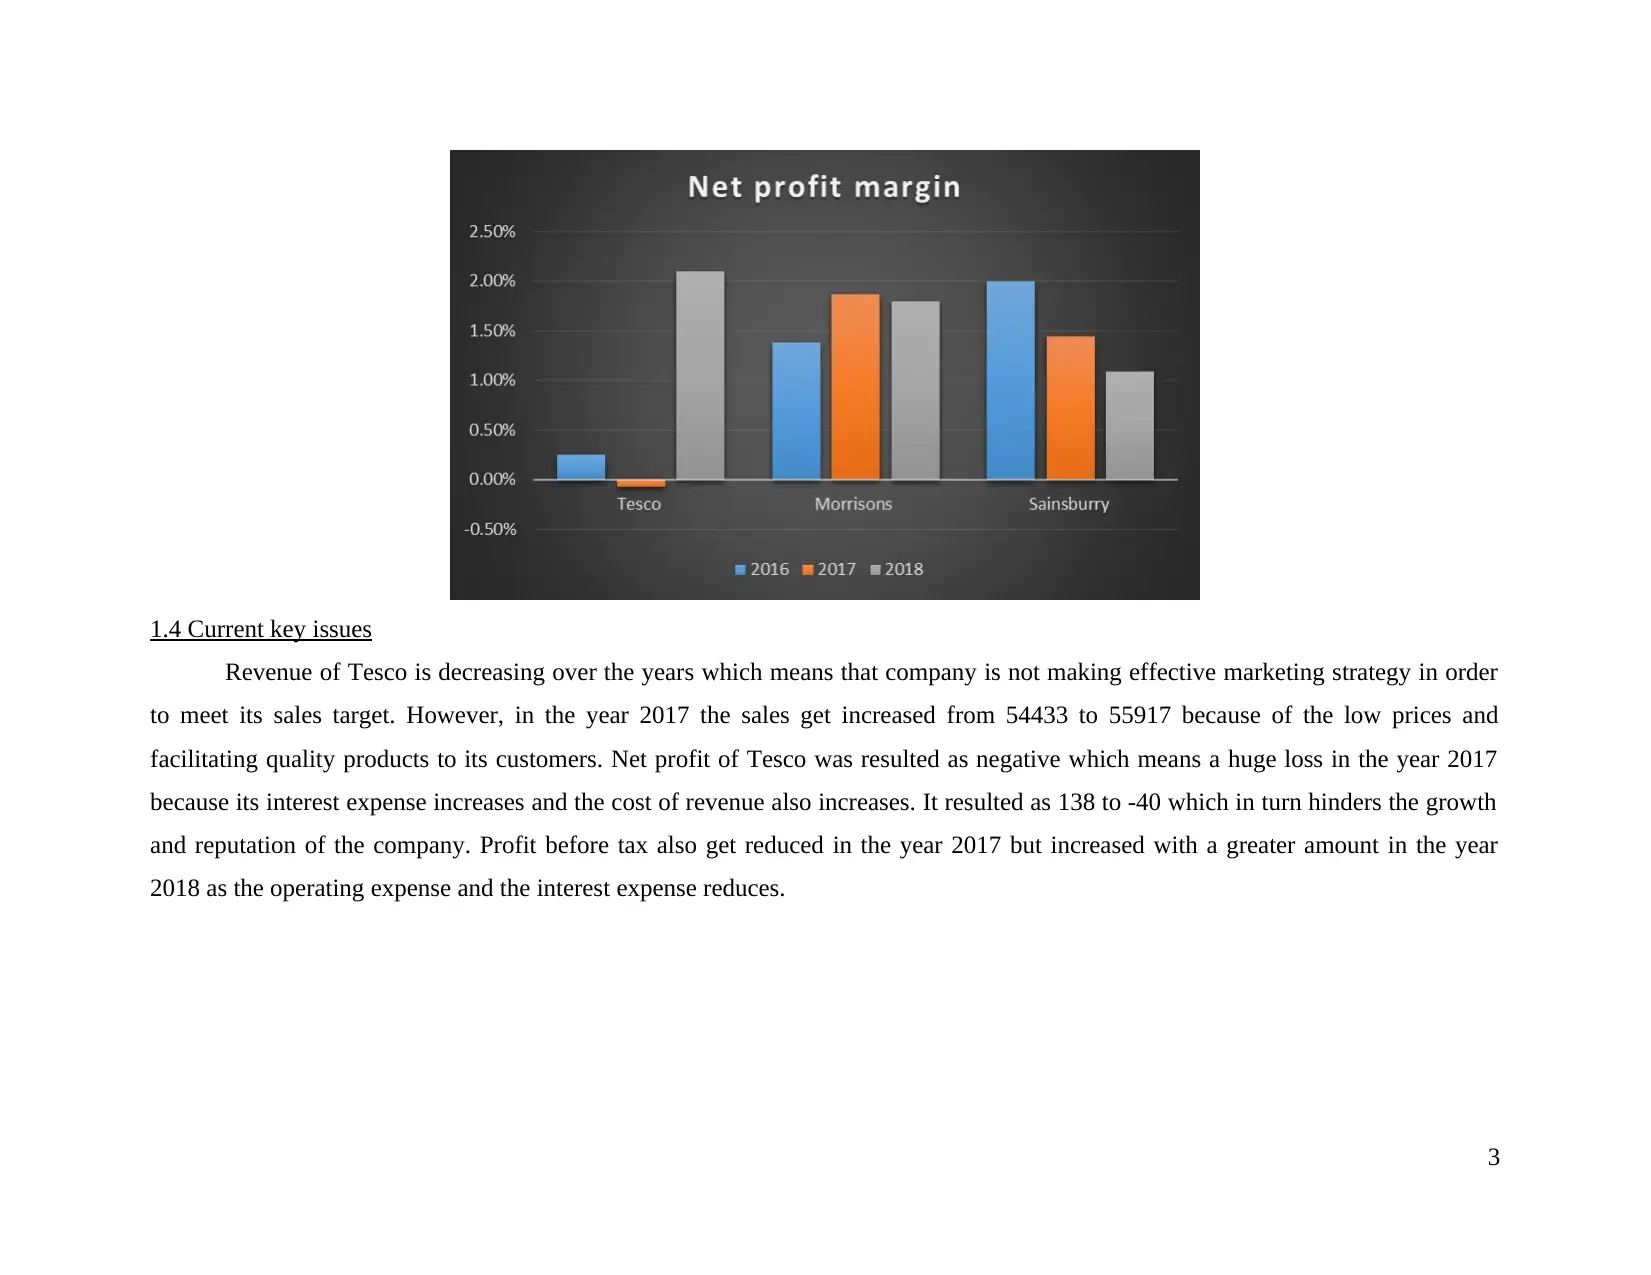
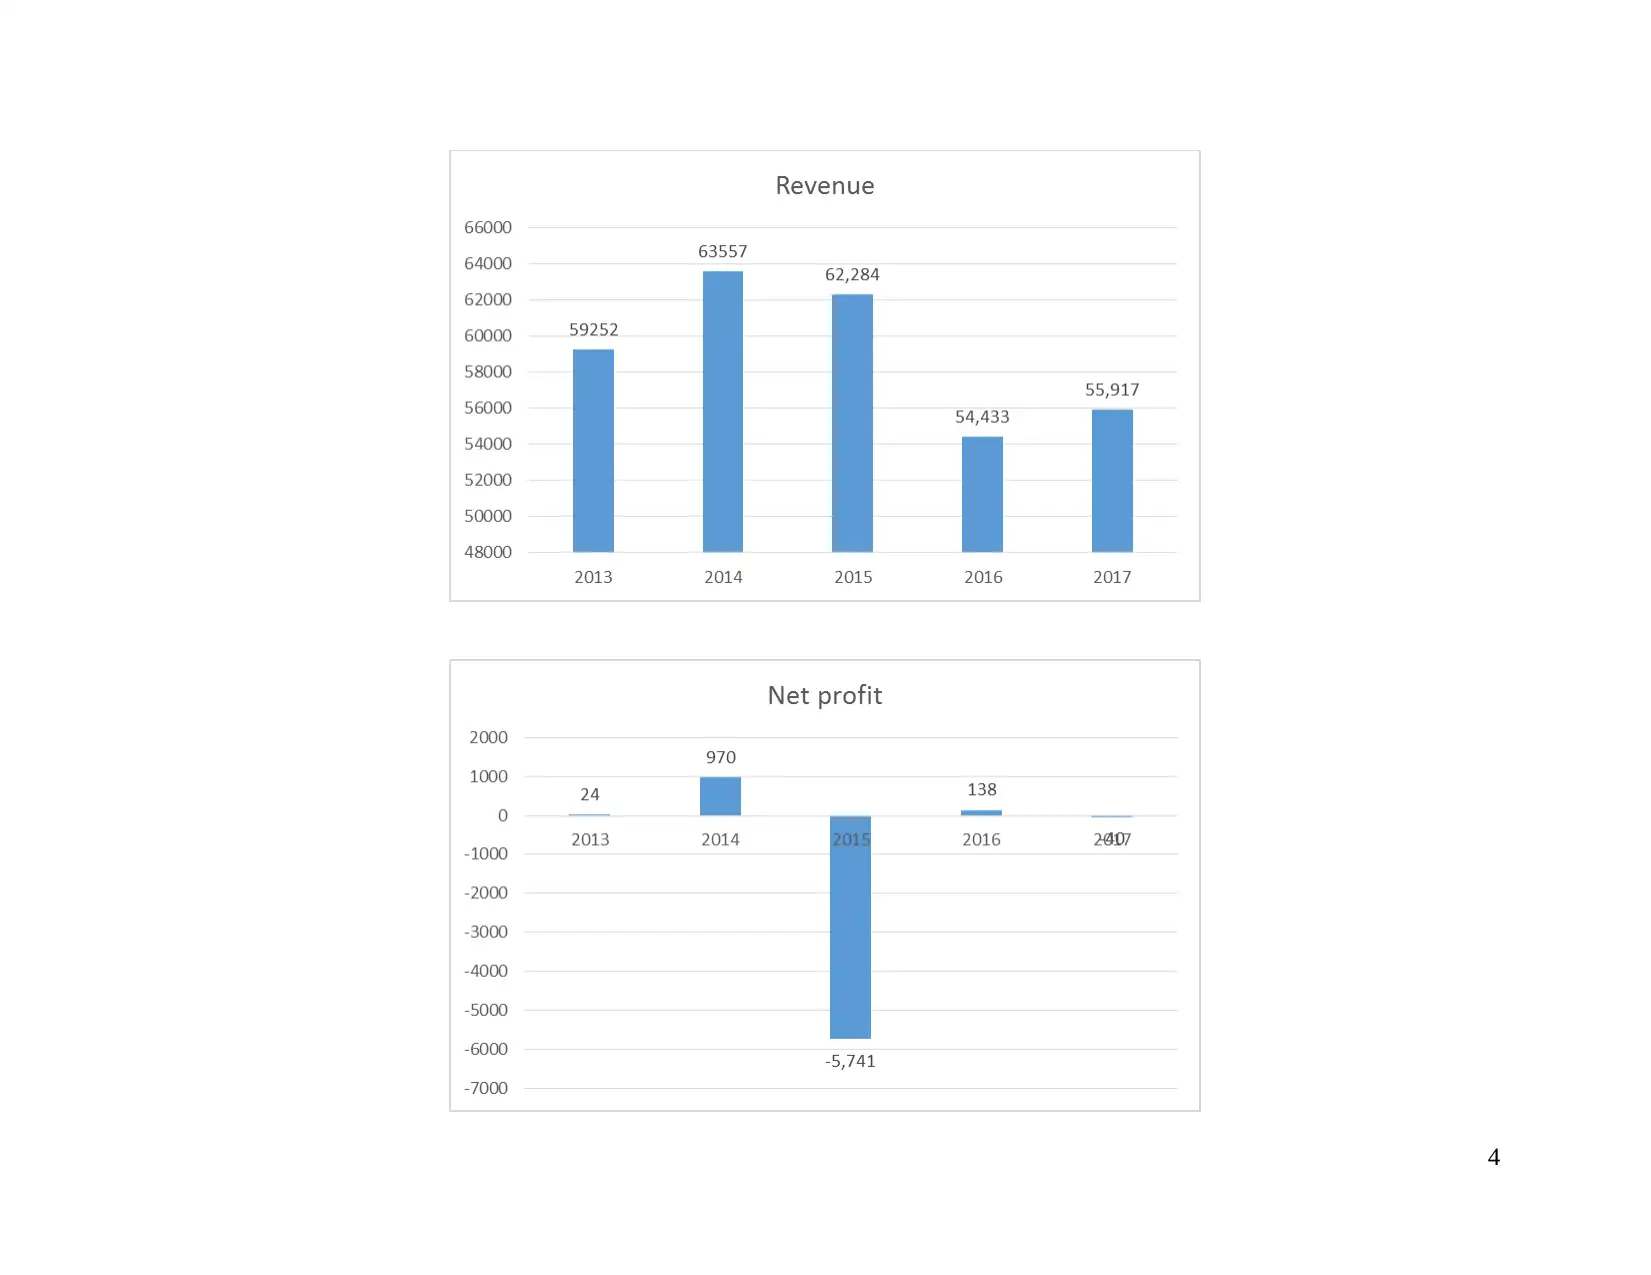
1.4 Current key issues
Revenue of Tesco is decreasing over the years which means that company is not making effective marketing strategy in order
to meet its sales target. However, in the year 2017 the sales get increased from 54433 to 55917 because of the low prices and
facilitating quality products to its customers. Net profit of Tesco was resulted as negative which means a huge loss in the year 2017
because its interest expense increases and the cost of revenue also increases. It resulted as 138 to -40 which in turn hinders the growth
and reputation of the company. Profit before tax also get reduced in the year 2017 but increased with a greater amount in the year
2018 as the operating expense and the interest expense reduces.
3
4
Paraphrase This Document
Need a fresh take? Get an instant paraphrase of this document with our AI Paraphraser
2. STRATEGIC ANALYSIS
2.1 Macro environmental analysis – PESTLE
Pestle analysis of Tesco
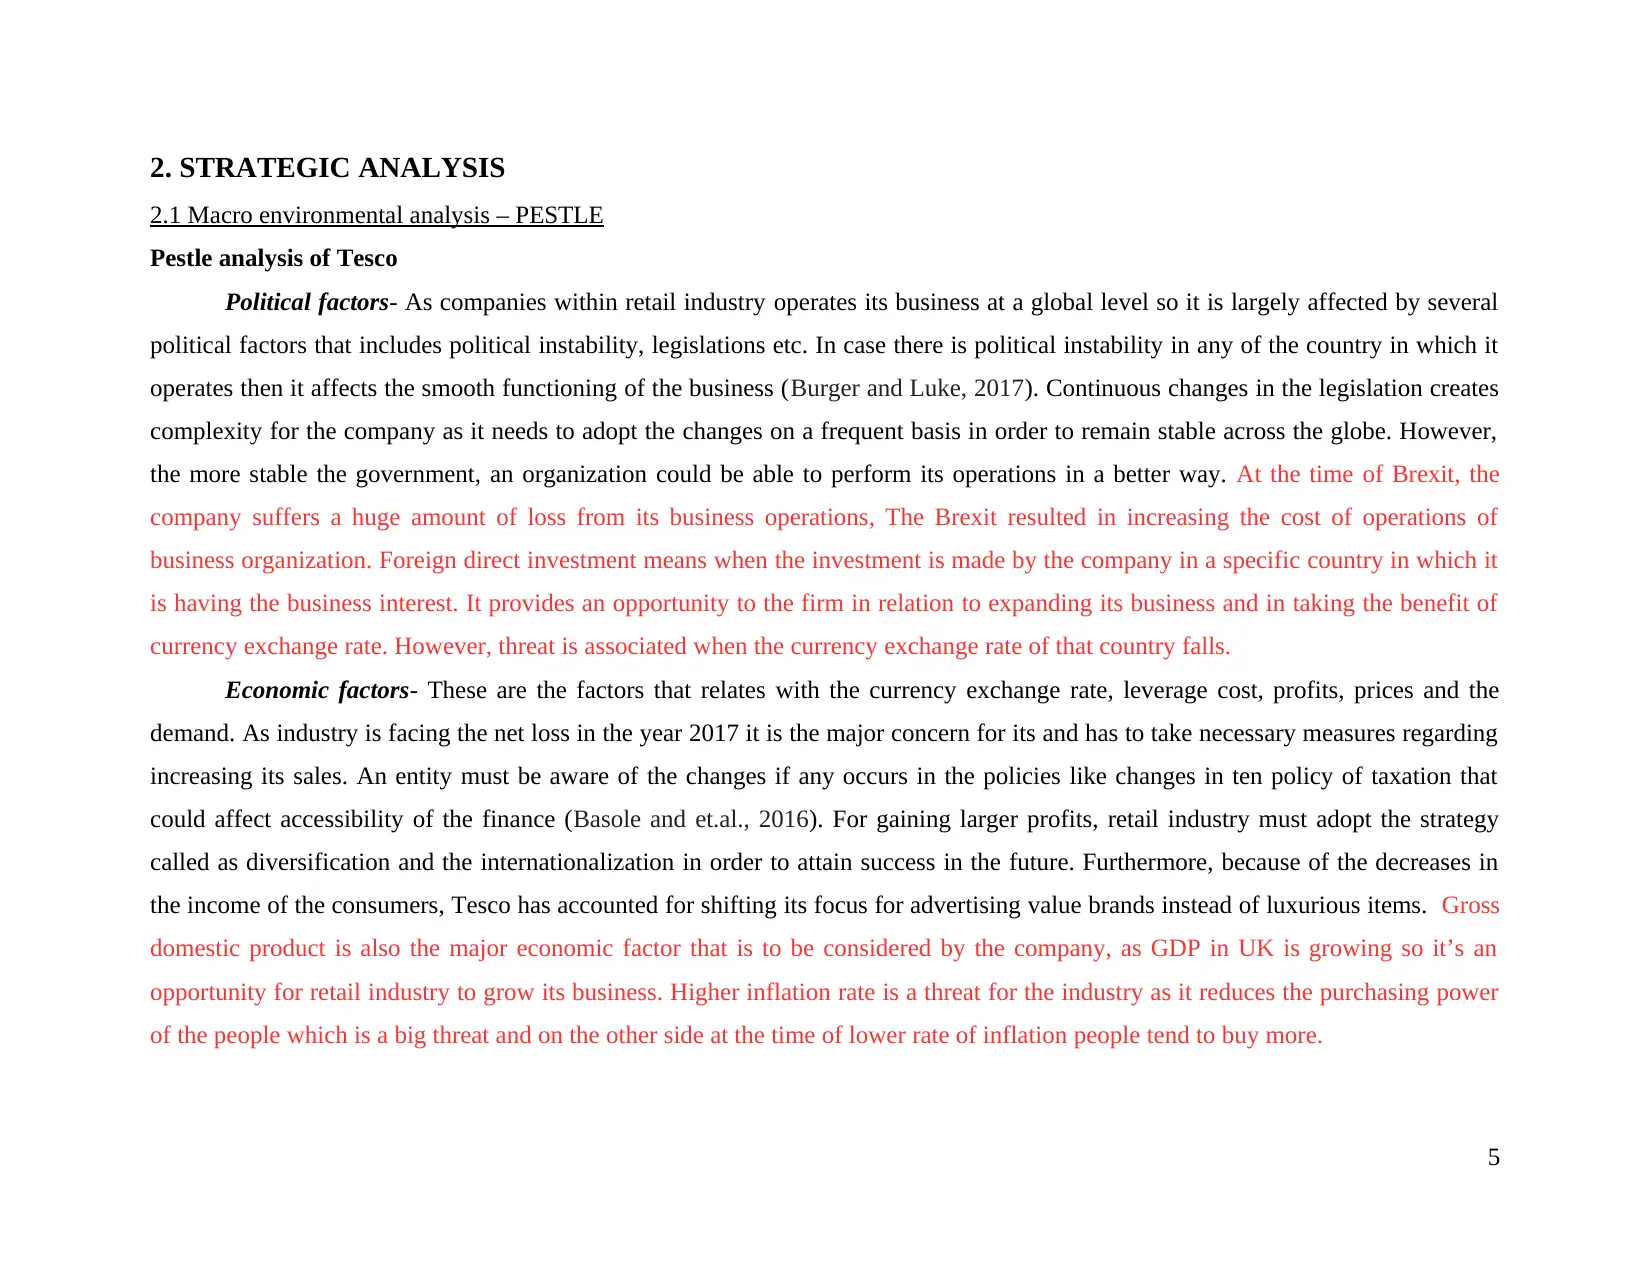
Political factors- As companies within retail industry operates its business at a global level so it is largely affected by several
political factors that includes political instability, legislations etc. In case there is political instability in any of the country in which it
operates then it affects the smooth functioning of the business (Burger and Luke, 2017). Continuous changes in the legislation creates
complexity for the company as it needs to adopt the changes on a frequent basis in order to remain stable across the globe. However,
the more stable the government, an organization could be able to perform its operations in a better way. At the time of Brexit, the
company suffers a huge amount of loss from its business operations, The Brexit resulted in increasing the cost of operations of
business organization. Foreign direct investment means when the investment is made by the company in a specific country in which it
is having the business interest. It provides an opportunity to the firm in relation to expanding its business and in taking the benefit of
currency exchange rate. However, threat is associated when the currency exchange rate of that country falls.
Economic factors- These are the factors that relates with the currency exchange rate, leverage cost, profits, prices and the
demand. As industry is facing the net loss in the year 2017 it is the major concern for its and has to take necessary measures regarding
increasing its sales. An entity must be aware of the changes if any occurs in the policies like changes in ten policy of taxation that
could affect accessibility of the finance (Basole and et.al., 2016). For gaining larger profits, retail industry must adopt the strategy
called as diversification and the internationalization in order to attain success in the future. Furthermore, because of the decreases in
the income of the consumers, Tesco has accounted for shifting its focus for advertising value brands instead of luxurious items. Gross
domestic product is also the major economic factor that is to be considered by the company, as GDP in UK is growing so it’s an
opportunity for retail industry to grow its business. Higher inflation rate is a threat for the industry as it reduces the purchasing power
of the people which is a big threat and on the other side at the time of lower rate of inflation people tend to buy more.
5
2.1 Macro environmental analysis – PESTLE
Pestle analysis of Tesco
Political factors- As companies within retail industry operates its business at a global level so it is largely affected by several
political factors that includes political instability, legislations etc. In case there is political instability in any of the country in which it
operates then it affects the smooth functioning of the business (Burger and Luke, 2017). Continuous changes in the legislation creates
complexity for the company as it needs to adopt the changes on a frequent basis in order to remain stable across the globe. However,
the more stable the government, an organization could be able to perform its operations in a better way. At the time of Brexit, the
company suffers a huge amount of loss from its business operations, The Brexit resulted in increasing the cost of operations of
business organization. Foreign direct investment means when the investment is made by the company in a specific country in which it
is having the business interest. It provides an opportunity to the firm in relation to expanding its business and in taking the benefit of
currency exchange rate. However, threat is associated when the currency exchange rate of that country falls.
Economic factors- These are the factors that relates with the currency exchange rate, leverage cost, profits, prices and the
demand. As industry is facing the net loss in the year 2017 it is the major concern for its and has to take necessary measures regarding
increasing its sales. An entity must be aware of the changes if any occurs in the policies like changes in ten policy of taxation that
could affect accessibility of the finance (Basole and et.al., 2016). For gaining larger profits, retail industry must adopt the strategy
called as diversification and the internationalization in order to attain success in the future. Furthermore, because of the decreases in
the income of the consumers, Tesco has accounted for shifting its focus for advertising value brands instead of luxurious items. Gross
domestic product is also the major economic factor that is to be considered by the company, as GDP in UK is growing so it’s an
opportunity for retail industry to grow its business. Higher inflation rate is a threat for the industry as it reduces the purchasing power
of the people which is a big threat and on the other side at the time of lower rate of inflation people tend to buy more.
5
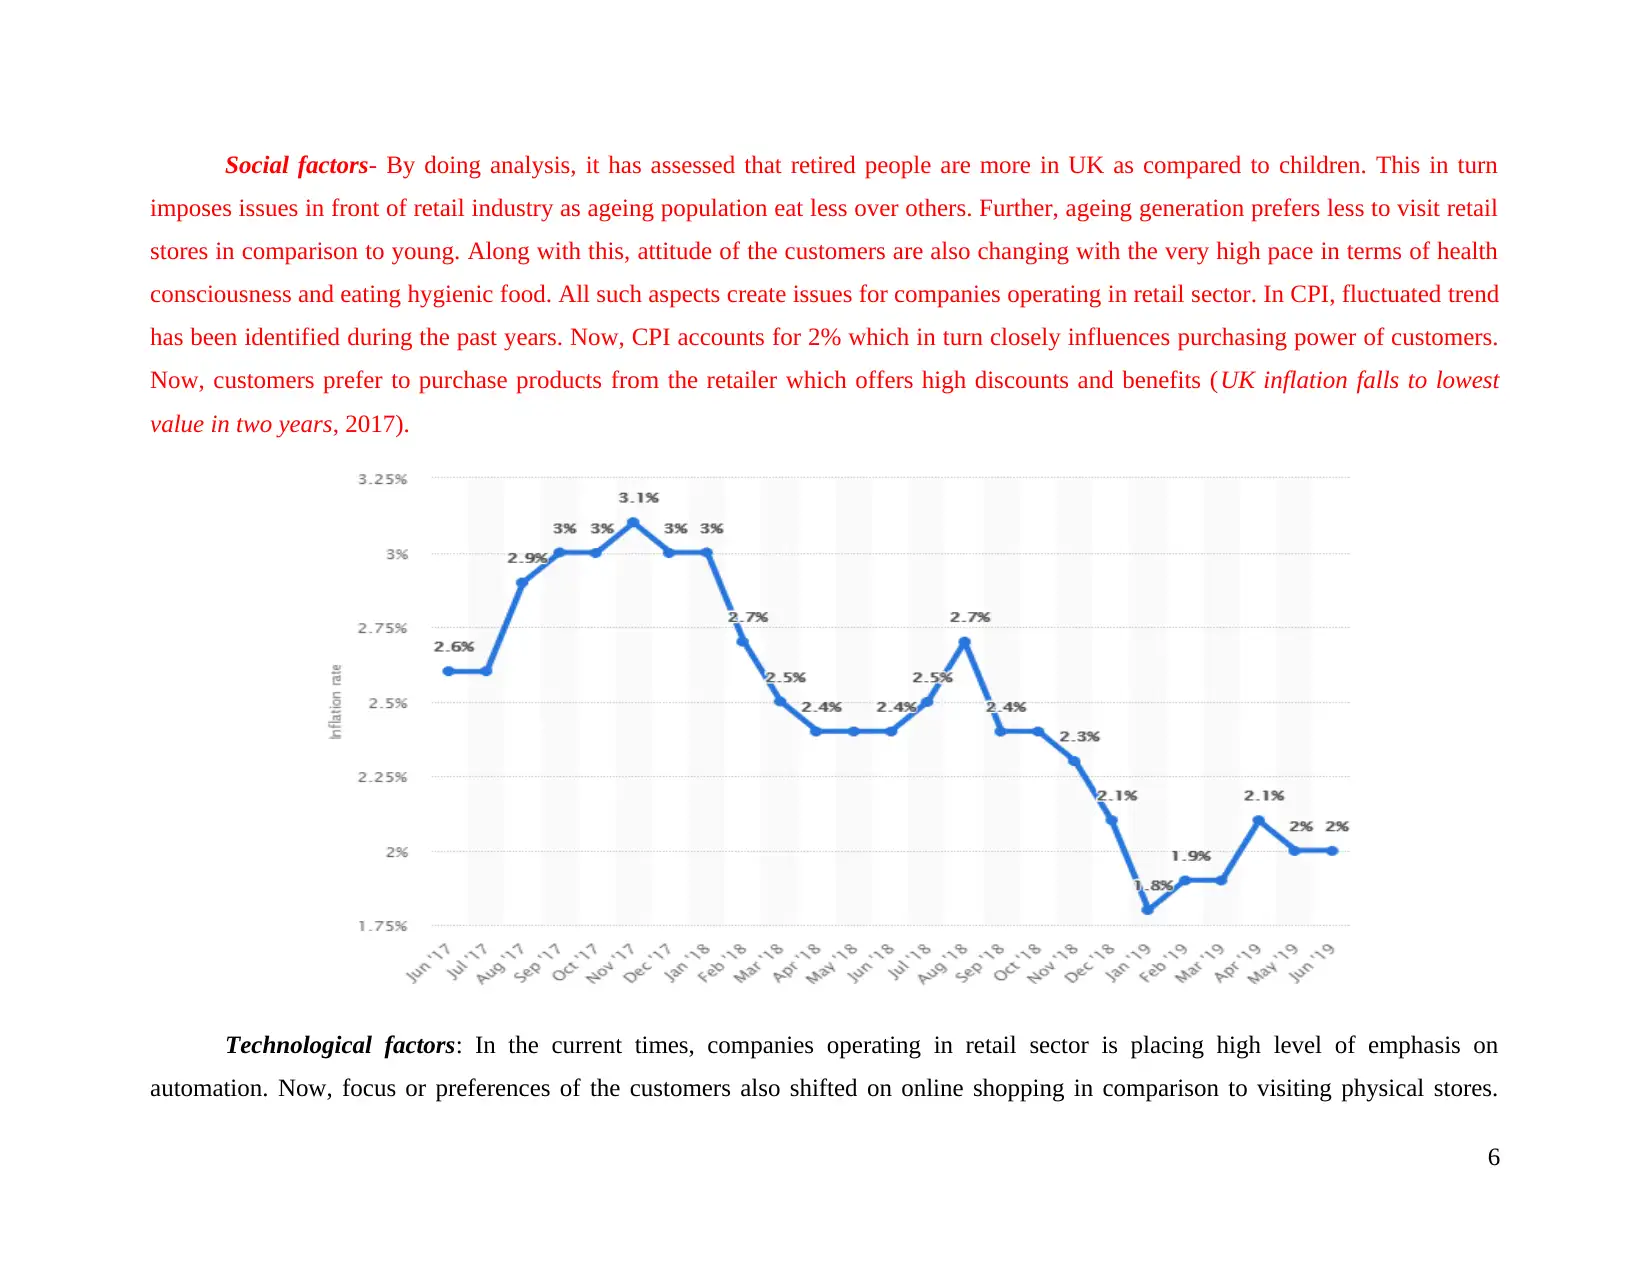
Social factors- By doing analysis, it has assessed that retired people are more in UK as compared to children. This in turn
imposes issues in front of retail industry as ageing population eat less over others. Further, ageing generation prefers less to visit retail
stores in comparison to young. Along with this, attitude of the customers are also changing with the very high pace in terms of health
consciousness and eating hygienic food. All such aspects create issues for companies operating in retail sector. In CPI, fluctuated trend
has been identified during the past years. Now, CPI accounts for 2% which in turn closely influences purchasing power of customers.
Now, customers prefer to purchase products from the retailer which offers high discounts and benefits (UK inflation falls to lowest
value in two years, 2017).
Technological factors: In the current times, companies operating in retail sector is placing high level of emphasis on
automation. Now, focus or preferences of the customers also shifted on online shopping in comparison to visiting physical stores.
6
Through this, it had developed it business on online platforms by facilitating its customers with online shopping. It has also created the
self-service points for checkout that has provided convenience and the ease for the customers which in turn also helped the
organization in reducing its labour cost (Melloni, Stacchezzini and Lai, 2016). Moreover, an enterprise has also made the investment
in the projects that are energy efficient in order to fulfil the long run objective for the purpose of reducing the carbon footprint. Along
with this, for a gaining competitive edge over others business units require to make focus on the adoption of profitable as well as
advanced technologies namely robots, artificial intelligence and drones.
Legal factors- In UK, firms is retail sector must comply with codes of ethics or practices introduced by Food Retailing
Commission. Further, business units also need to adhere with rules and regulations regarding health and safety, equality and
sustainability laws (Burger and Luke, 2017). All the firms need to follow these regulations for getting the desired level of outcome or
success.
Environmental factors- As with increase of the pressure on the organization relating to addressing the environmental issues or
to adopt different ways for operations that in turn benefits the society. The industry is also moving towards minimizing wastage that
has been produced in the stores with increasing the social conscience within the customers. As the company also deals in range of
foods so it has to take utmost care because in the winter season the food might become soggy which in turn results in a huge loss to
the company as their food range products gets detained and remains of no use. Recycling and disposal of wastage influences the
industry to operate its business with sustainability.
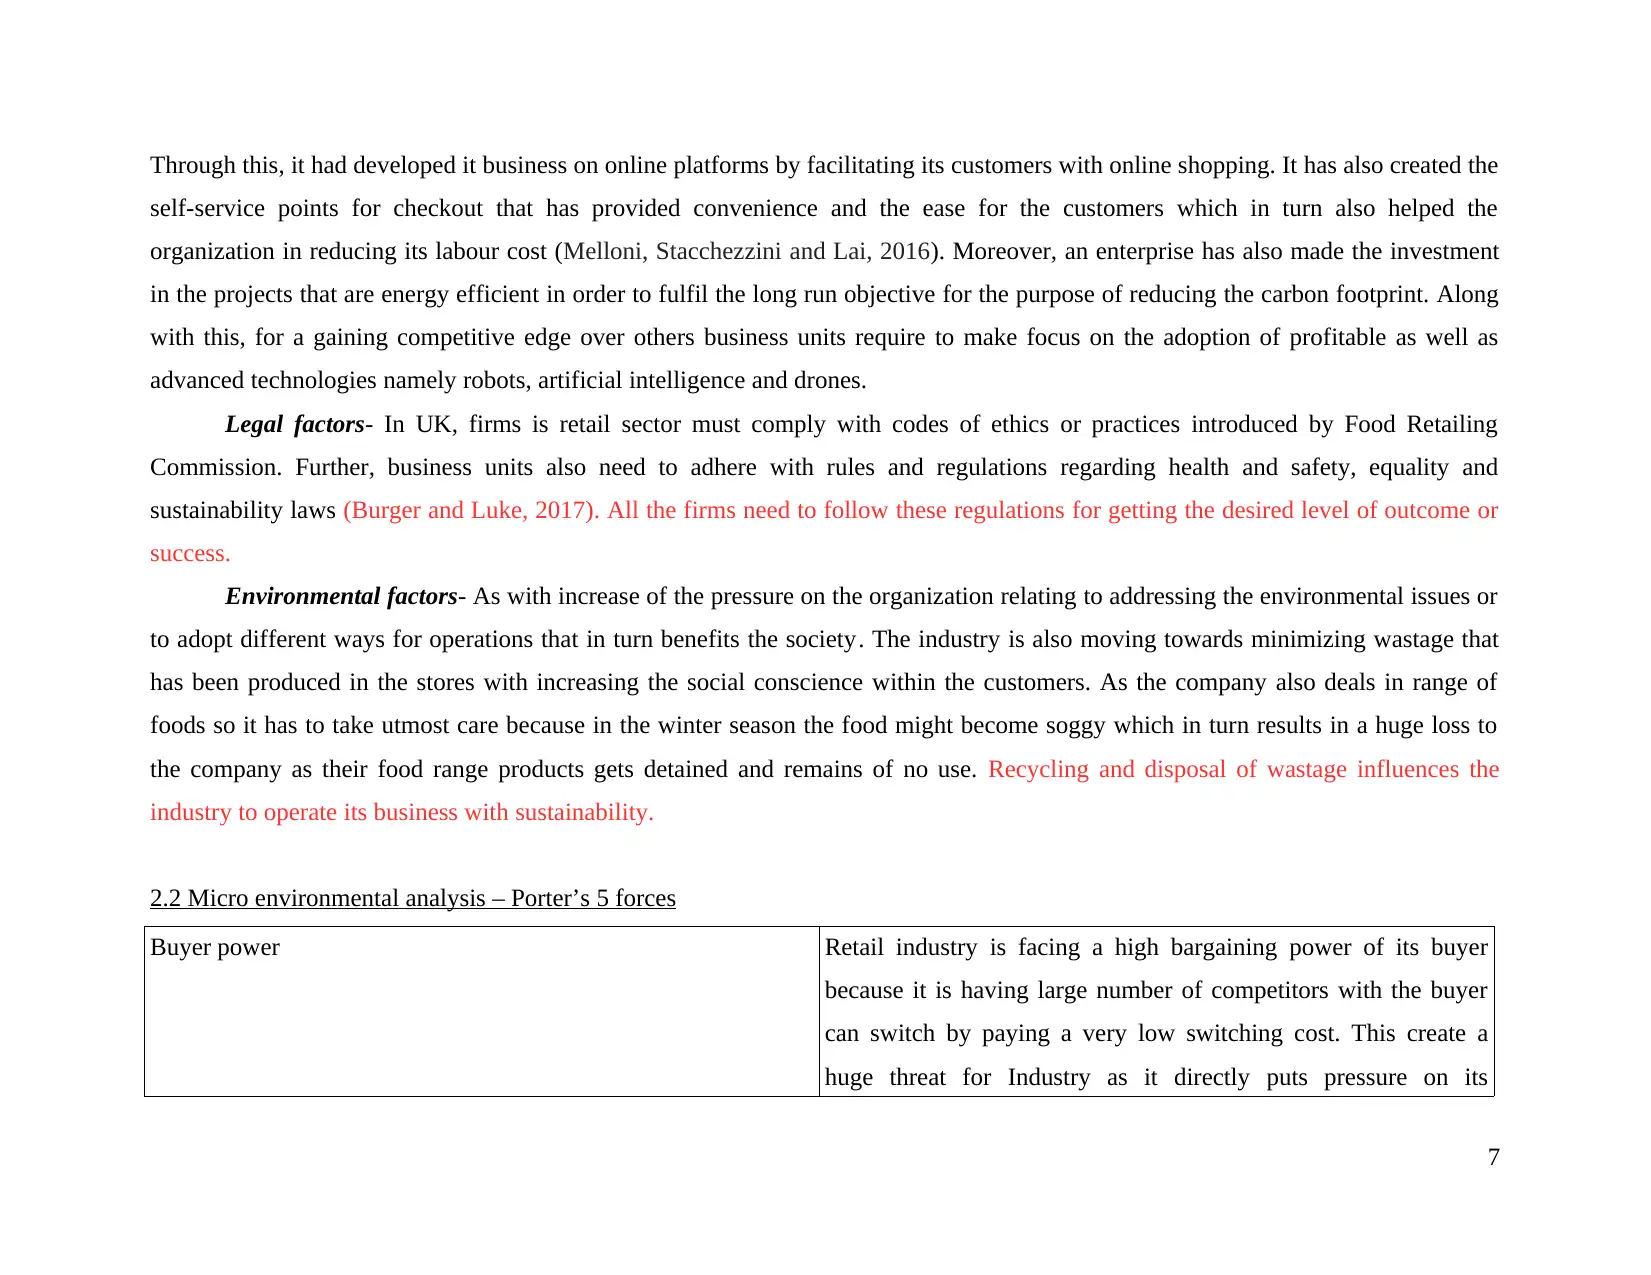
2.2 Micro environmental analysis – Porter’s 5 forces
Buyer power Retail industry is facing a high bargaining power of its buyer
because it is having large number of competitors with the buyer
can switch by paying a very low switching cost. This create a
huge threat for Industry as it directly puts pressure on its
7
self-service points for checkout that has provided convenience and the ease for the customers which in turn also helped the
organization in reducing its labour cost (Melloni, Stacchezzini and Lai, 2016). Moreover, an enterprise has also made the investment
in the projects that are energy efficient in order to fulfil the long run objective for the purpose of reducing the carbon footprint. Along
with this, for a gaining competitive edge over others business units require to make focus on the adoption of profitable as well as
advanced technologies namely robots, artificial intelligence and drones.
Legal factors- In UK, firms is retail sector must comply with codes of ethics or practices introduced by Food Retailing
Commission. Further, business units also need to adhere with rules and regulations regarding health and safety, equality and
sustainability laws (Burger and Luke, 2017). All the firms need to follow these regulations for getting the desired level of outcome or
success.
Environmental factors- As with increase of the pressure on the organization relating to addressing the environmental issues or
to adopt different ways for operations that in turn benefits the society. The industry is also moving towards minimizing wastage that
has been produced in the stores with increasing the social conscience within the customers. As the company also deals in range of
foods so it has to take utmost care because in the winter season the food might become soggy which in turn results in a huge loss to
the company as their food range products gets detained and remains of no use. Recycling and disposal of wastage influences the
industry to operate its business with sustainability.
2.2 Micro environmental analysis – Porter’s 5 forces
Buyer power Retail industry is facing a high bargaining power of its buyer
because it is having large number of competitors with the buyer
can switch by paying a very low switching cost. This create a
huge threat for Industry as it directly puts pressure on its
7
Secure Best Marks with AI Grader
Need help grading? Try our AI Grader for instant feedback on your assignments.
profitability in the long term.
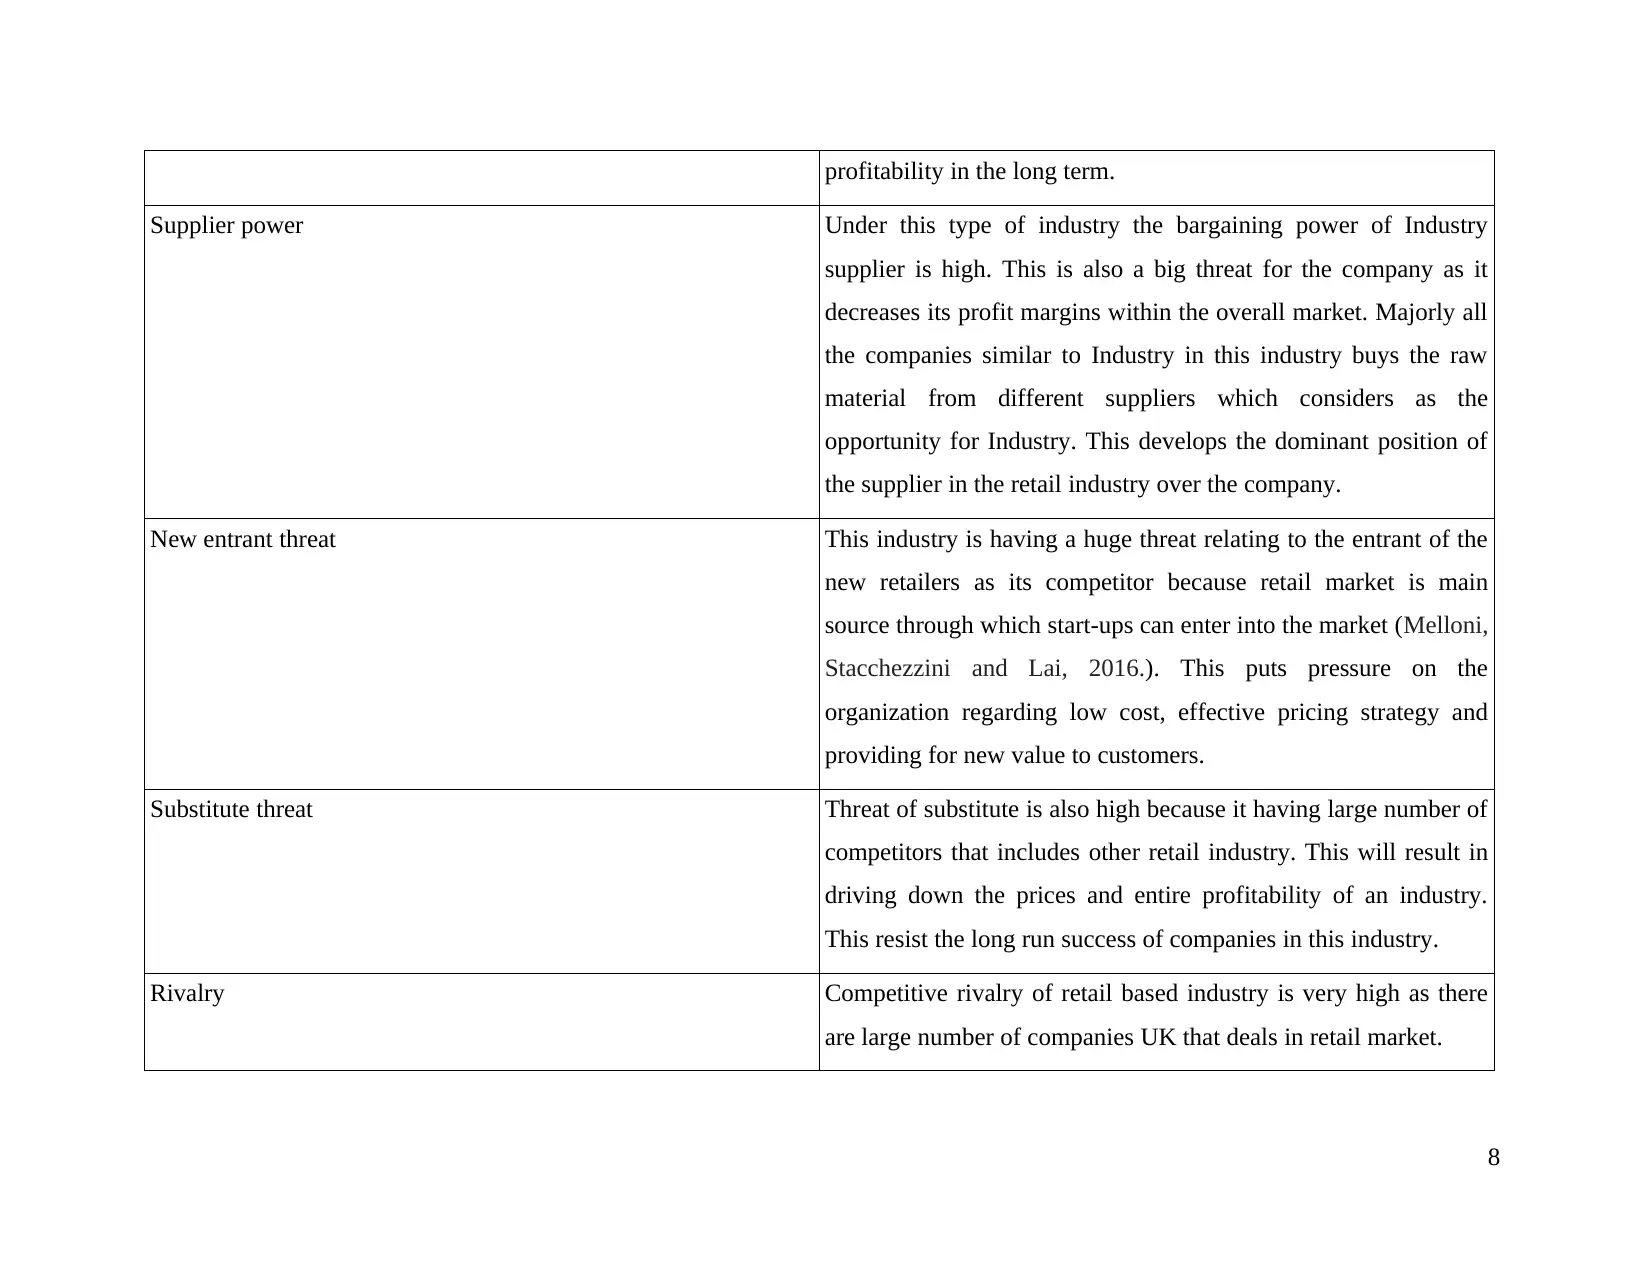
Supplier power Under this type of industry the bargaining power of Industry
supplier is high. This is also a big threat for the company as it
decreases its profit margins within the overall market. Majorly all
the companies similar to Industry in this industry buys the raw
material from different suppliers which considers as the
opportunity for Industry. This develops the dominant position of
the supplier in the retail industry over the company.
New entrant threat This industry is having a huge threat relating to the entrant of the
new retailers as its competitor because retail market is main
source through which start-ups can enter into the market (Melloni,
Stacchezzini and Lai, 2016.). This puts pressure on the
organization regarding low cost, effective pricing strategy and
providing for new value to customers.
Substitute threat Threat of substitute is also high because it having large number of
competitors that includes other retail industry. This will result in
driving down the prices and entire profitability of an industry.
This resist the long run success of companies in this industry.
Rivalry Competitive rivalry of retail based industry is very high as there
are large number of companies UK that deals in retail market.
8
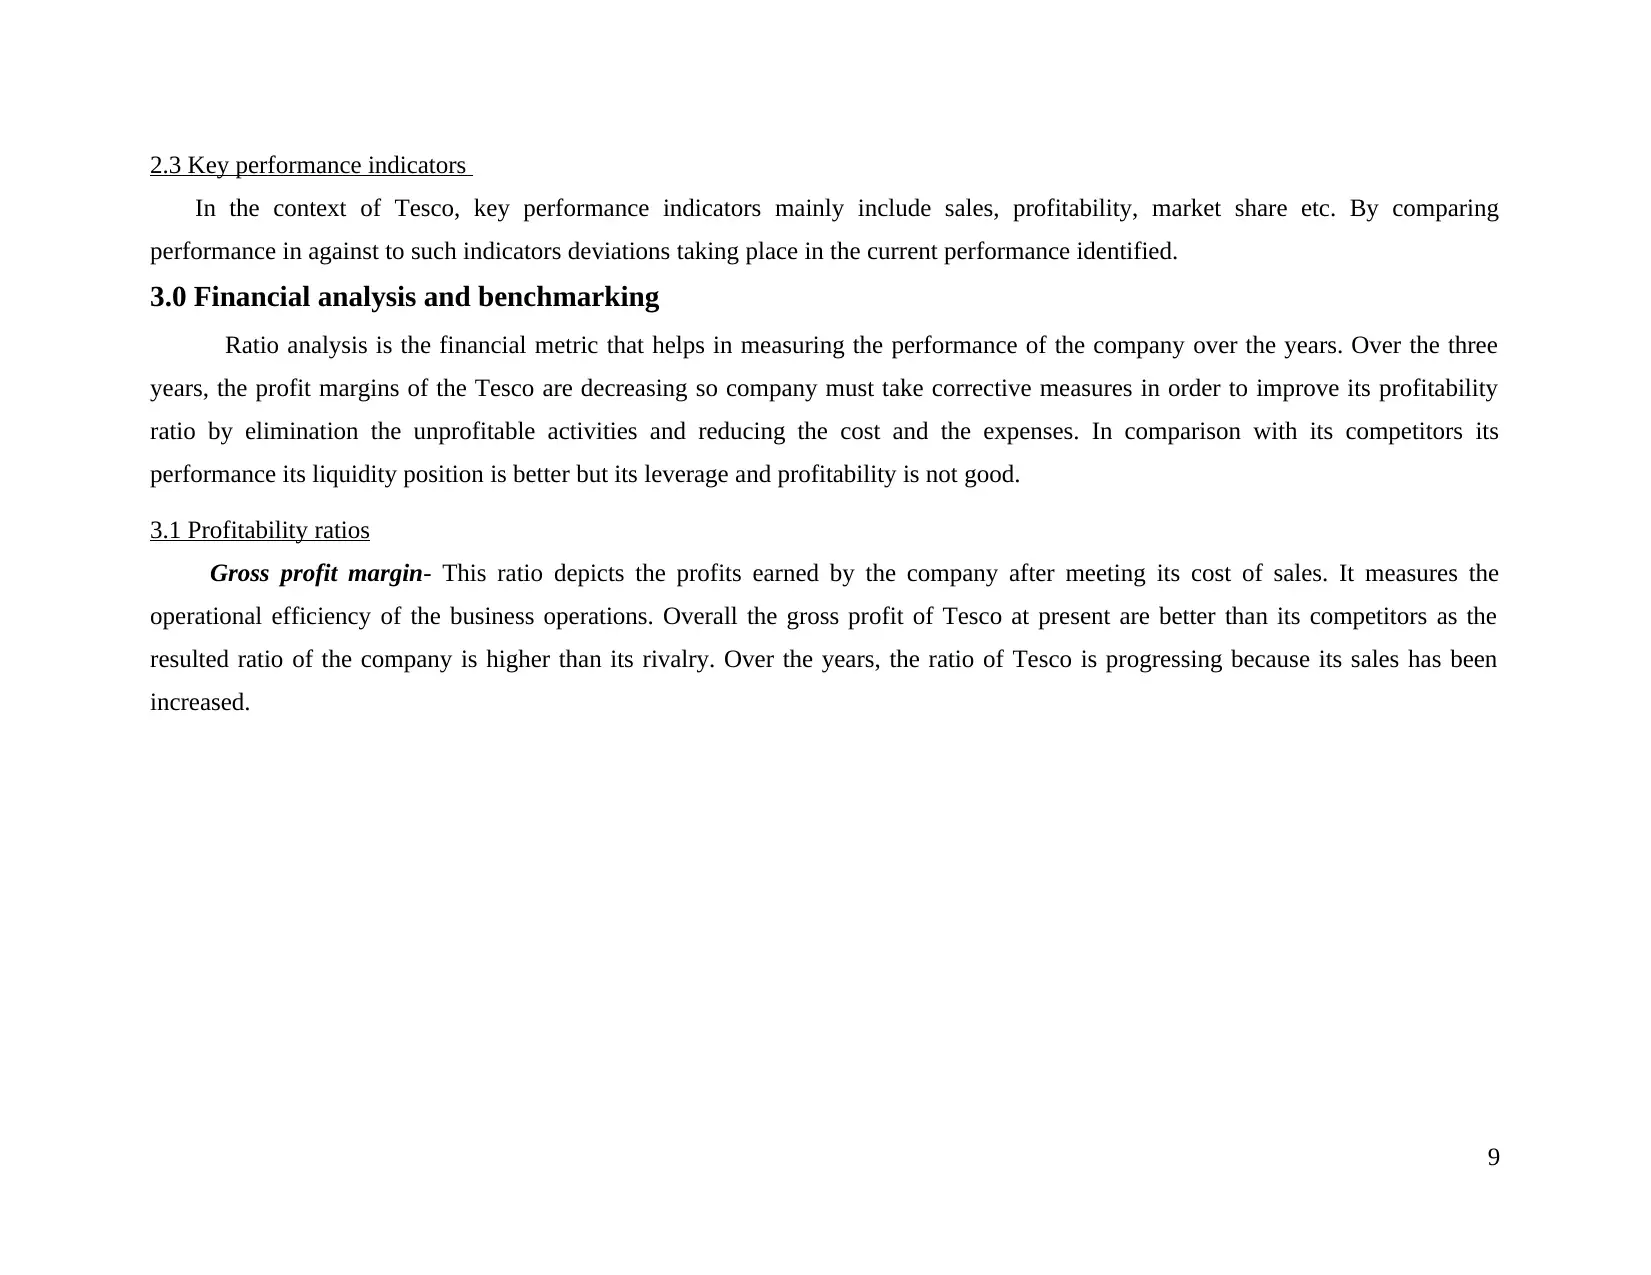
2.3 Key performance indicators
In the context of Tesco, key performance indicators mainly include sales, profitability, market share etc. By comparing
performance in against to such indicators deviations taking place in the current performance identified.
3.0 Financial analysis and benchmarking
Ratio analysis is the financial metric that helps in measuring the performance of the company over the years. Over the three
years, the profit margins of the Tesco are decreasing so company must take corrective measures in order to improve its profitability
ratio by elimination the unprofitable activities and reducing the cost and the expenses. In comparison with its competitors its
performance its liquidity position is better but its leverage and profitability is not good.
3.1 Profitability ratios
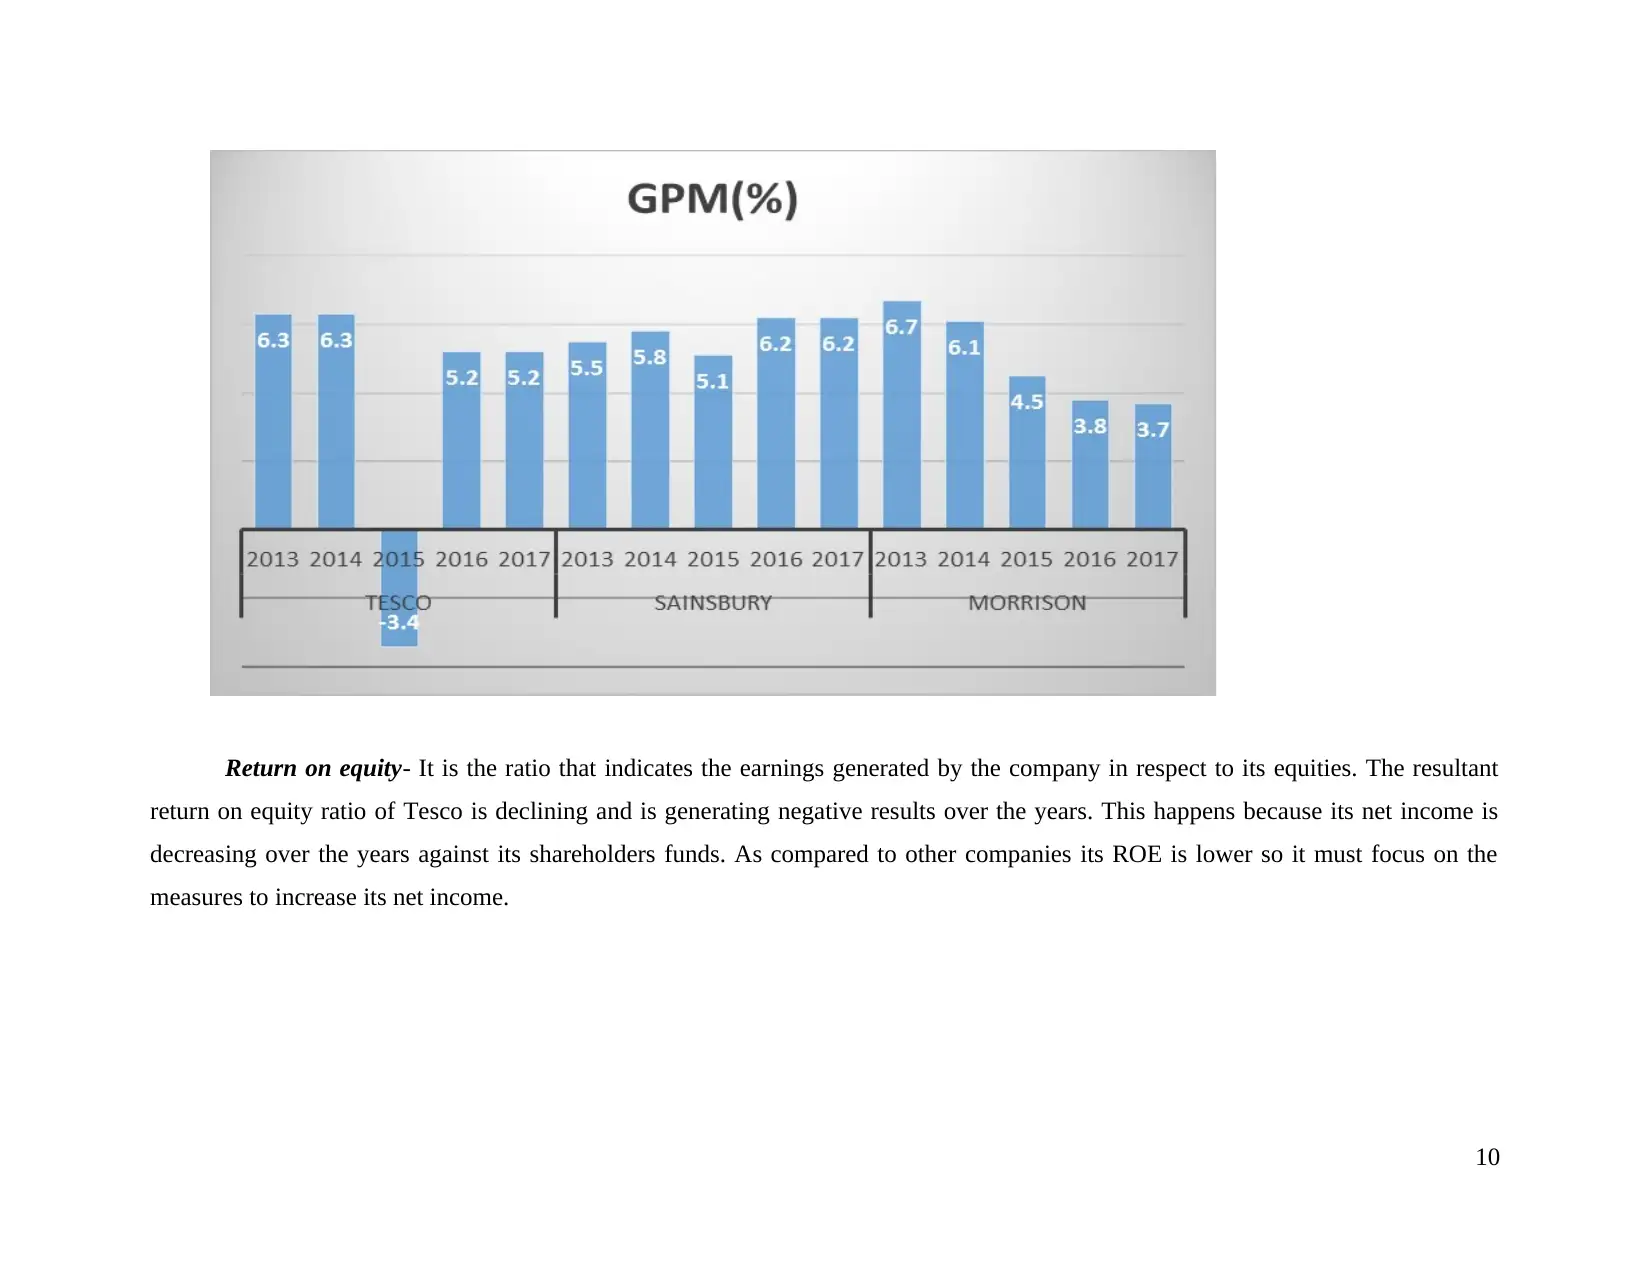
Gross profit margin- This ratio depicts the profits earned by the company after meeting its cost of sales. It measures the
operational efficiency of the business operations. Overall the gross profit of Tesco at present are better than its competitors as the
resulted ratio of the company is higher than its rivalry. Over the years, the ratio of Tesco is progressing because its sales has been
increased.
9
In the context of Tesco, key performance indicators mainly include sales, profitability, market share etc. By comparing
performance in against to such indicators deviations taking place in the current performance identified.
3.0 Financial analysis and benchmarking
Ratio analysis is the financial metric that helps in measuring the performance of the company over the years. Over the three
years, the profit margins of the Tesco are decreasing so company must take corrective measures in order to improve its profitability
ratio by elimination the unprofitable activities and reducing the cost and the expenses. In comparison with its competitors its
performance its liquidity position is better but its leverage and profitability is not good.
3.1 Profitability ratios
Gross profit margin- This ratio depicts the profits earned by the company after meeting its cost of sales. It measures the
operational efficiency of the business operations. Overall the gross profit of Tesco at present are better than its competitors as the
resulted ratio of the company is higher than its rivalry. Over the years, the ratio of Tesco is progressing because its sales has been
increased.
9
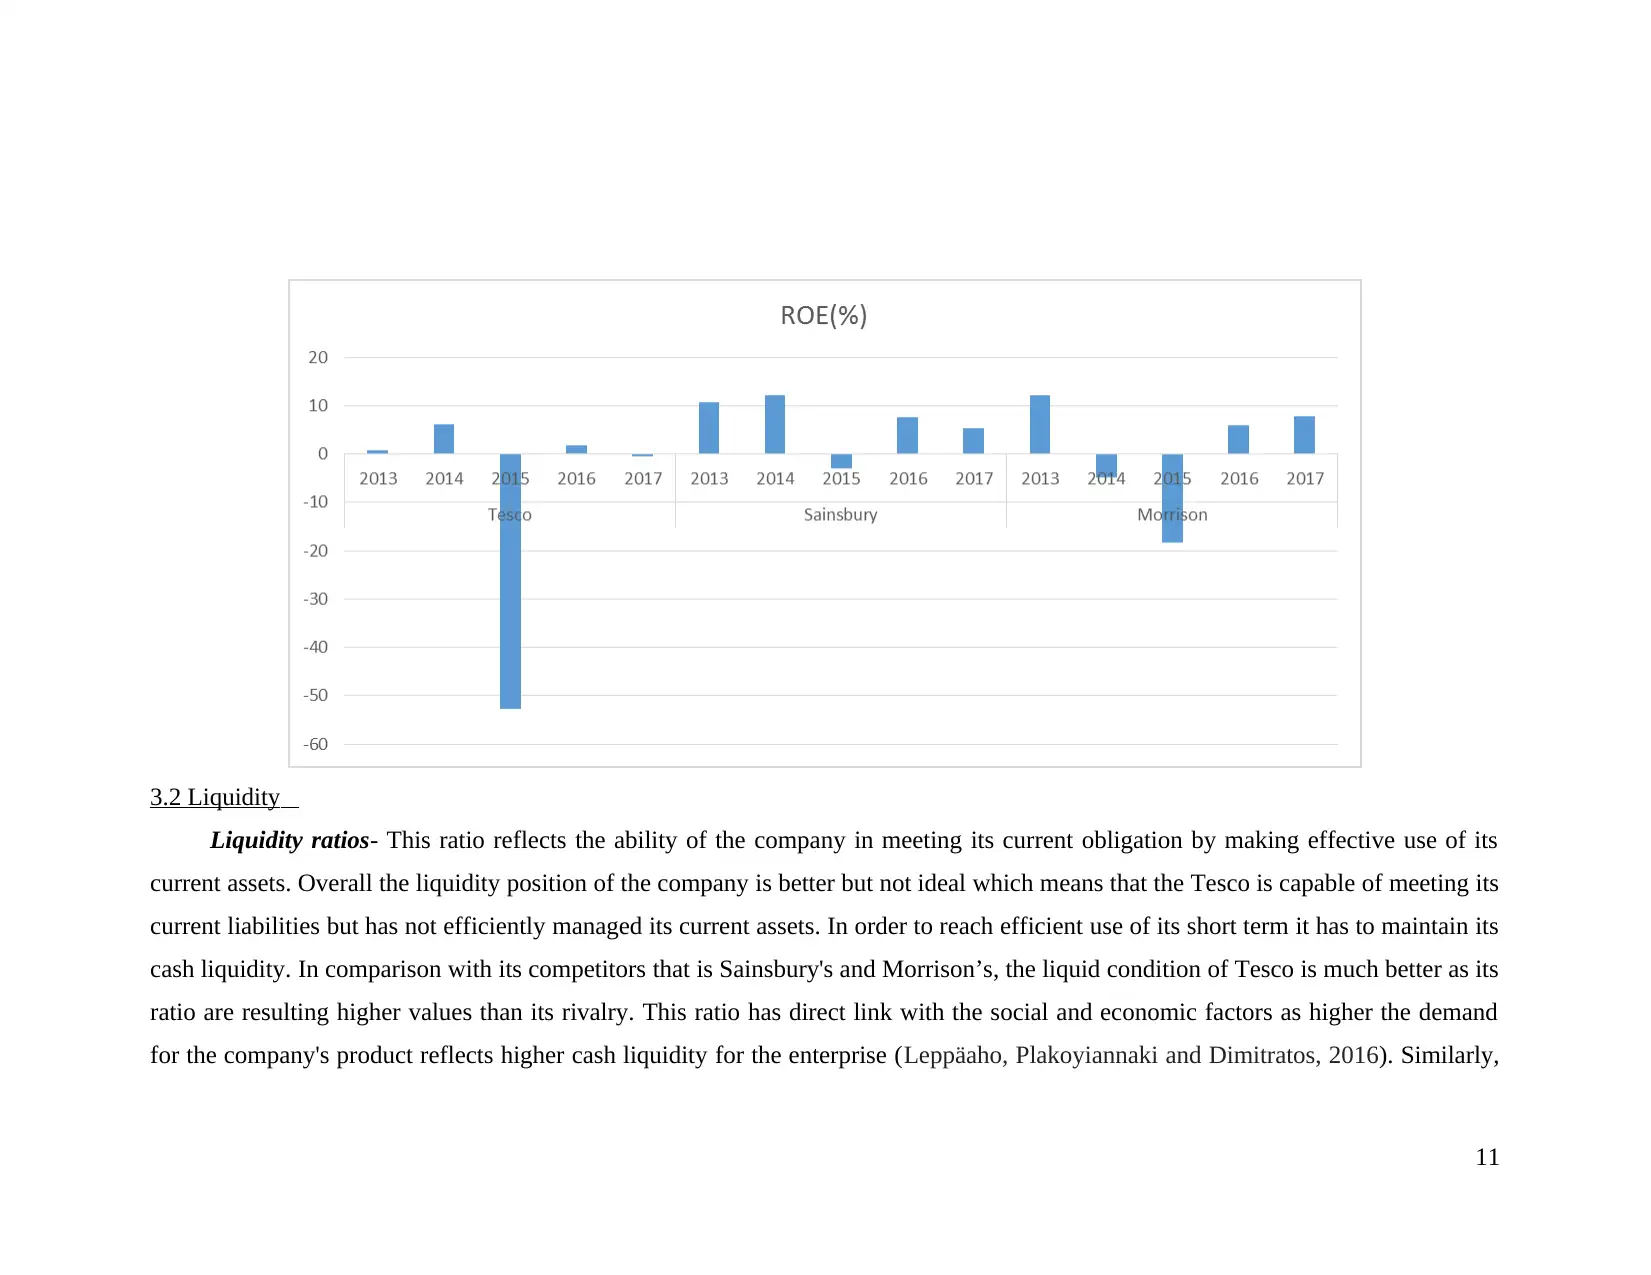
Return on equity- It is the ratio that indicates the earnings generated by the company in respect to its equities. The resultant
return on equity ratio of Tesco is declining and is generating negative results over the years. This happens because its net income is
decreasing over the years against its shareholders funds. As compared to other companies its ROE is lower so it must focus on the
measures to increase its net income.
10
Paraphrase This Document
Need a fresh take? Get an instant paraphrase of this document with our AI Paraphraser
3.2 Liquidity
Liquidity ratios- This ratio reflects the ability of the company in meeting its current obligation by making effective use of its
current assets. Overall the liquidity position of the company is better but not ideal which means that the Tesco is capable of meeting its
current liabilities but has not efficiently managed its current assets. In order to reach efficient use of its short term it has to maintain its
cash liquidity. In comparison with its competitors that is Sainsbury's and Morrison’s, the liquid condition of Tesco is much better as its
ratio are resulting higher values than its rivalry. This ratio has direct link with the social and economic factors as higher the demand
for the company's product reflects higher cash liquidity for the enterprise (Leppäaho, Plakoyiannaki and Dimitratos, 2016). Similarly,
11
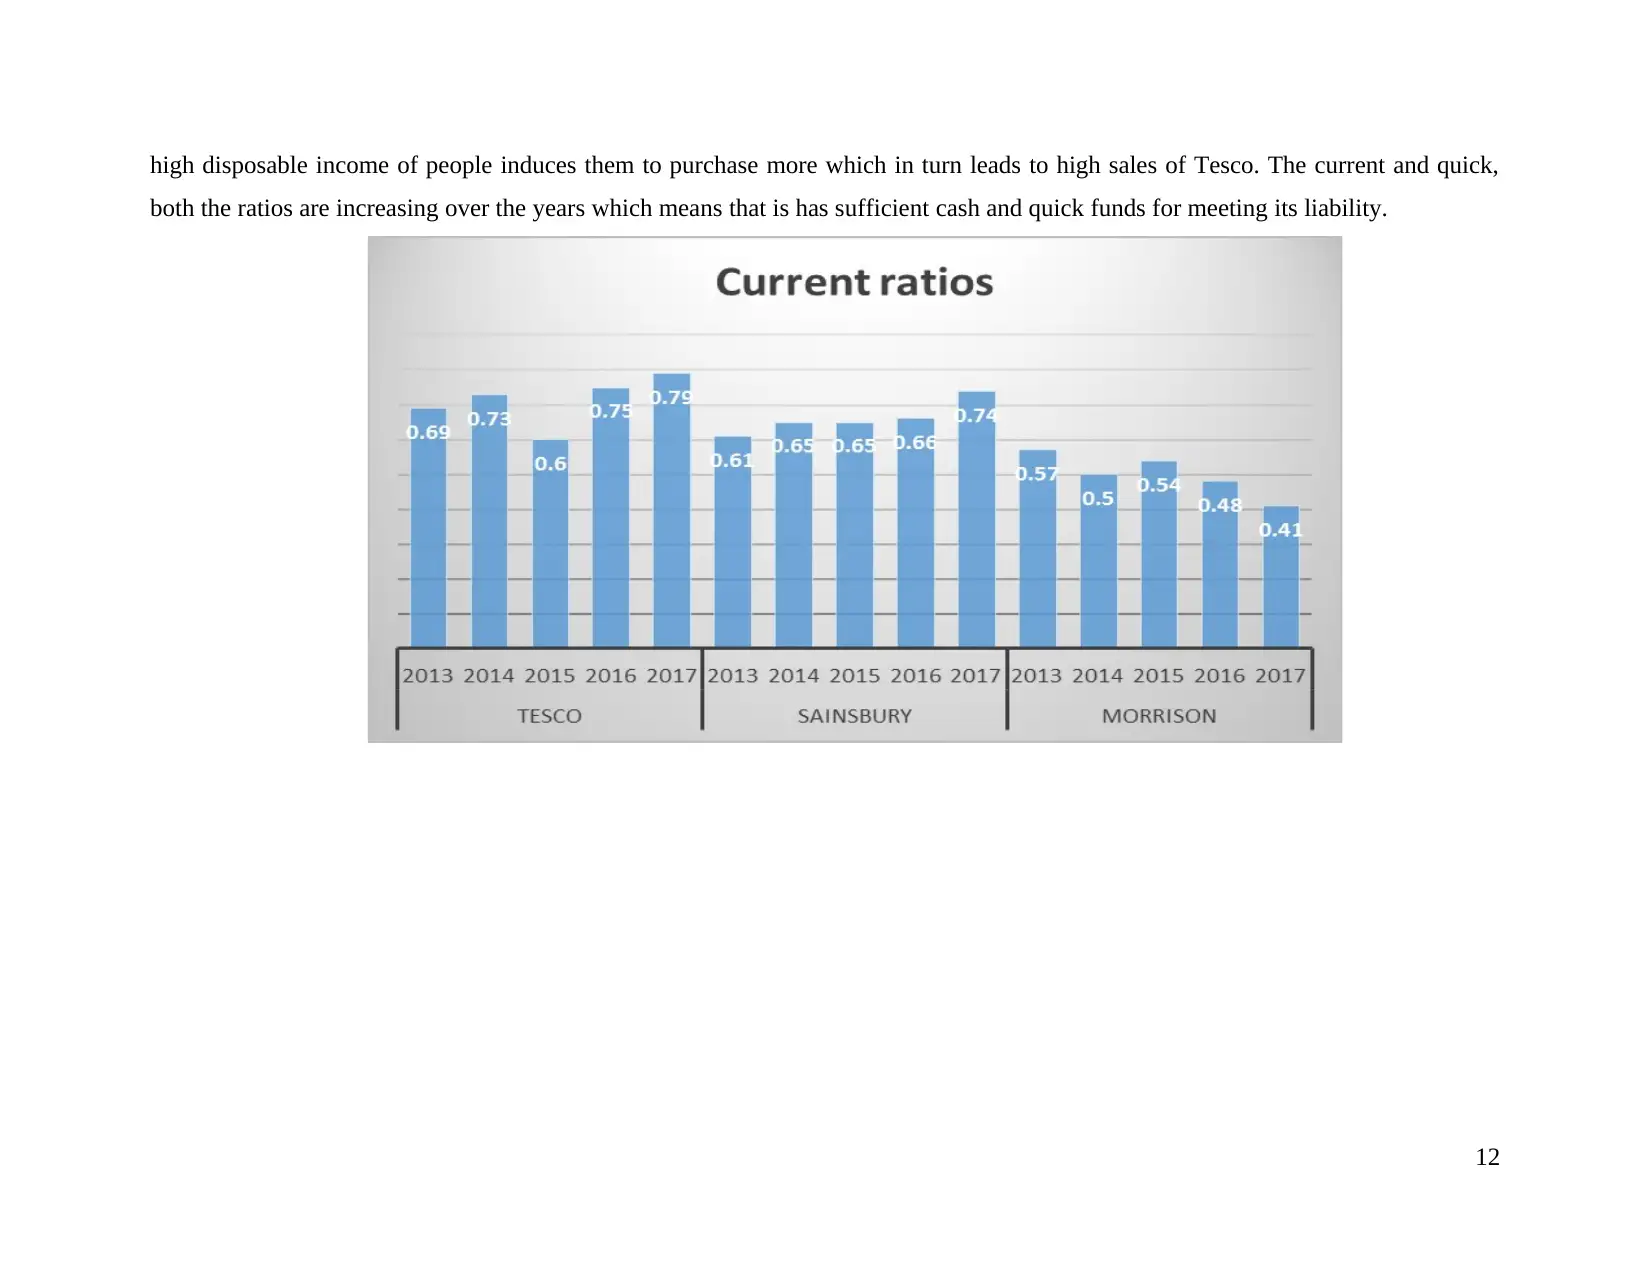
high disposable income of people induces them to purchase more which in turn leads to high sales of Tesco. The current and quick,
both the ratios are increasing over the years which means that is has sufficient cash and quick funds for meeting its liability.
12
both the ratios are increasing over the years which means that is has sufficient cash and quick funds for meeting its liability.
12
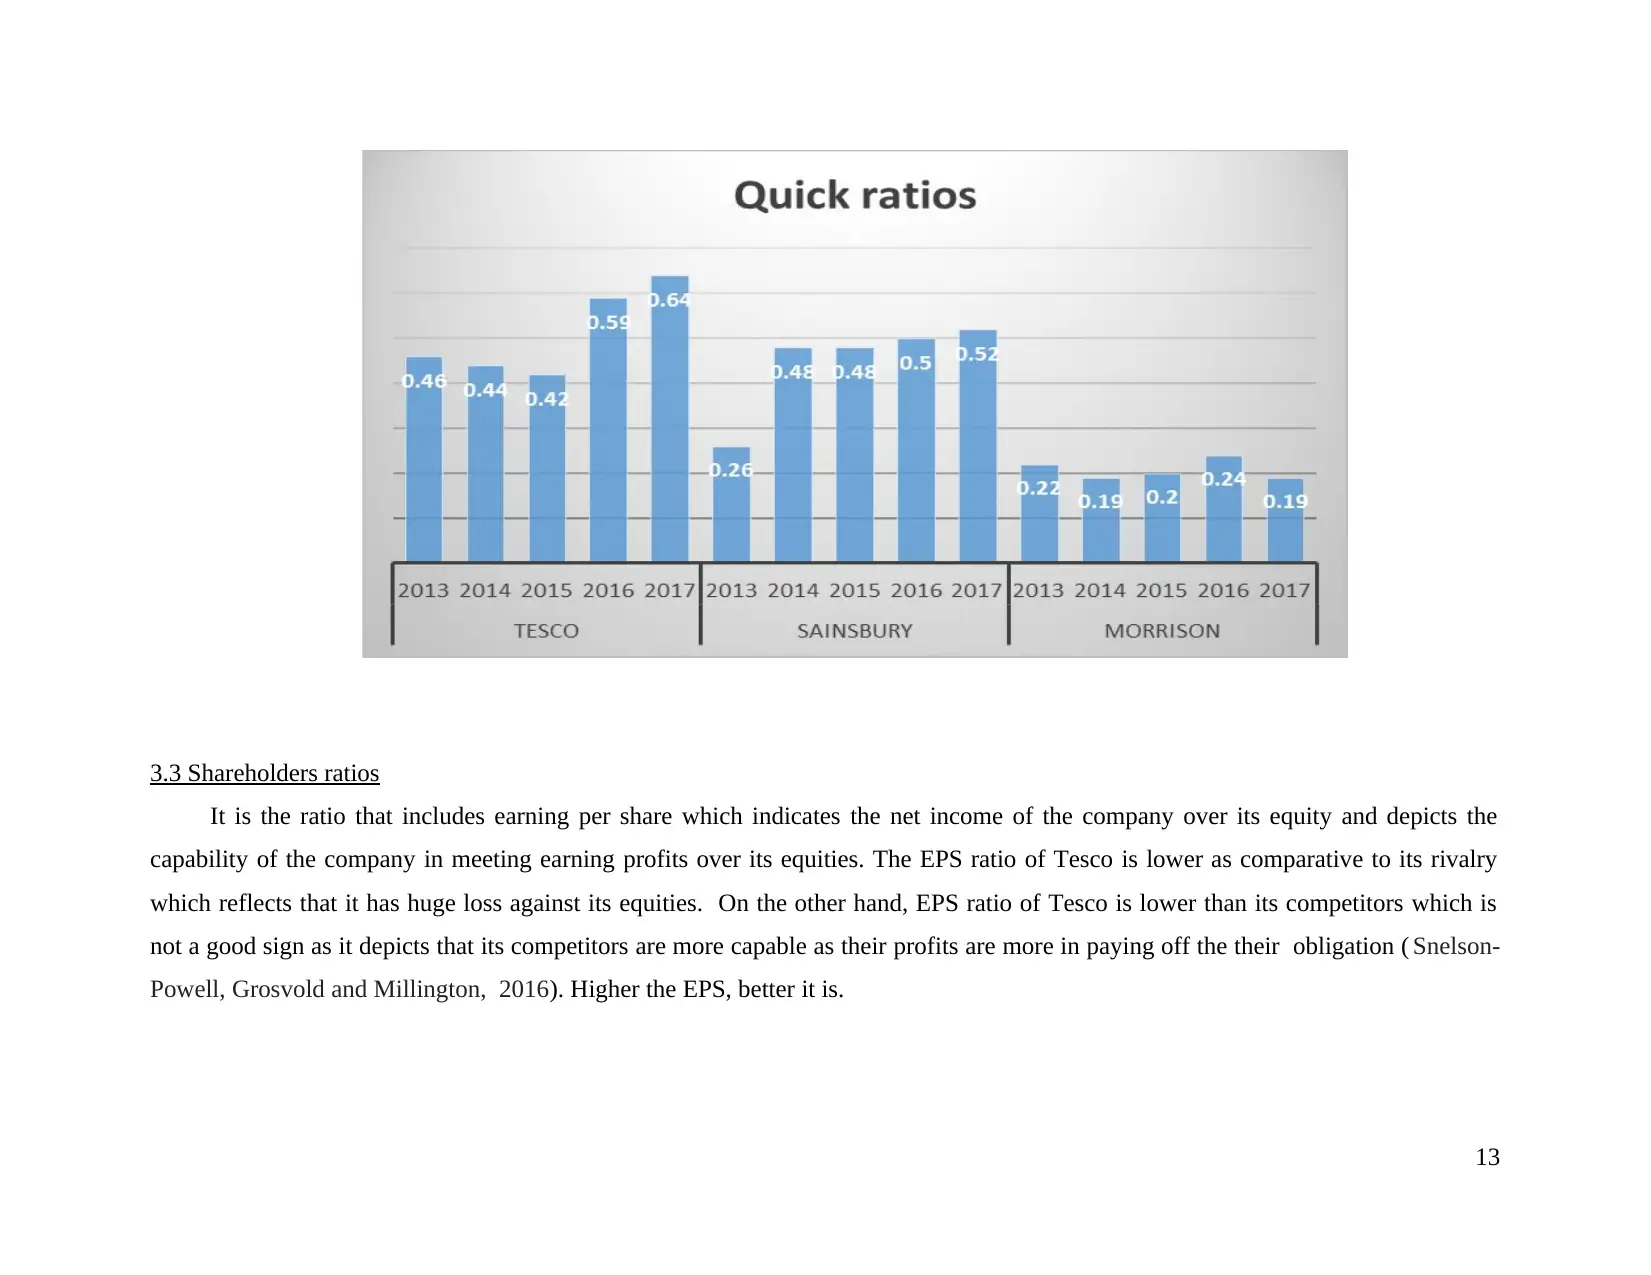
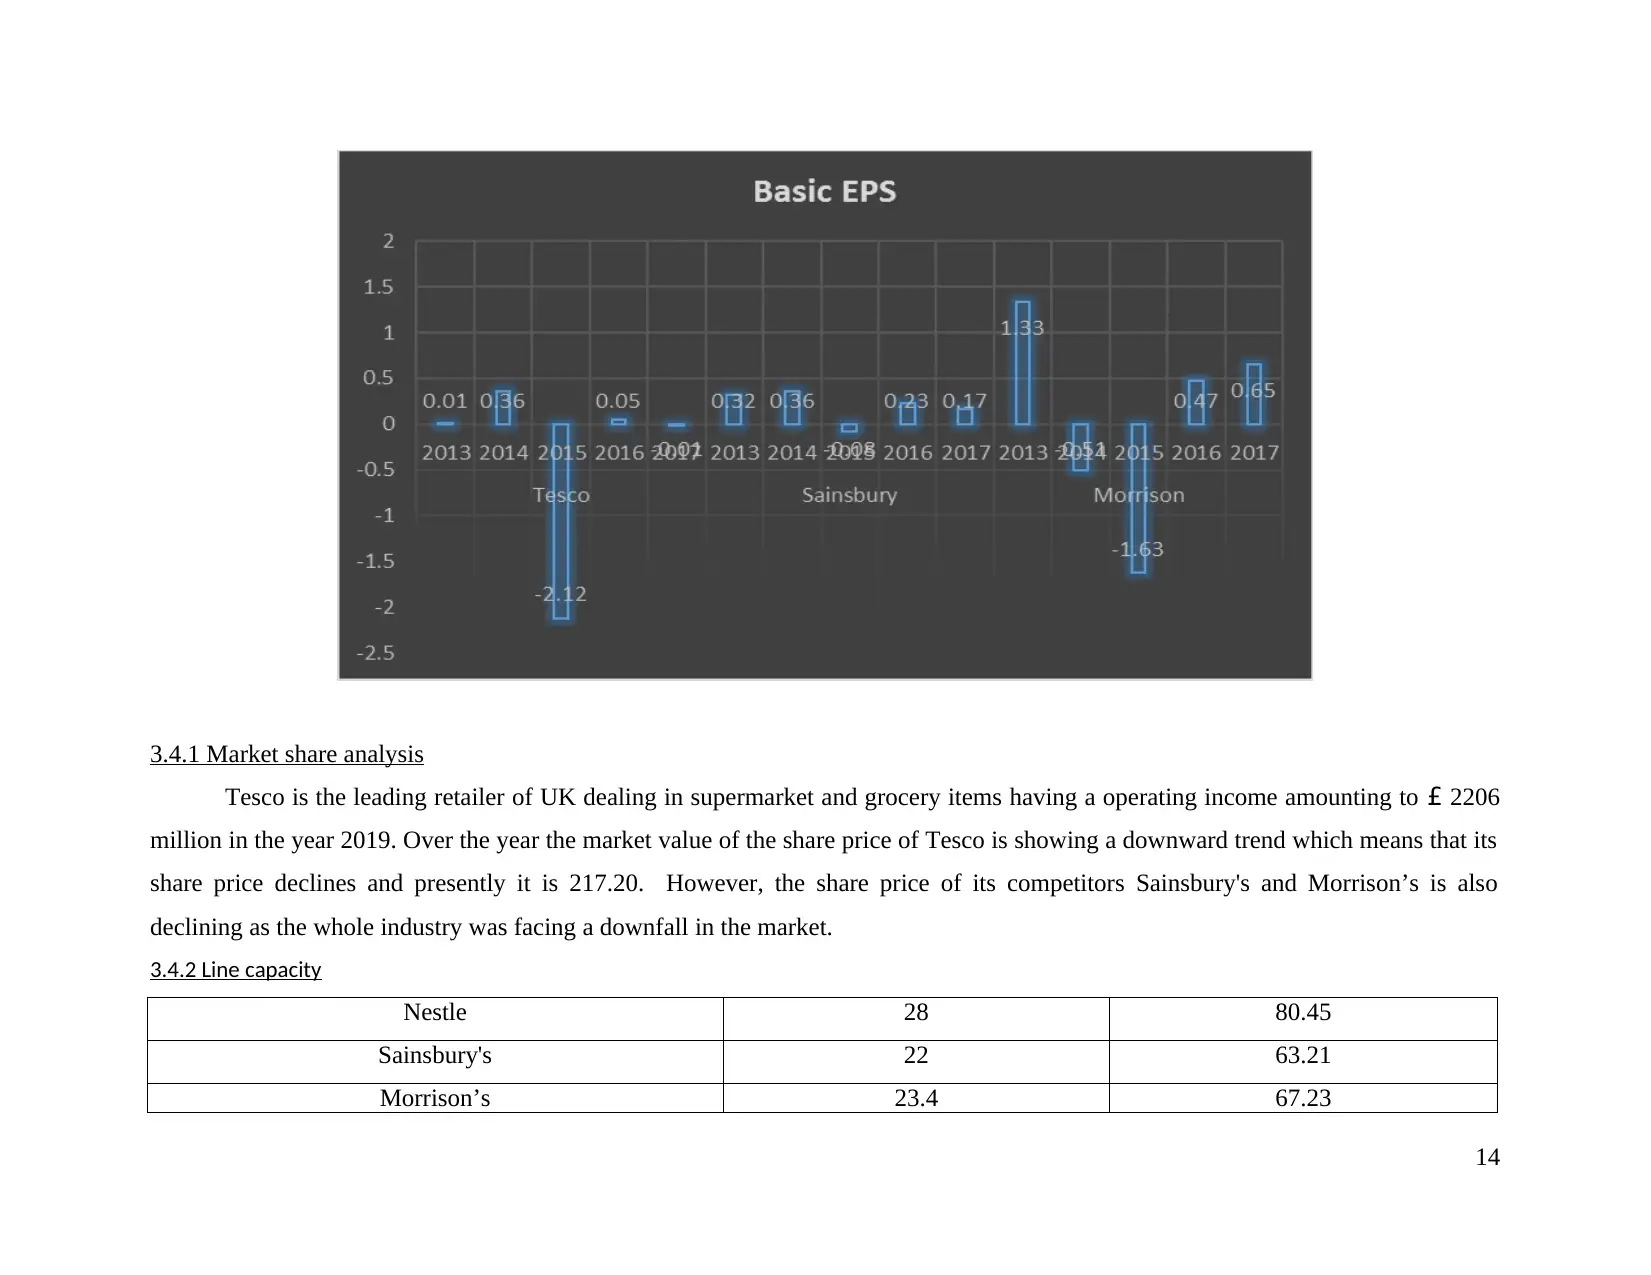
3.3 Shareholders ratios
It is the ratio that includes earning per share which indicates the net income of the company over its equity and depicts the
capability of the company in meeting earning profits over its equities. The EPS ratio of Tesco is lower as comparative to its rivalry
which reflects that it has huge loss against its equities. On the other hand, EPS ratio of Tesco is lower than its competitors which is
not a good sign as it depicts that its competitors are more capable as their profits are more in paying off the their obligation ( Snelson-
Powell, Grosvold and Millington, 2016). Higher the EPS, better it is.
13
Secure Best Marks with AI Grader
Need help grading? Try our AI Grader for instant feedback on your assignments.
3.4.1 Market share analysis
Tesco is the leading retailer of UK dealing in supermarket and grocery items having a operating income amounting to £ 2206
million in the year 2019. Over the year the market value of the share price of Tesco is showing a downward trend which means that its
share price declines and presently it is 217.20. However, the share price of its competitors Sainsbury's and Morrison’s is also
declining as the whole industry was facing a downfall in the market.
3.4.2 Line capacity
Nestle 28 80.45
Sainsbury's 22 63.21
Morrison’s 23.4 67.23
14
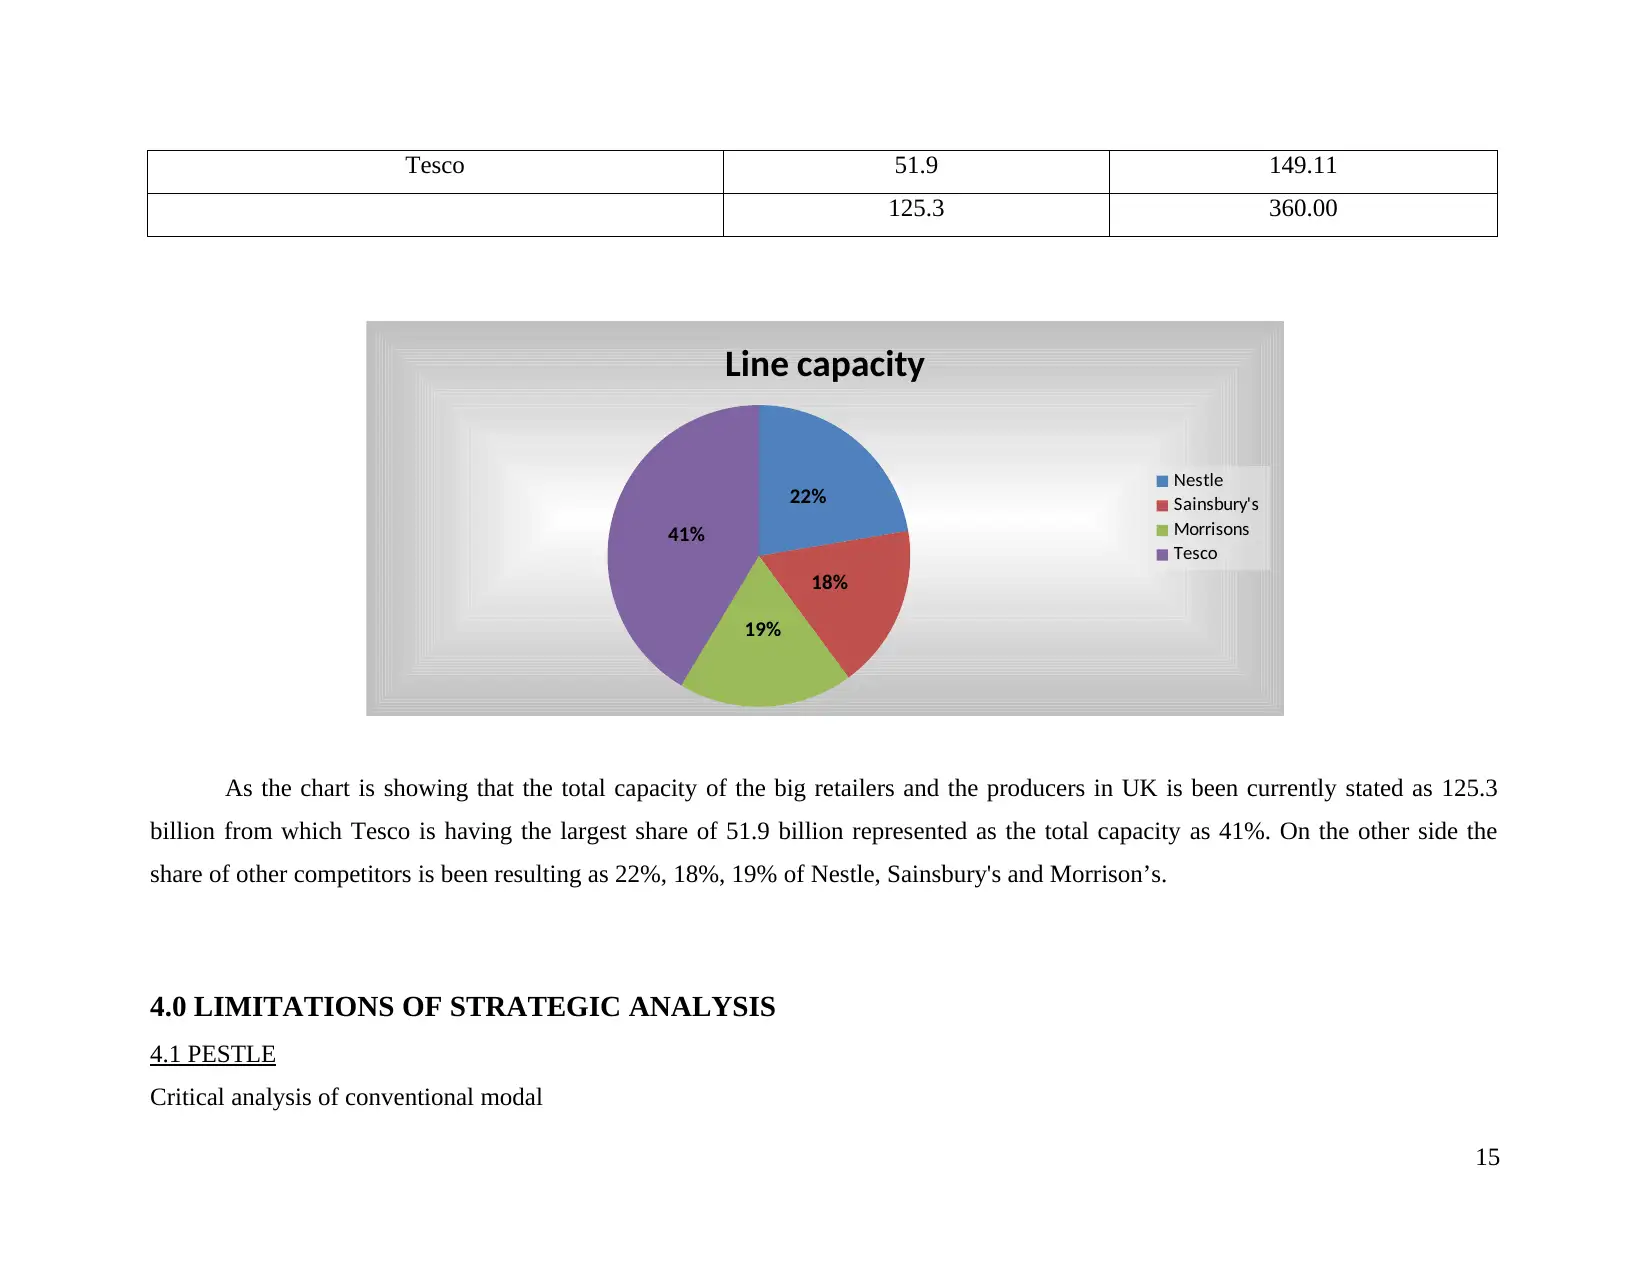
Tesco 51.9 149.11
125.3 360.00
As the chart is showing that the total capacity of the big retailers and the producers in UK is been currently stated as 125.3
billion from which Tesco is having the largest share of 51.9 billion represented as the total capacity as 41%. On the other side the
share of other competitors is been resulting as 22%, 18%, 19% of Nestle, Sainsbury's and Morrison’s.
4.0 LIMITATIONS OF STRATEGIC ANALYSIS
4.1 PESTLE
Critical analysis of conventional modal
15
22%
18%
19%
41%
Line capacity
Nestle
Sainsbury's
Morrisons
Tesco
Conventional analysis can be effectively performed through PESTLE analysis of the company. Formulating of business
strategies and plans as per the influence of these factors may lead in improving the quality of managers and improving sustainability
of the company within the competitive market. On the other hand, there are also several limitations of the PESTLE analysis such as, in
order to perform PESTLE analysis of the company on frequent basis, the Tesco would need to appoint some specialists of business
environment (Potential Limitations of the PEST Analysis and How to Address Them. 2018). Further, in case, the managers or the
research and development team fails to collect feasible data regarding all the factors of PESTLE analysis, they would fail to derive
accurate results regarding influence of different factors over the business.
Thus, it can be said that there are several limitations of both financial and conventional modal. Although, they provides
positive results if they are being applied accurately.
4.2 Porter’s 5 forces
Limitation- :
It ignores the strategy in relation to inside-out.
This model does not cope up with the interdependencies and the synergies in the portfolio in respect of the larger
organizations.
It facilitates disruptive innovation as it includes the environments that are been categorised as radical, rapid and systematic
change needs more emerged, dynamic and flexible approaches towards the formulation of the strategy.
Under this sometimes it might possible for creating completely a new market rather than choosing from the existing ones that
is the blue ocean strategy.
4.3 Financial analysis
Limitations of financial ratios:
16
Paraphrase This Document
Need a fresh take? Get an instant paraphrase of this document with our AI Paraphraser
Ratio analysis is one of the best modal used for business analysis, as it helps in improving the overall financial performance of
the business. Although, along with numerous merits, there are also some limitations of the modal such as:
It does not consider any change in the price level or inflation in the country between the periods.
It simply ignores qualitative aspects of companies.
Further, the financial ratios does not help financial managers in resolving any financial problems. Rather, they also help them
in their decision making and performance of managerial functions.
Manipulation of financial statements is not a typical task for the company. It may result in use of window dressing by the
companies by showing wrong financial position to its stakeholders.
5. CONCLUSION
By summing up it has been concluded that business analysis plays a critical role in the execution of the project that involves
the stage of testing and the development. Development includes the modelling of the internal working of the business processes and
flowing of the data. It also helps the organization in focusing on determining the essential components which impacts the performance
system and in preparing the test plans. Making the business analysis is crucial for the company in gaining the financial strength within
the market. Tesco by making the assessment of its organization in order to enhance the technical and the tactical skills as they create
the awareness in relation to the market scenario and its position in overall market. Business analysis includes communicating the
technical details to the stakeholders of the business in easy language which is understandable to them. It also enables the company in
the managing the requirement of the user because the schedules and the budgets in the project might slip in case the needs keeps on
changing. It involves developing the better understanding in relation to the external factors that are political, technological,
environmental and social. These factors has the direct impact on the strategy of the corporate and in turn helps the project managers in
gaining the insights for developing an effective strategy which leads to the changes in the scope of the project. PESTLE analysis helps
the managers in analysing each external factors of the environment having their impact over the business of an organisation. With the
17
help of this analysis, managers can formulate their strategies for reducing influence of those factors. It helps in estimating various
future risks that may arise in the near future of the company due to influence of those factors that are not in control of the Tesco. In
addition, it may need to formulate a separate research and development team that would make a regular research over all the macro
economic factors of the company and would analyse their impact over the business of firm. It would lead in increasing the cost of
operations of the company.
6. RECOMMENDATIONS
By studying the above business analysis of Tesco plc, it can be stated that company is efficiently performing its business
performance with the help of effective strategies and plans of its directors and managers. Although, financial ratio analysis of the
Tesco states that company's performance in maintaining its liquidity position is not efficient. Thus, it can be recommended to its
managers that they should make an in depth study of several current resources held by the company. It would help them in
determining actual financial need of the firm through which they would become able to improve the liquidity position of the firm.
Further, by analysing PESTLE analysis of the Tesco, it can be recommended to the company that it should formulate a
separate team and provide them a task to make a regular study on various macro environmental factors and their impact over the
company's business as well. It would lead in helping the Tesco in eliminating or reducing the level of influence of these factors. Thus,
it would help the managers in maintaining smoothness in the workings of the company and increase its profitability and marketability
as well.
6.1 Potential strategy direction
In order to grow and attains the competitive edge within the internal and the external environment, Tesco uses Ansoff matrix in
context of adopting the strategy for expanding its business into new markets with launching of the new product.
18
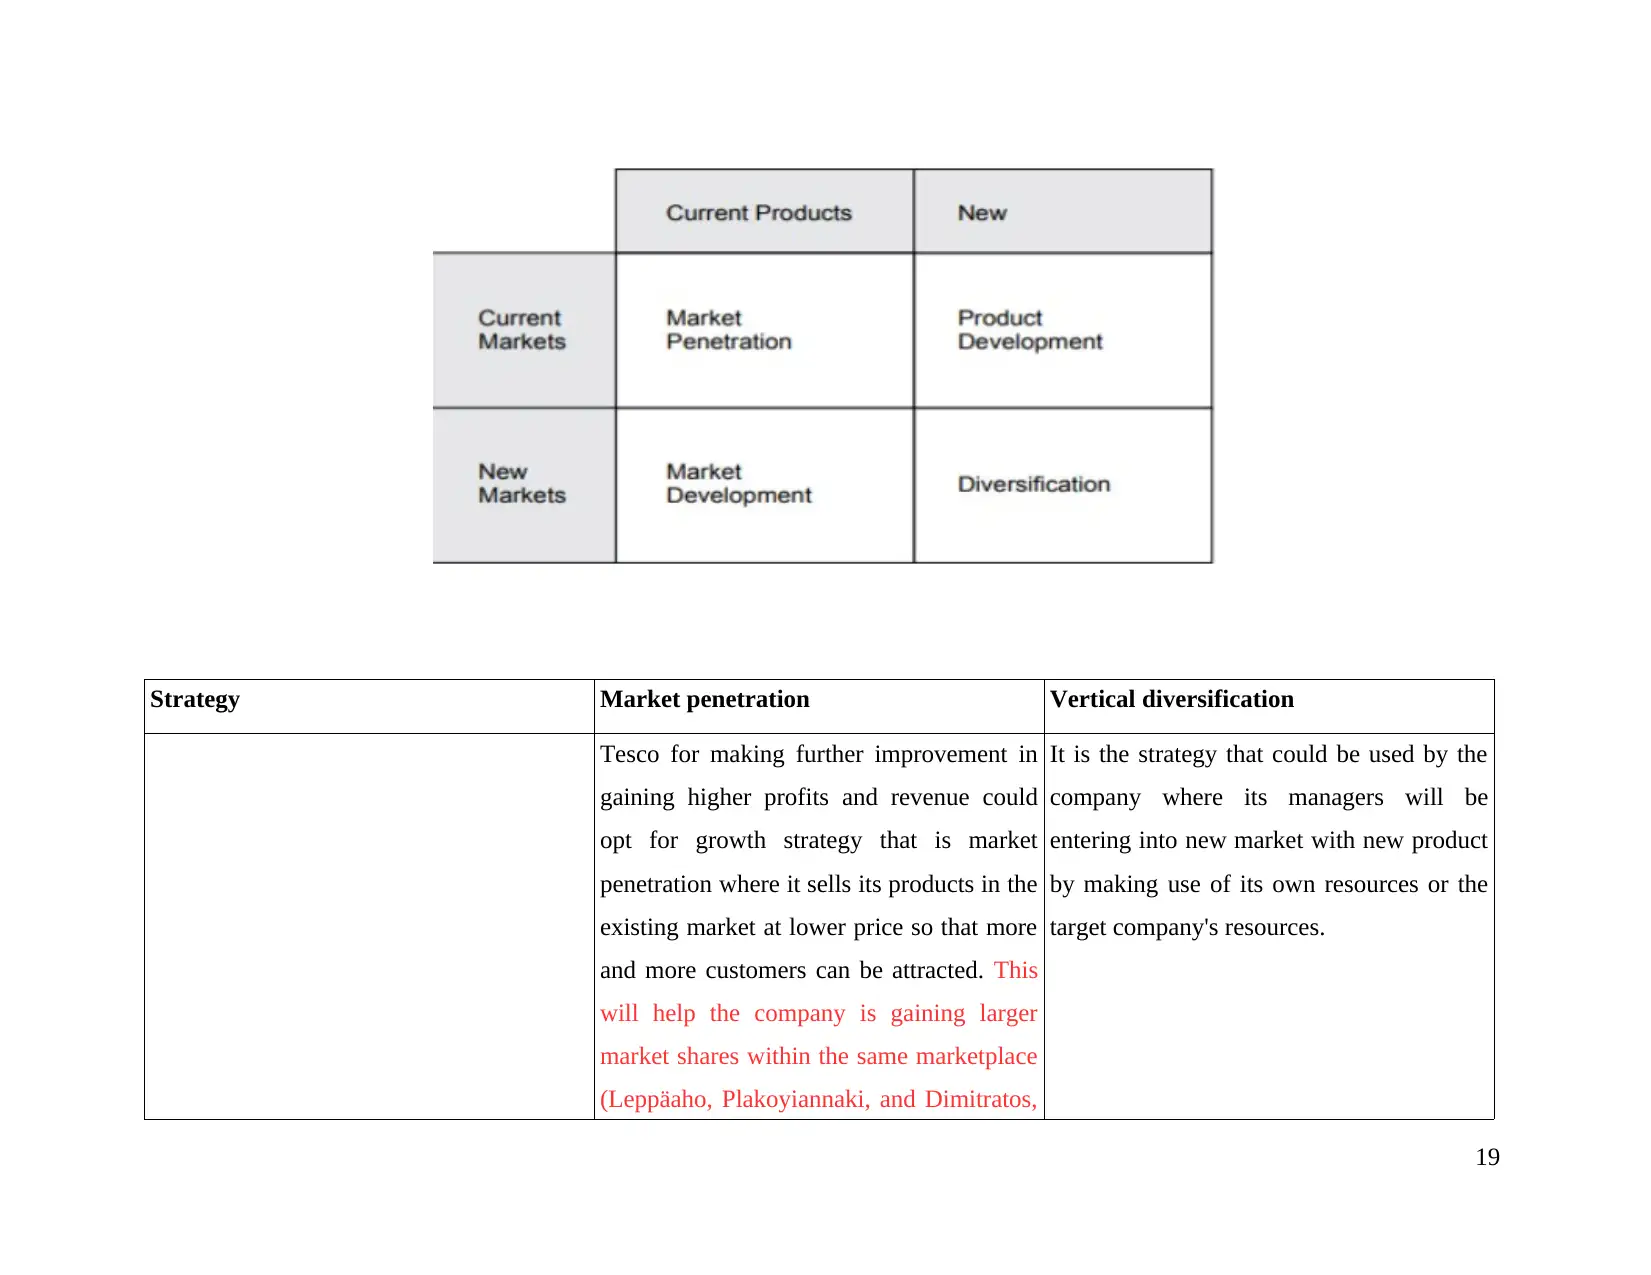
Strategy Market penetration Vertical diversification
Tesco for making further improvement in
gaining higher profits and revenue could
opt for growth strategy that is market
penetration where it sells its products in the
existing market at lower price so that more
and more customers can be attracted. This
will help the company is gaining larger
market shares within the same marketplace
(Leppäaho, Plakoyiannaki, and Dimitratos,
It is the strategy that could be used by the
company where its managers will be
entering into new market with new product
by making use of its own resources or the
target company's resources.
19
Secure Best Marks with AI Grader
Need help grading? Try our AI Grader for instant feedback on your assignments.
2016). This could be done by the company
by acquiring its competitive company so
that customers of that company will
become the customers of Tesco. This also
results in attaining economies of scale and
higher profits.
7.0 STRATEGY EVALUATION
7.1 Suitability
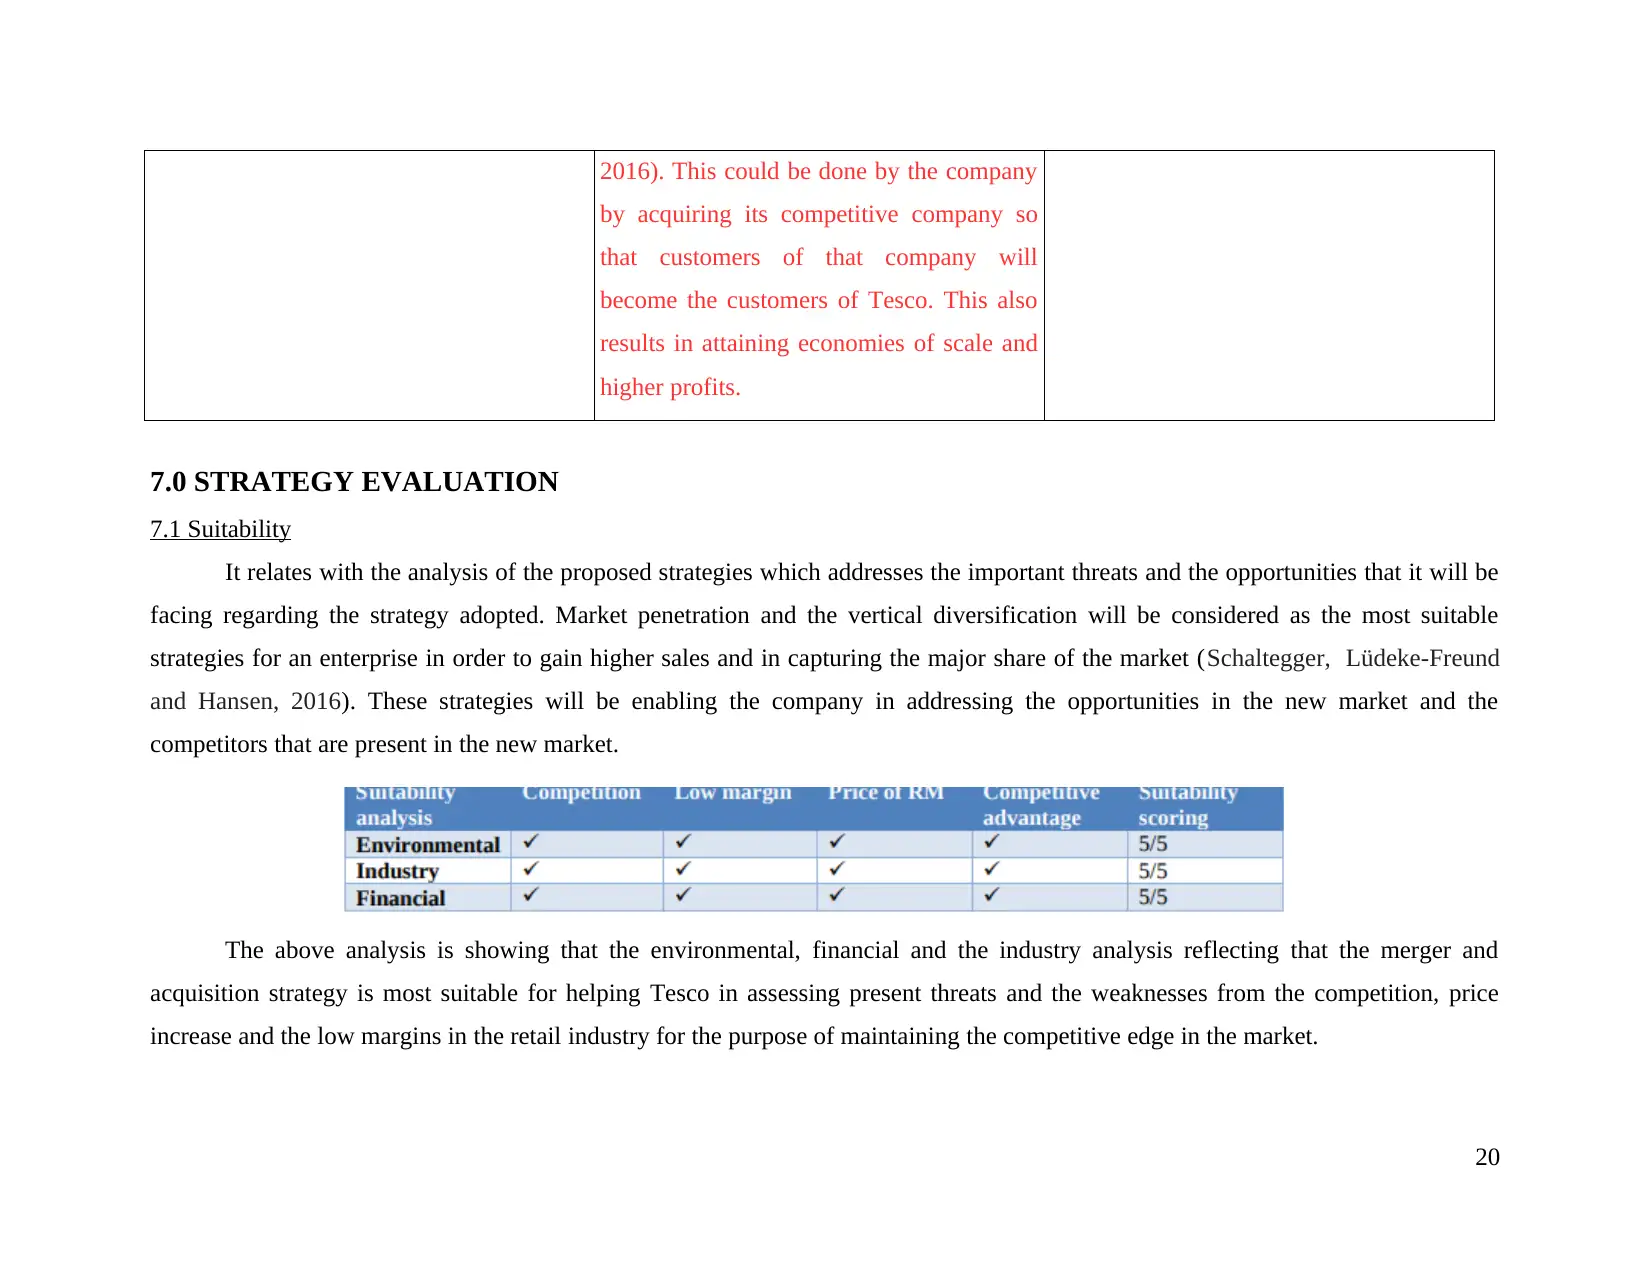
It relates with the analysis of the proposed strategies which addresses the important threats and the opportunities that it will be
facing regarding the strategy adopted. Market penetration and the vertical diversification will be considered as the most suitable
strategies for an enterprise in order to gain higher sales and in capturing the major share of the market (Schaltegger, Lüdeke-Freund
and Hansen, 2016). These strategies will be enabling the company in addressing the opportunities in the new market and the
competitors that are present in the new market.
The above analysis is showing that the environmental, financial and the industry analysis reflecting that the merger and
acquisition strategy is most suitable for helping Tesco in assessing present threats and the weaknesses from the competition, price
increase and the low margins in the retail industry for the purpose of maintaining the competitive edge in the market.
20
by acquiring its competitive company so
that customers of that company will
become the customers of Tesco. This also
results in attaining economies of scale and
higher profits.
7.0 STRATEGY EVALUATION
7.1 Suitability
It relates with the analysis of the proposed strategies which addresses the important threats and the opportunities that it will be
facing regarding the strategy adopted. Market penetration and the vertical diversification will be considered as the most suitable
strategies for an enterprise in order to gain higher sales and in capturing the major share of the market (Schaltegger, Lüdeke-Freund
and Hansen, 2016). These strategies will be enabling the company in addressing the opportunities in the new market and the
competitors that are present in the new market.
The above analysis is showing that the environmental, financial and the industry analysis reflecting that the merger and
acquisition strategy is most suitable for helping Tesco in assessing present threats and the weaknesses from the competition, price
increase and the low margins in the retail industry for the purpose of maintaining the competitive edge in the market.
20
7.2 Acceptability
It states that the outcome of the expected performance in relation to the proposed strategy is meeting shareholders expectations
through return, risk and reaction of the stakeholders. Both the strategies will be adopted by Tesco must be acceptable to its
shareholders specifically the fund providers by overlooking into the break-even analysis. The cost that will be incurred in executing
these strategies must be lower than the benefits that will be gained by it. It is been identified that market penetration strategy involves
low risk as compared to vertical diversification so it must be manageable accordingly.
7.3 Feasibility
It relates to the philosophy that whether the proposed strategy is been suited in the practice in terms that whether the firm is
having the capability in delivering the strategy. Both the strategies must be feasible which is to be executed by Tesco in consideration
with its current capabilities and the operations.
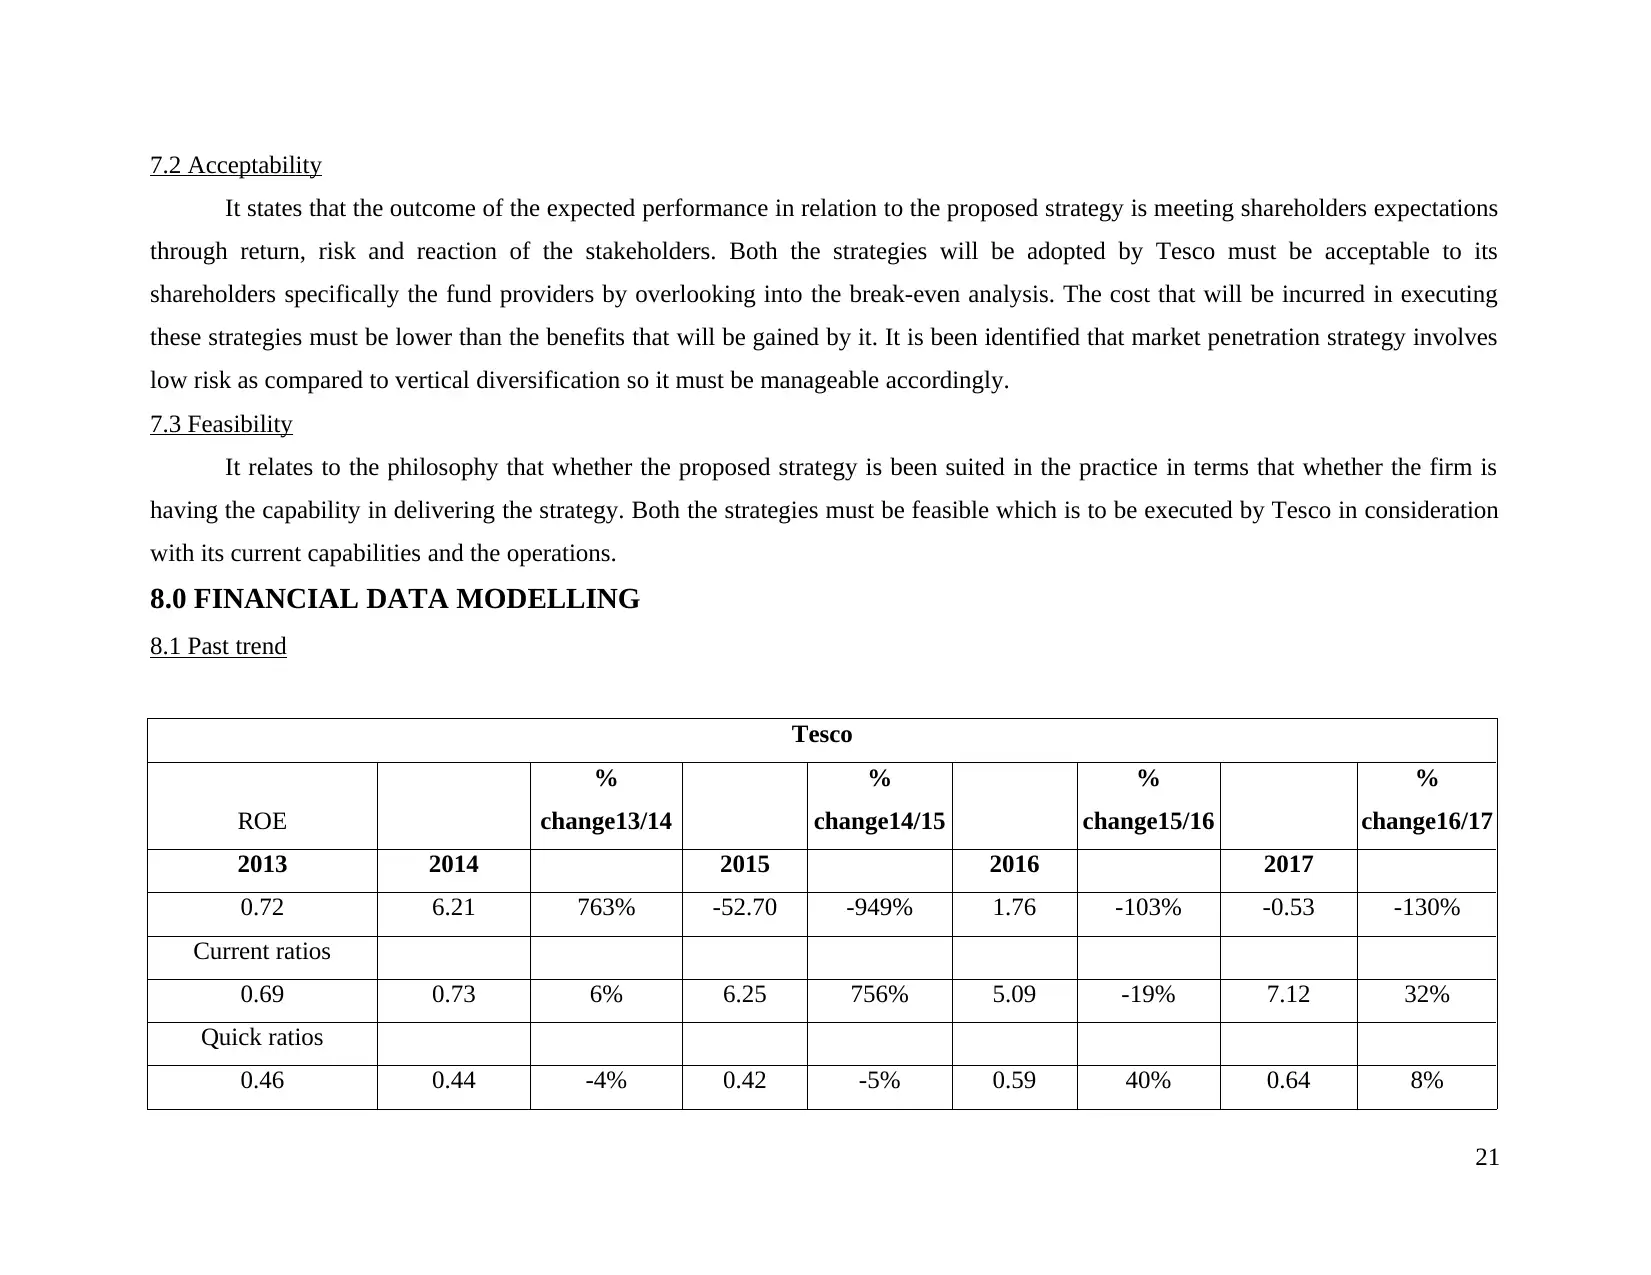
8.0 FINANCIAL DATA MODELLING
8.1 Past trend
Tesco
ROE
%
change13/14
%
change14/15
%
change15/16
%
change16/17
2013 2014 2015 2016 2017
0.72 6.21 763% -52.70 -949% 1.76 -103% -0.53 -130%
Current ratios
0.69 0.73 6% 6.25 756% 5.09 -19% 7.12 32%
Quick ratios
0.46 0.44 -4% 0.42 -5% 0.59 40% 0.64 8%
21
It states that the outcome of the expected performance in relation to the proposed strategy is meeting shareholders expectations
through return, risk and reaction of the stakeholders. Both the strategies will be adopted by Tesco must be acceptable to its
shareholders specifically the fund providers by overlooking into the break-even analysis. The cost that will be incurred in executing
these strategies must be lower than the benefits that will be gained by it. It is been identified that market penetration strategy involves
low risk as compared to vertical diversification so it must be manageable accordingly.
7.3 Feasibility
It relates to the philosophy that whether the proposed strategy is been suited in the practice in terms that whether the firm is
having the capability in delivering the strategy. Both the strategies must be feasible which is to be executed by Tesco in consideration
with its current capabilities and the operations.
8.0 FINANCIAL DATA MODELLING
8.1 Past trend
Tesco
ROE
%
change13/14
%
change14/15
%
change15/16
%
change16/17
2013 2014 2015 2016 2017
0.72 6.21 763% -52.70 -949% 1.76 -103% -0.53 -130%
Current ratios
0.69 0.73 6% 6.25 756% 5.09 -19% 7.12 32%
Quick ratios
0.46 0.44 -4% 0.42 -5% 0.59 40% 0.64 8%
21
GPM
6.30 6.30 0% -3.40 -154% 5.20 -253% 5.20 0%
NPM
0.19 1.53 705% -9.22 -703% 0.25 -103% -0.07 -128%
Basic EPS
0.01 0.60 5900% -2.12 -453% 0.05 -102% -0.01 -120%
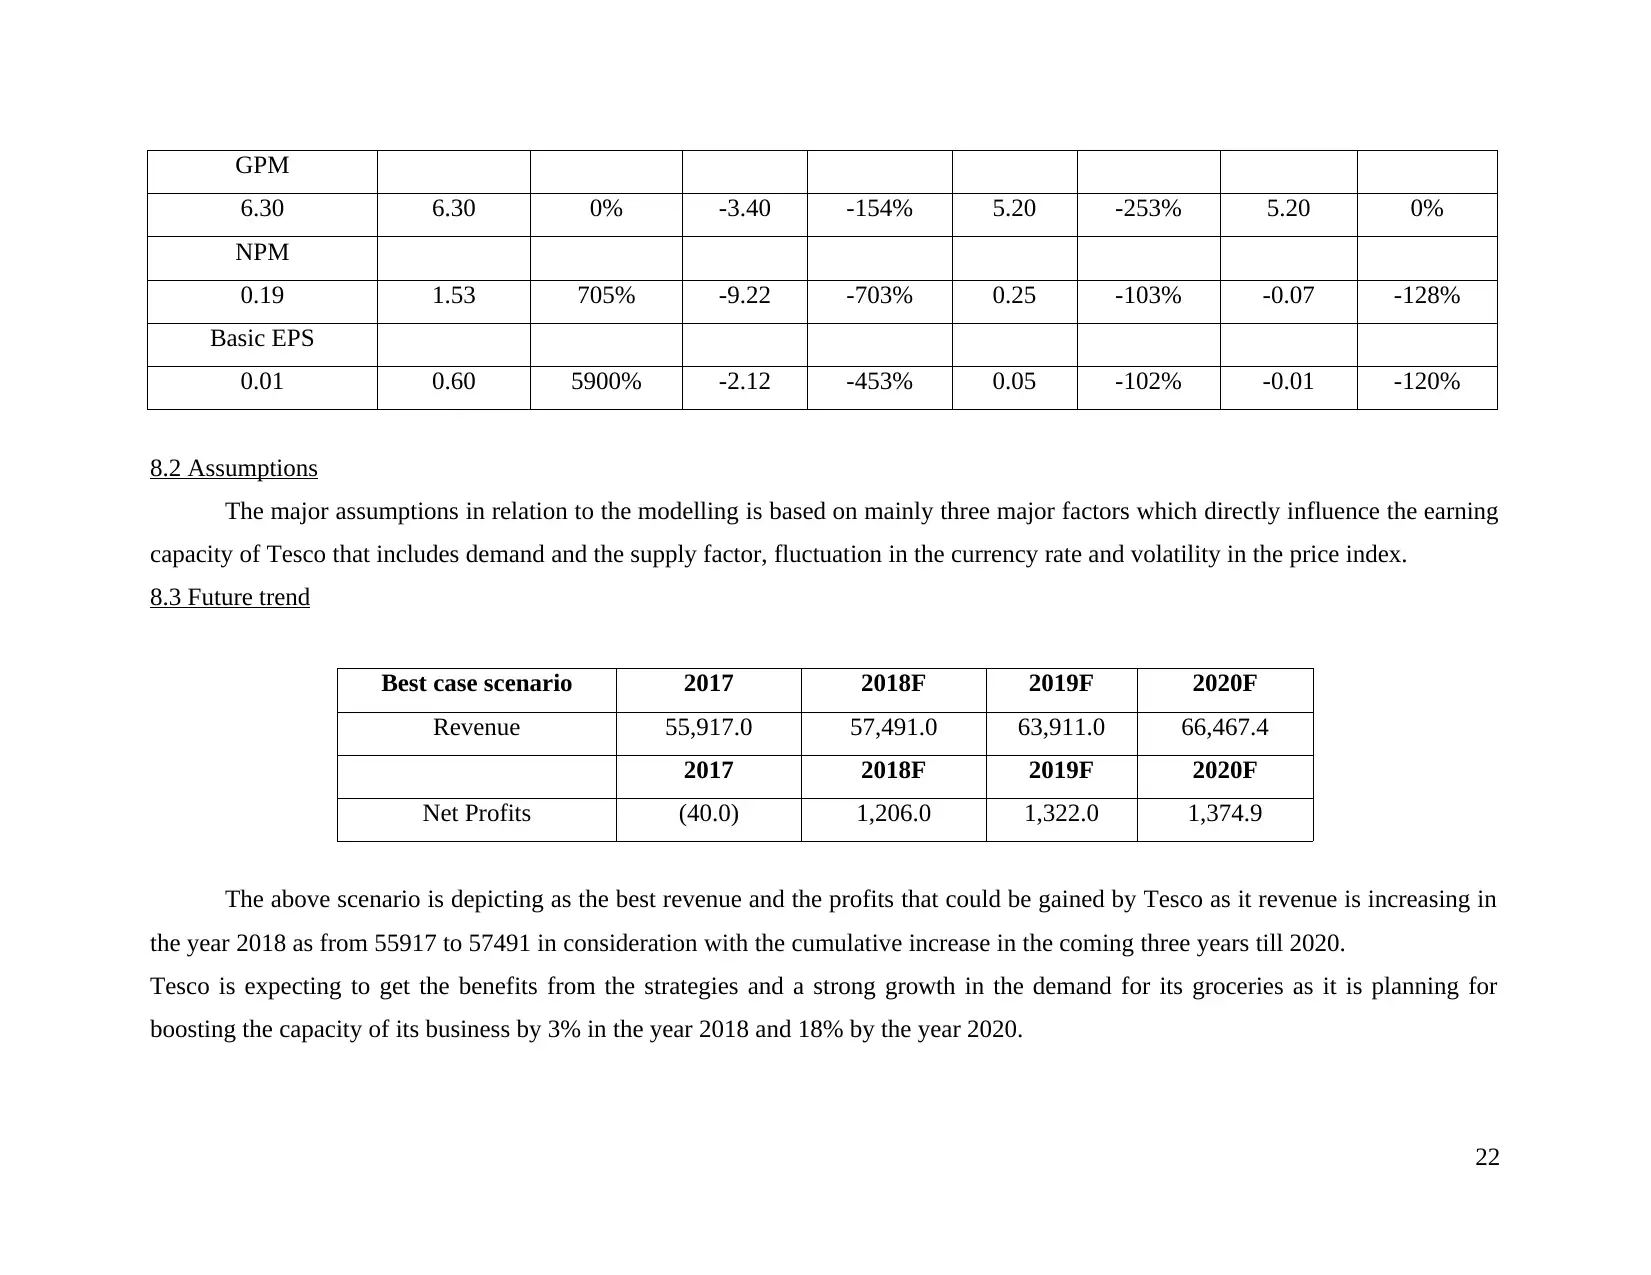
8.2 Assumptions
The major assumptions in relation to the modelling is based on mainly three major factors which directly influence the earning
capacity of Tesco that includes demand and the supply factor, fluctuation in the currency rate and volatility in the price index.
8.3 Future trend
Best case scenario 2017 2018F 2019F 2020F
Revenue 55,917.0 57,491.0 63,911.0 66,467.4
2017 2018F 2019F 2020F
Net Profits (40.0) 1,206.0 1,322.0 1,374.9
The above scenario is depicting as the best revenue and the profits that could be gained by Tesco as it revenue is increasing in
the year 2018 as from 55917 to 57491 in consideration with the cumulative increase in the coming three years till 2020.
Tesco is expecting to get the benefits from the strategies and a strong growth in the demand for its groceries as it is planning for
boosting the capacity of its business by 3% in the year 2018 and 18% by the year 2020.
22
6.30 6.30 0% -3.40 -154% 5.20 -253% 5.20 0%
NPM
0.19 1.53 705% -9.22 -703% 0.25 -103% -0.07 -128%
Basic EPS
0.01 0.60 5900% -2.12 -453% 0.05 -102% -0.01 -120%
8.2 Assumptions
The major assumptions in relation to the modelling is based on mainly three major factors which directly influence the earning
capacity of Tesco that includes demand and the supply factor, fluctuation in the currency rate and volatility in the price index.
8.3 Future trend
Best case scenario 2017 2018F 2019F 2020F
Revenue 55,917.0 57,491.0 63,911.0 66,467.4
2017 2018F 2019F 2020F
Net Profits (40.0) 1,206.0 1,322.0 1,374.9
The above scenario is depicting as the best revenue and the profits that could be gained by Tesco as it revenue is increasing in
the year 2018 as from 55917 to 57491 in consideration with the cumulative increase in the coming three years till 2020.
Tesco is expecting to get the benefits from the strategies and a strong growth in the demand for its groceries as it is planning for
boosting the capacity of its business by 3% in the year 2018 and 18% by the year 2020.
22
Paraphrase This Document
Need a fresh take? Get an instant paraphrase of this document with our AI Paraphraser
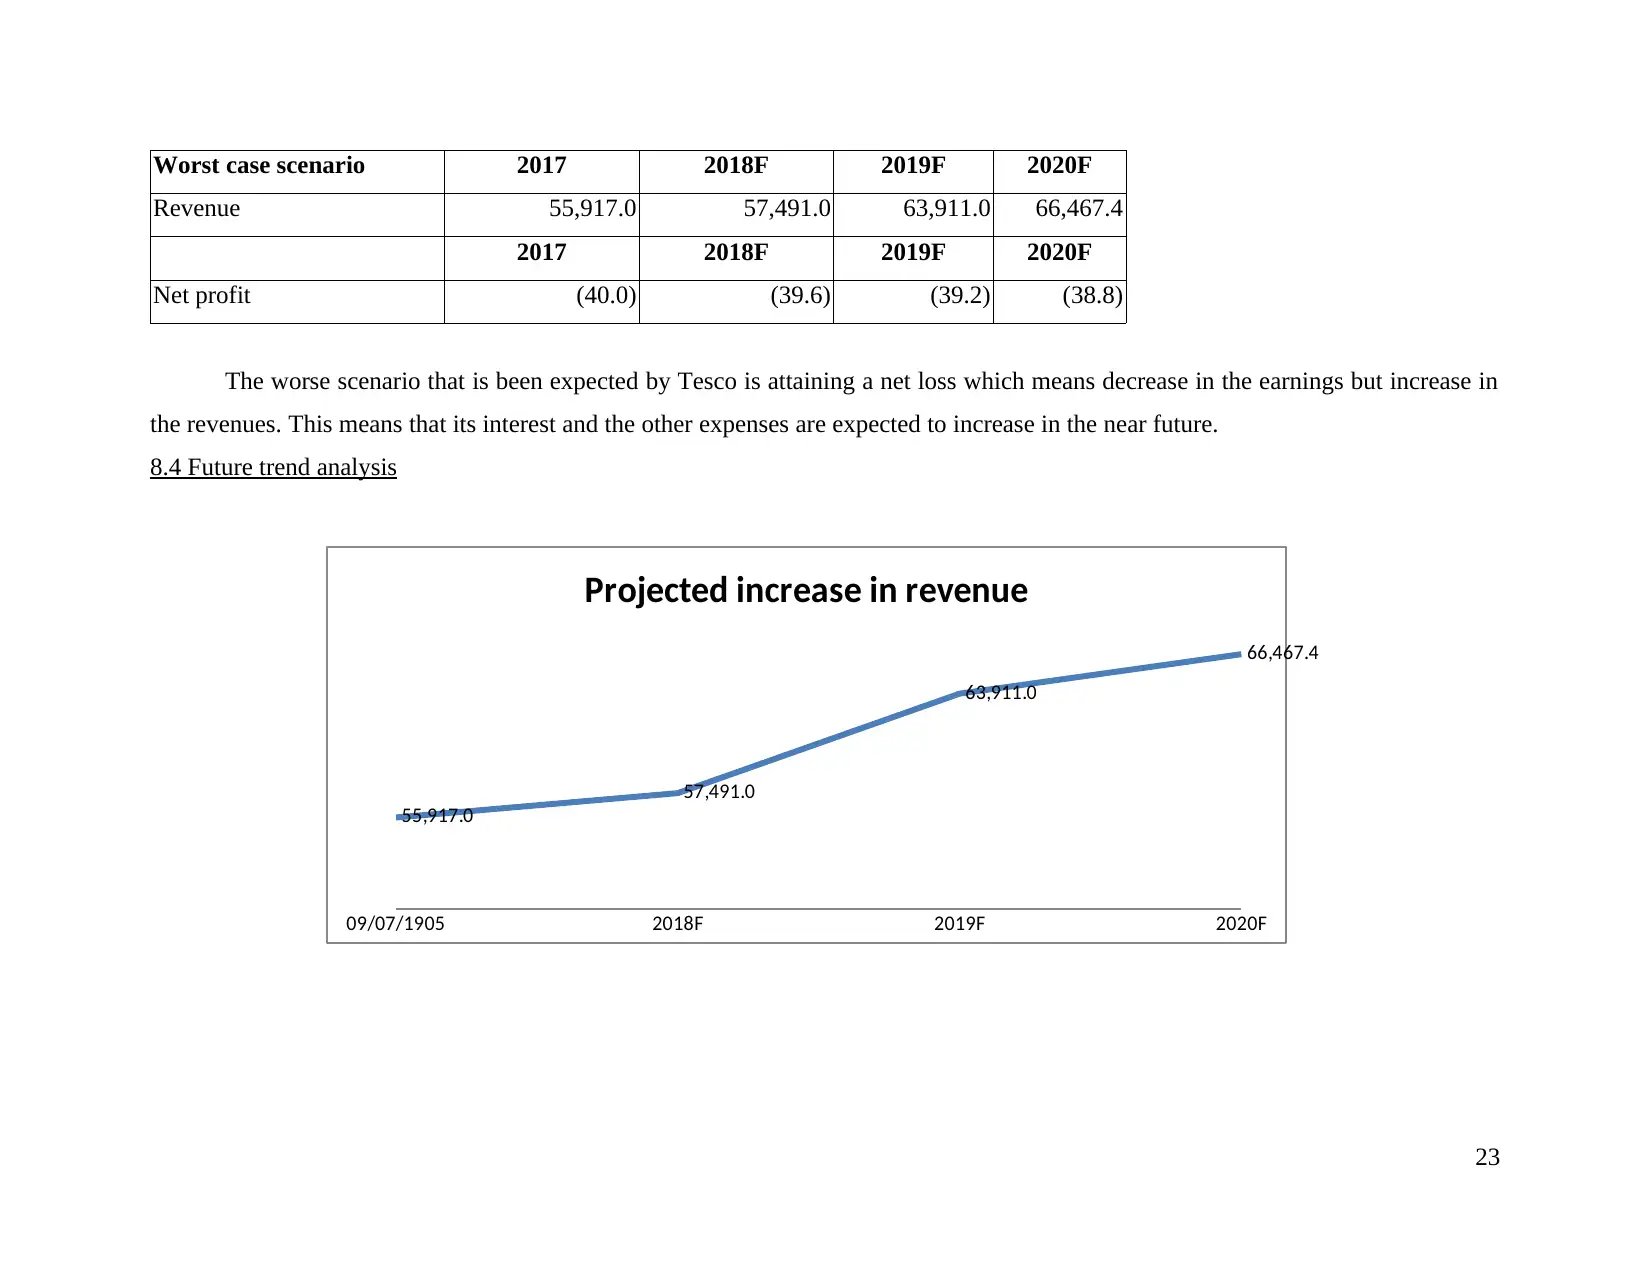
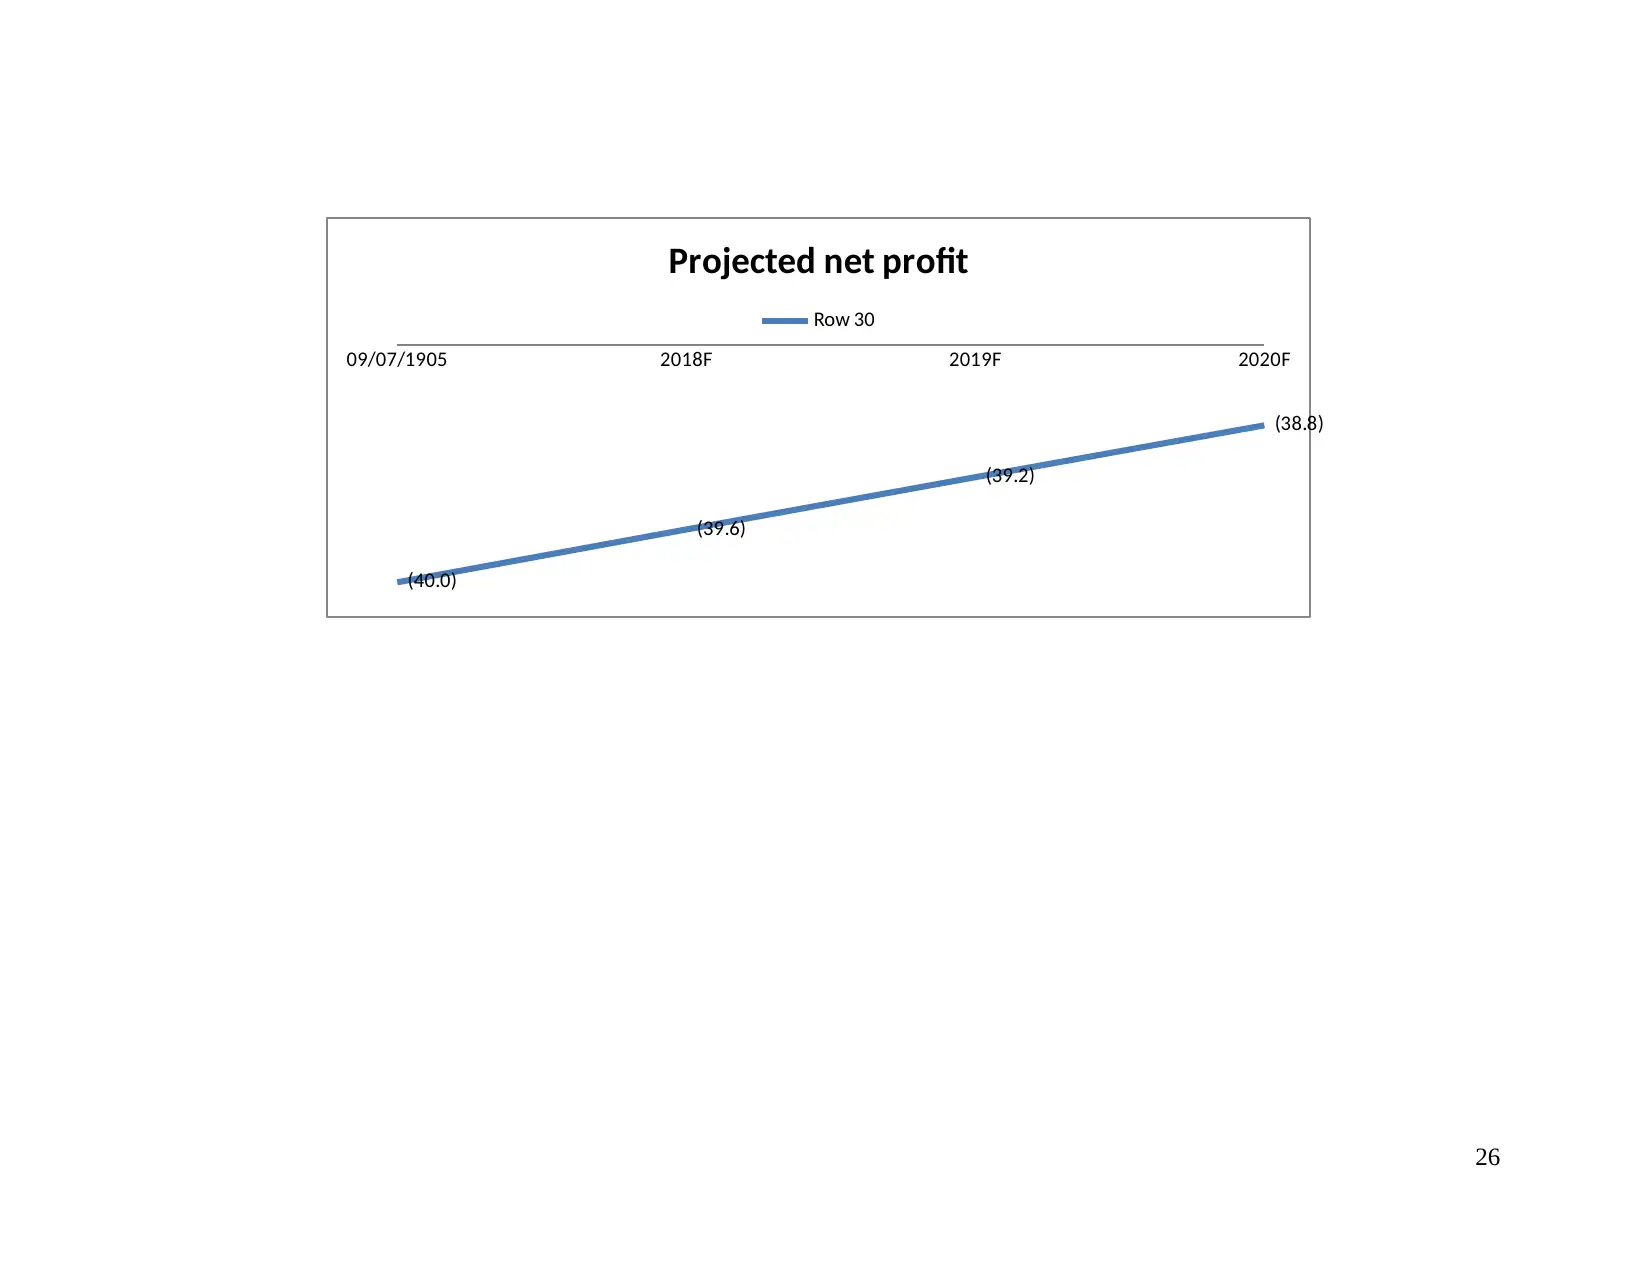
Worst case scenario 2017 2018F 2019F 2020F
Revenue 55,917.0 57,491.0 63,911.0 66,467.4
2017 2018F 2019F 2020F
Net profit (40.0) (39.6) (39.2) (38.8)
The worse scenario that is been expected by Tesco is attaining a net loss which means decrease in the earnings but increase in
the revenues. This means that its interest and the other expenses are expected to increase in the near future.
8.4 Future trend analysis
23
09/07/1905 2018F 2019F 2020F
55,917.0
57,491.0
63,911.0
66,467.4
Projected increase in revenue
24
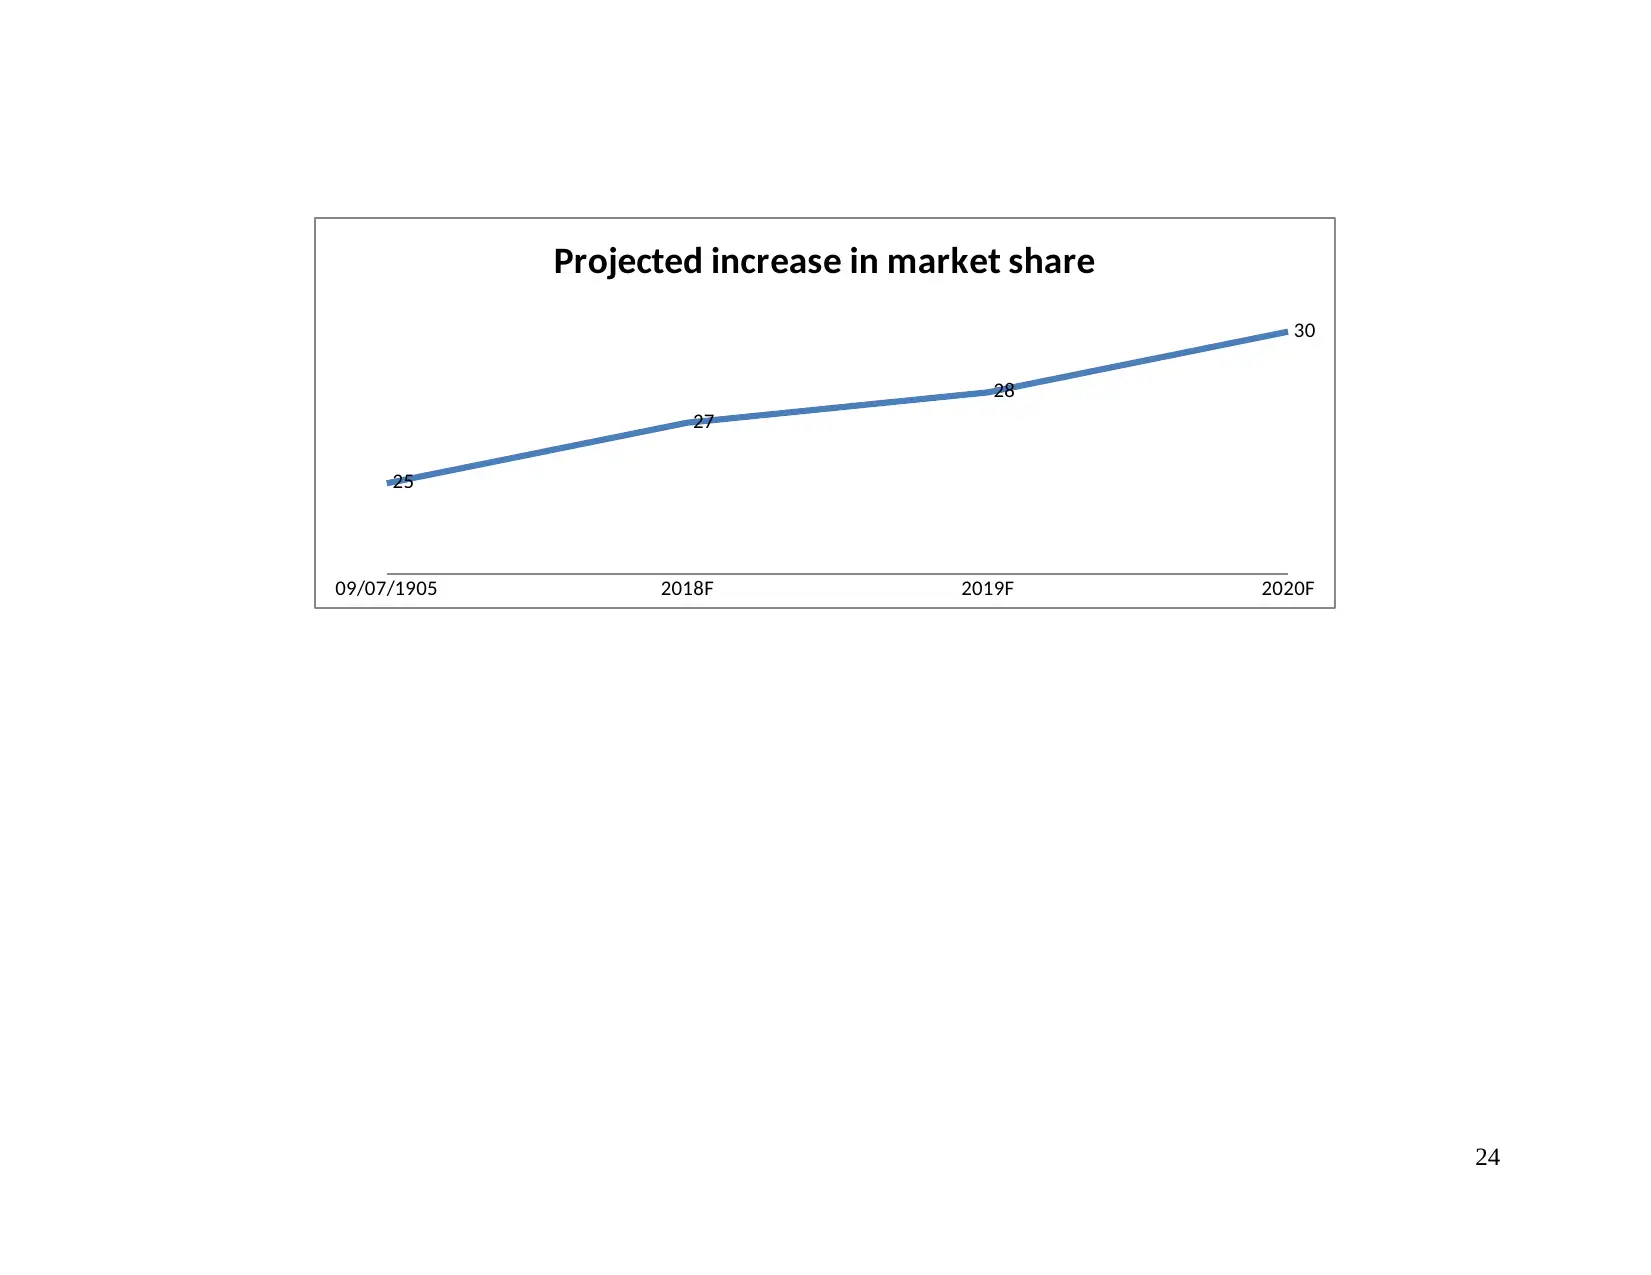
09/07/1905 2018F 2019F 2020F
25
27
28
30
Projected increase in market share
09/07/1905 2018F 2019F 2020F
25
27
28
30
Projected increase in market share
25
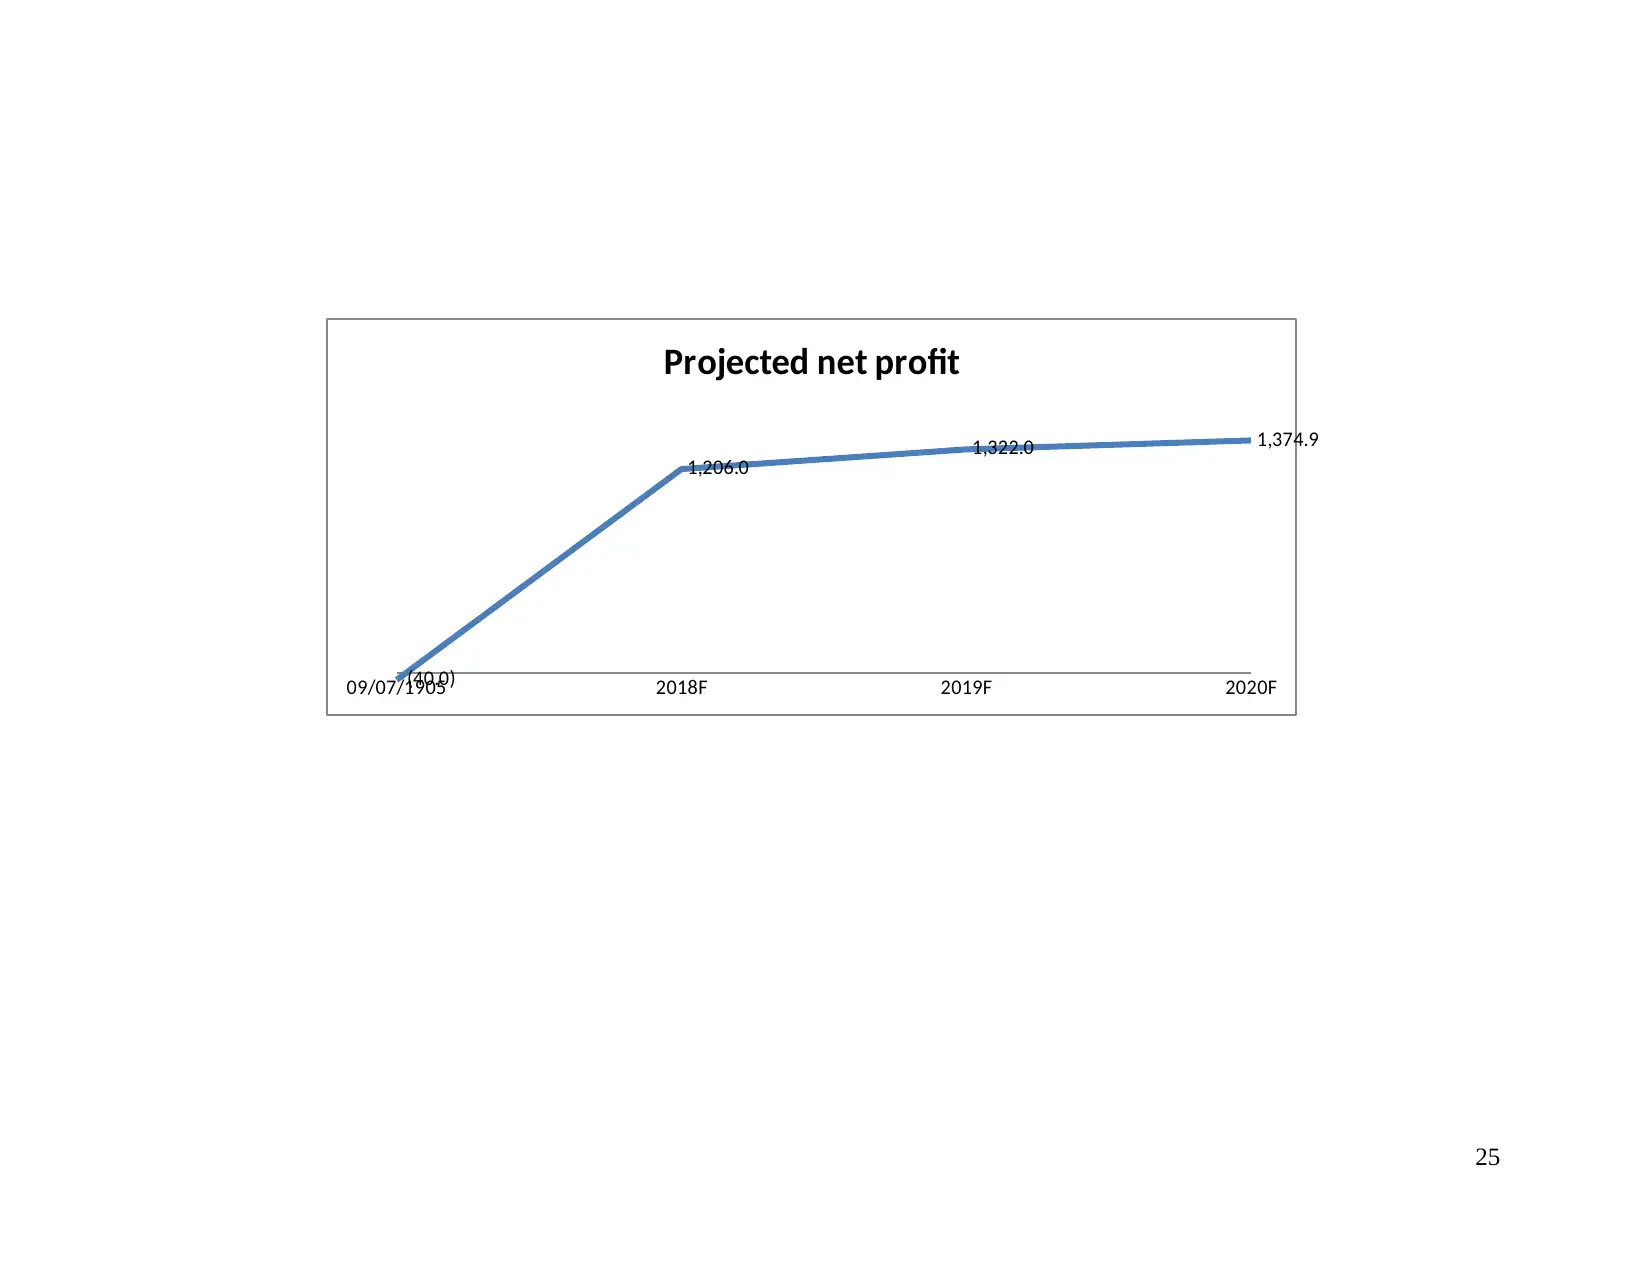
09/07/1905 2018F 2019F 2020F(40.0)
1,206.0 1,322.0 1,374.9
Projected net profit
09/07/1905 2018F 2019F 2020F(40.0)
1,206.0 1,322.0 1,374.9
Projected net profit
Secure Best Marks with AI Grader
Need help grading? Try our AI Grader for instant feedback on your assignments.
26
09/07/1905 2018F 2019F 2020F
(40.0)
(39.6)
(39.2)
(38.8)
Projected net profit
Row 30
09/07/1905 2018F 2019F 2020F
(40.0)
(39.6)
(39.2)
(38.8)
Projected net profit
Row 30
REFERENCES
Books and Journals
Albort-Morant, G. and Ribeiro-Soriano, D., 2016. A bibliometric analysis of international impact of business incubators. Journal of
Business Research. 69(5). pp.1775-1779.
Basole, R.C. and et.al., 2016. Visual decision support for business ecosystem analysis. Expert Systems with Applications. 65. pp.271-
282.
Burger, S. P. and Luke, M., 2017. Business models for distributed energy resources: A review and empirical analysis. Energy
Policy. 109. pp.230-248.
Leppäaho, T., Plakoyiannaki, E. and Dimitratos, P., 2016. The case study in family business: An analysis of current research practices
and recommendations. Family Business Review. 29(2). pp.159-173.
Melloni, G., Stacchezzini, R. and Lai, A., 2016. The tone of business model disclosure: an impression management analysis of the
integrated reports. Journal of Management & Governance. 20(2). pp.295-320.
Schaltegger, S., Lüdeke-Freund, F. and Hansen, E. G., 2016. Business models for sustainability: A co-evolutionary analysis of
sustainable entrepreneurship, innovation, and transformation. Organization & Environment. 29(3). pp.264-289.
Snelson-Powell, A., Grosvold, J. and Millington, A., 2016. Business school legitimacy and the challenge of sustainability: A fuzzy set
analysis of institutional decoupling. Academy of Management Learning & Education. 15(4). pp.703-723.
Online
Potential Limitations of the PEST Analysis and How to Address Them. 2018. [Online]. Available through
https://pestleanalysis.com/limitations-of-the-pest-analysis/>.
27
UK inflation falls to lowest value in two years. 2017. [Online]. Available through
<https://www.theguardian.com/business/2019/jan/16/uk-inflation-falls-to-lowest-level-in-two-years>.
28
<https://www.theguardian.com/business/2019/jan/16/uk-inflation-falls-to-lowest-level-in-two-years>.
28
Paraphrase This Document
Need a fresh take? Get an instant paraphrase of this document with our AI Paraphraser
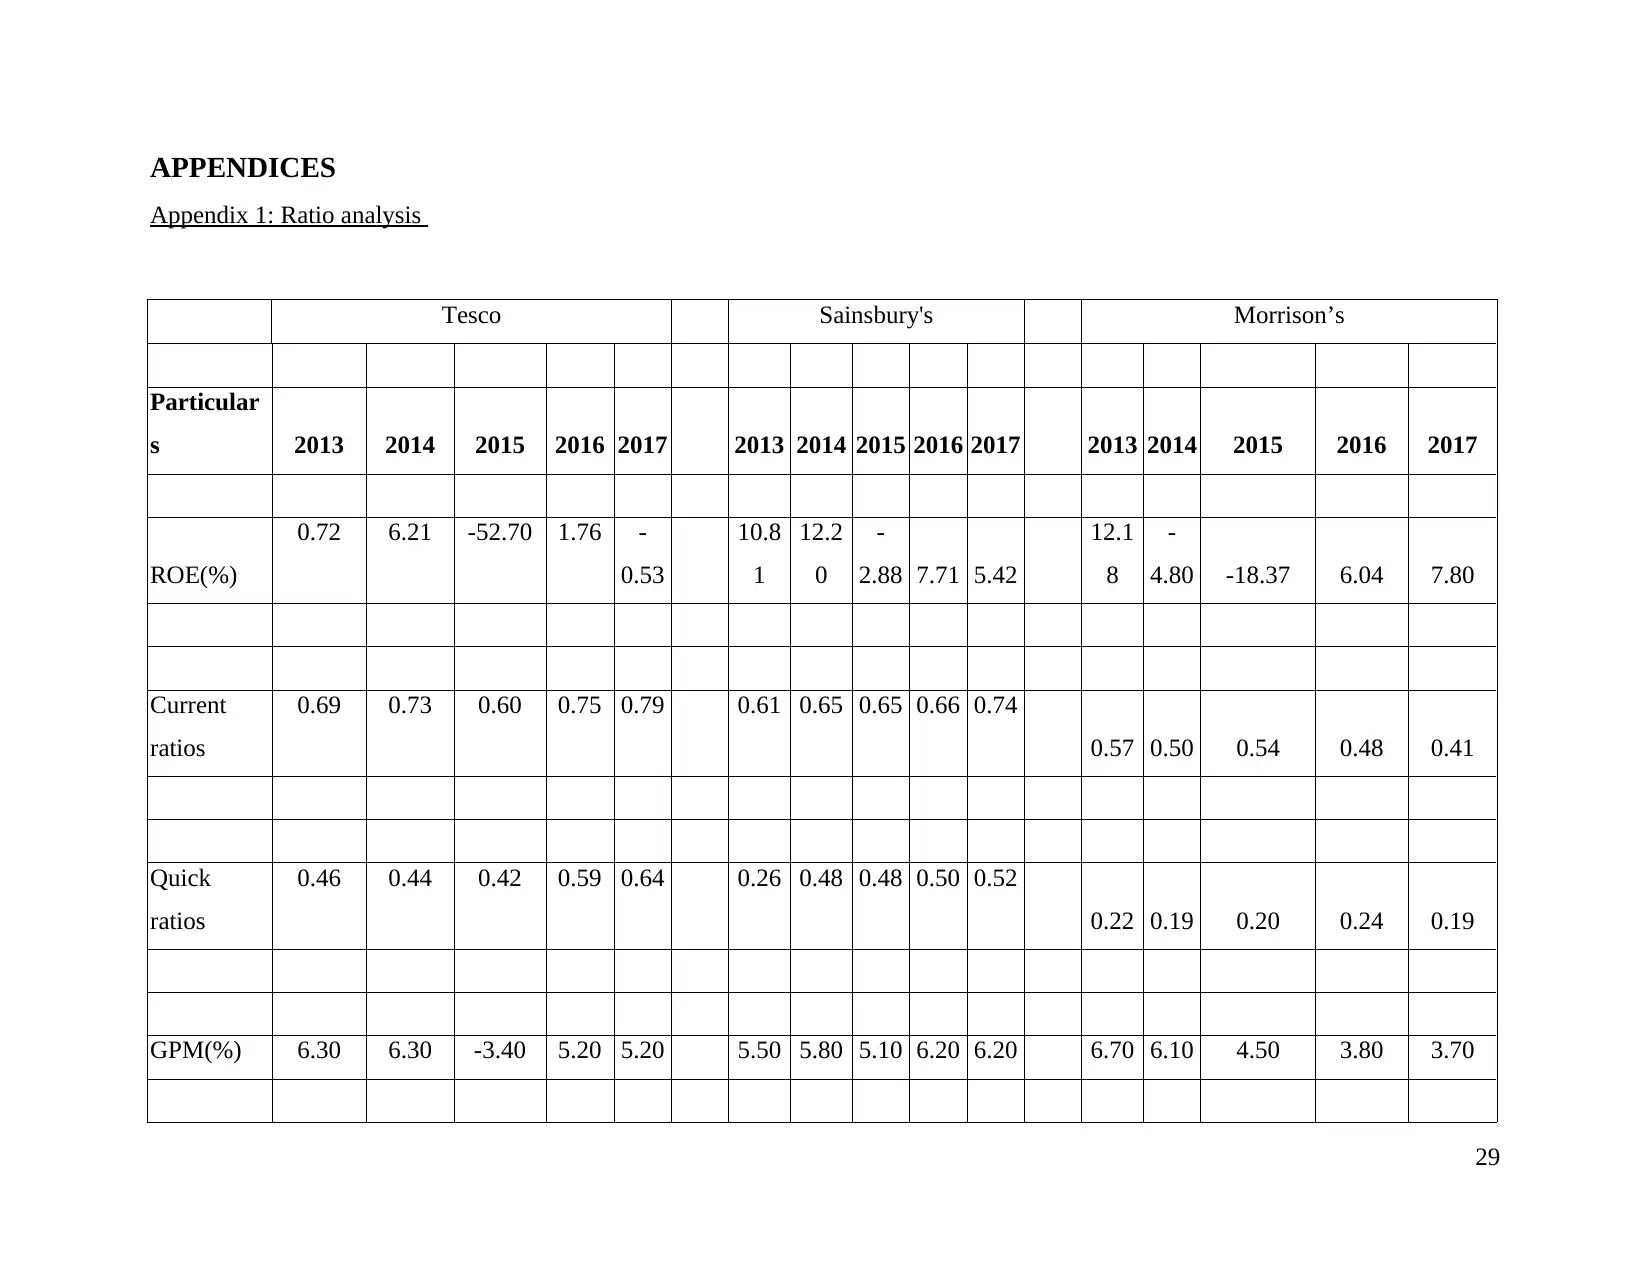
APPENDICES
Appendix 1: Ratio analysis
Tesco Sainsbury's Morrison’s
Particular
s 2013 2014 2015 2016 2017 2013 2014 2015 2016 2017 2013 2014 2015 2016 2017
ROE(%)
0.72 6.21 -52.70 1.76 -
0.53
10.8
1
12.2
0
-
2.88 7.71 5.42
12.1
8
-
4.80 -18.37 6.04 7.80
Current
ratios
0.69 0.73 0.60 0.75 0.79 0.61 0.65 0.65 0.66 0.74
0.57 0.50 0.54 0.48 0.41
Quick
ratios
0.46 0.44 0.42 0.59 0.64 0.26 0.48 0.48 0.50 0.52
0.22 0.19 0.20 0.24 0.19
GPM(%) 6.30 6.30 -3.40 5.20 5.20 5.50 5.80 5.10 6.20 6.20 6.70 6.10 4.50 3.80 3.70
29
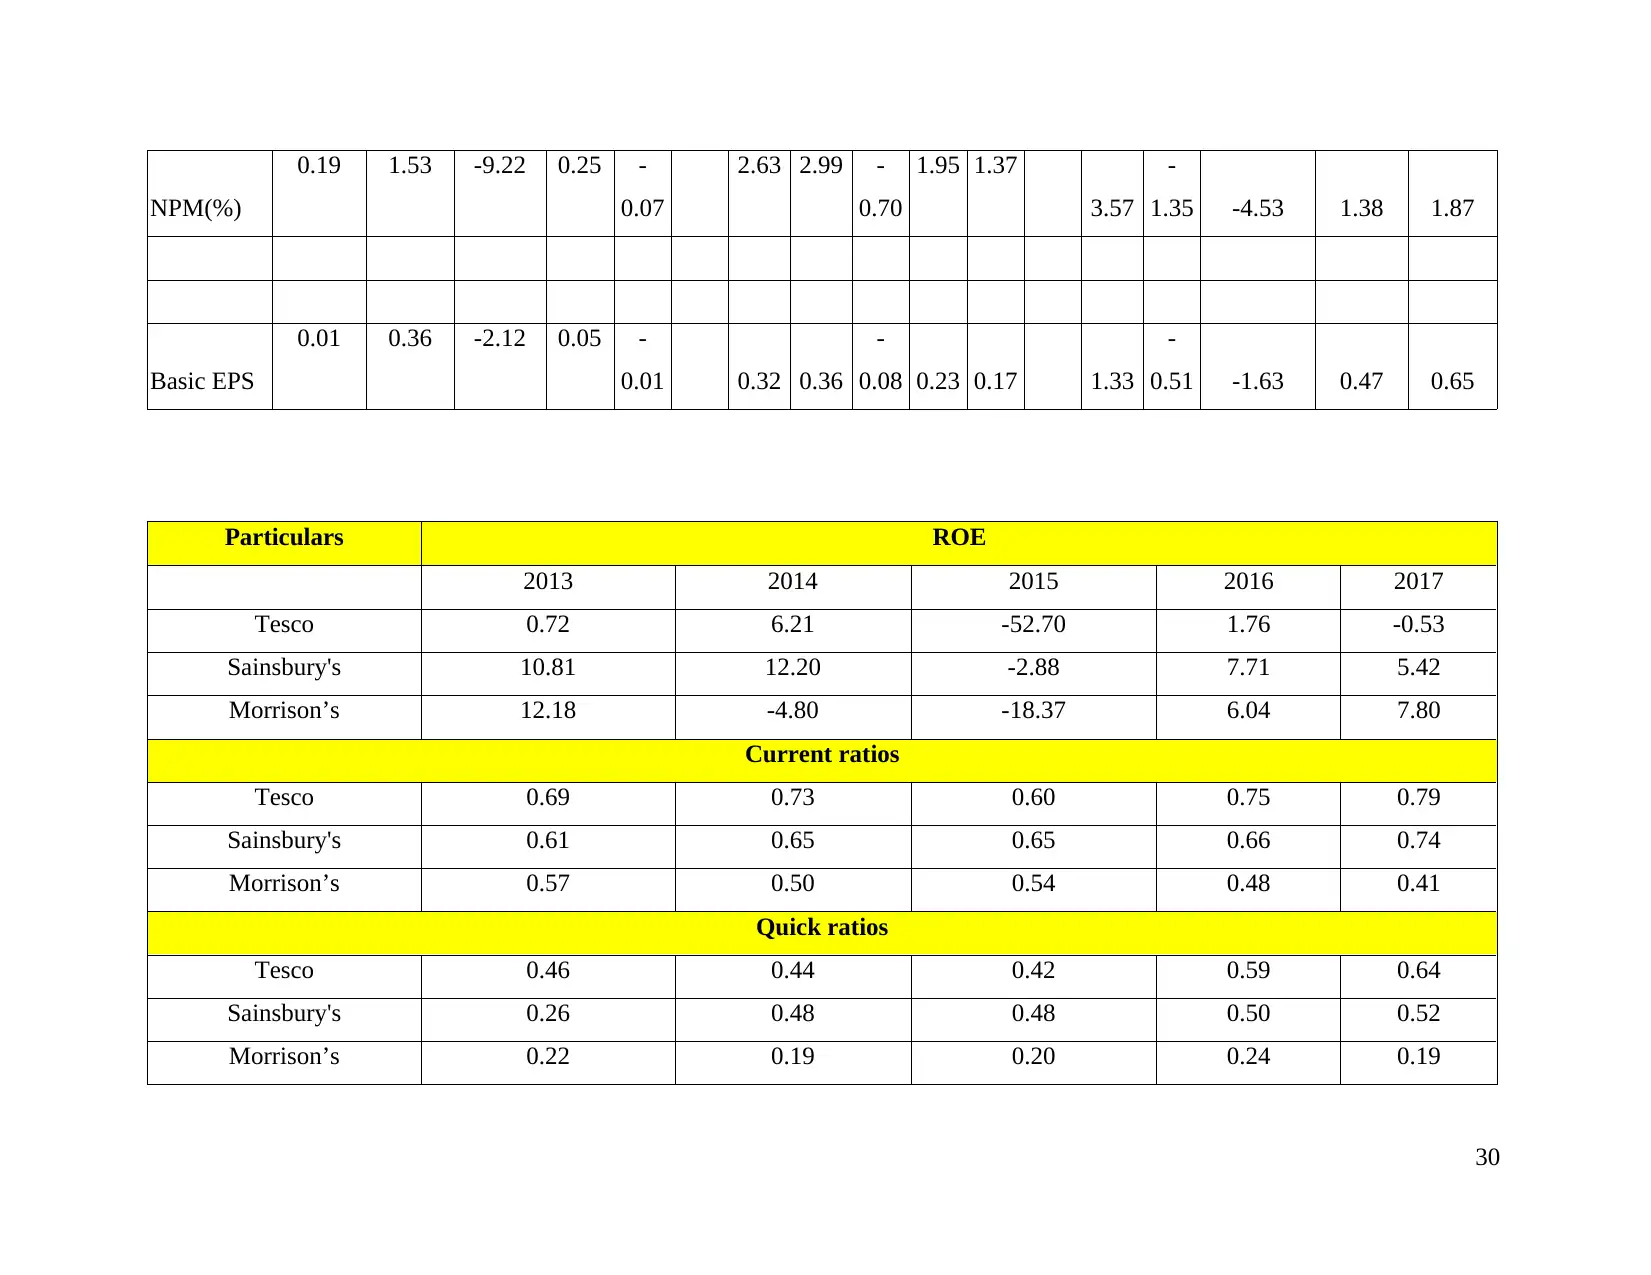
NPM(%)
0.19 1.53 -9.22 0.25 -
0.07
2.63 2.99 -
0.70
1.95 1.37
3.57
-
1.35 -4.53 1.38 1.87
Basic EPS
0.01 0.36 -2.12 0.05 -
0.01 0.32 0.36
-
0.08 0.23 0.17 1.33
-
0.51 -1.63 0.47 0.65
Particulars ROE
2013 2014 2015 2016 2017
Tesco 0.72 6.21 -52.70 1.76 -0.53
Sainsbury's 10.81 12.20 -2.88 7.71 5.42
Morrison’s 12.18 -4.80 -18.37 6.04 7.80
Current ratios
Tesco 0.69 0.73 0.60 0.75 0.79
Sainsbury's 0.61 0.65 0.65 0.66 0.74
Morrison’s 0.57 0.50 0.54 0.48 0.41
Quick ratios
Tesco 0.46 0.44 0.42 0.59 0.64
Sainsbury's 0.26 0.48 0.48 0.50 0.52
Morrison’s 0.22 0.19 0.20 0.24 0.19
30
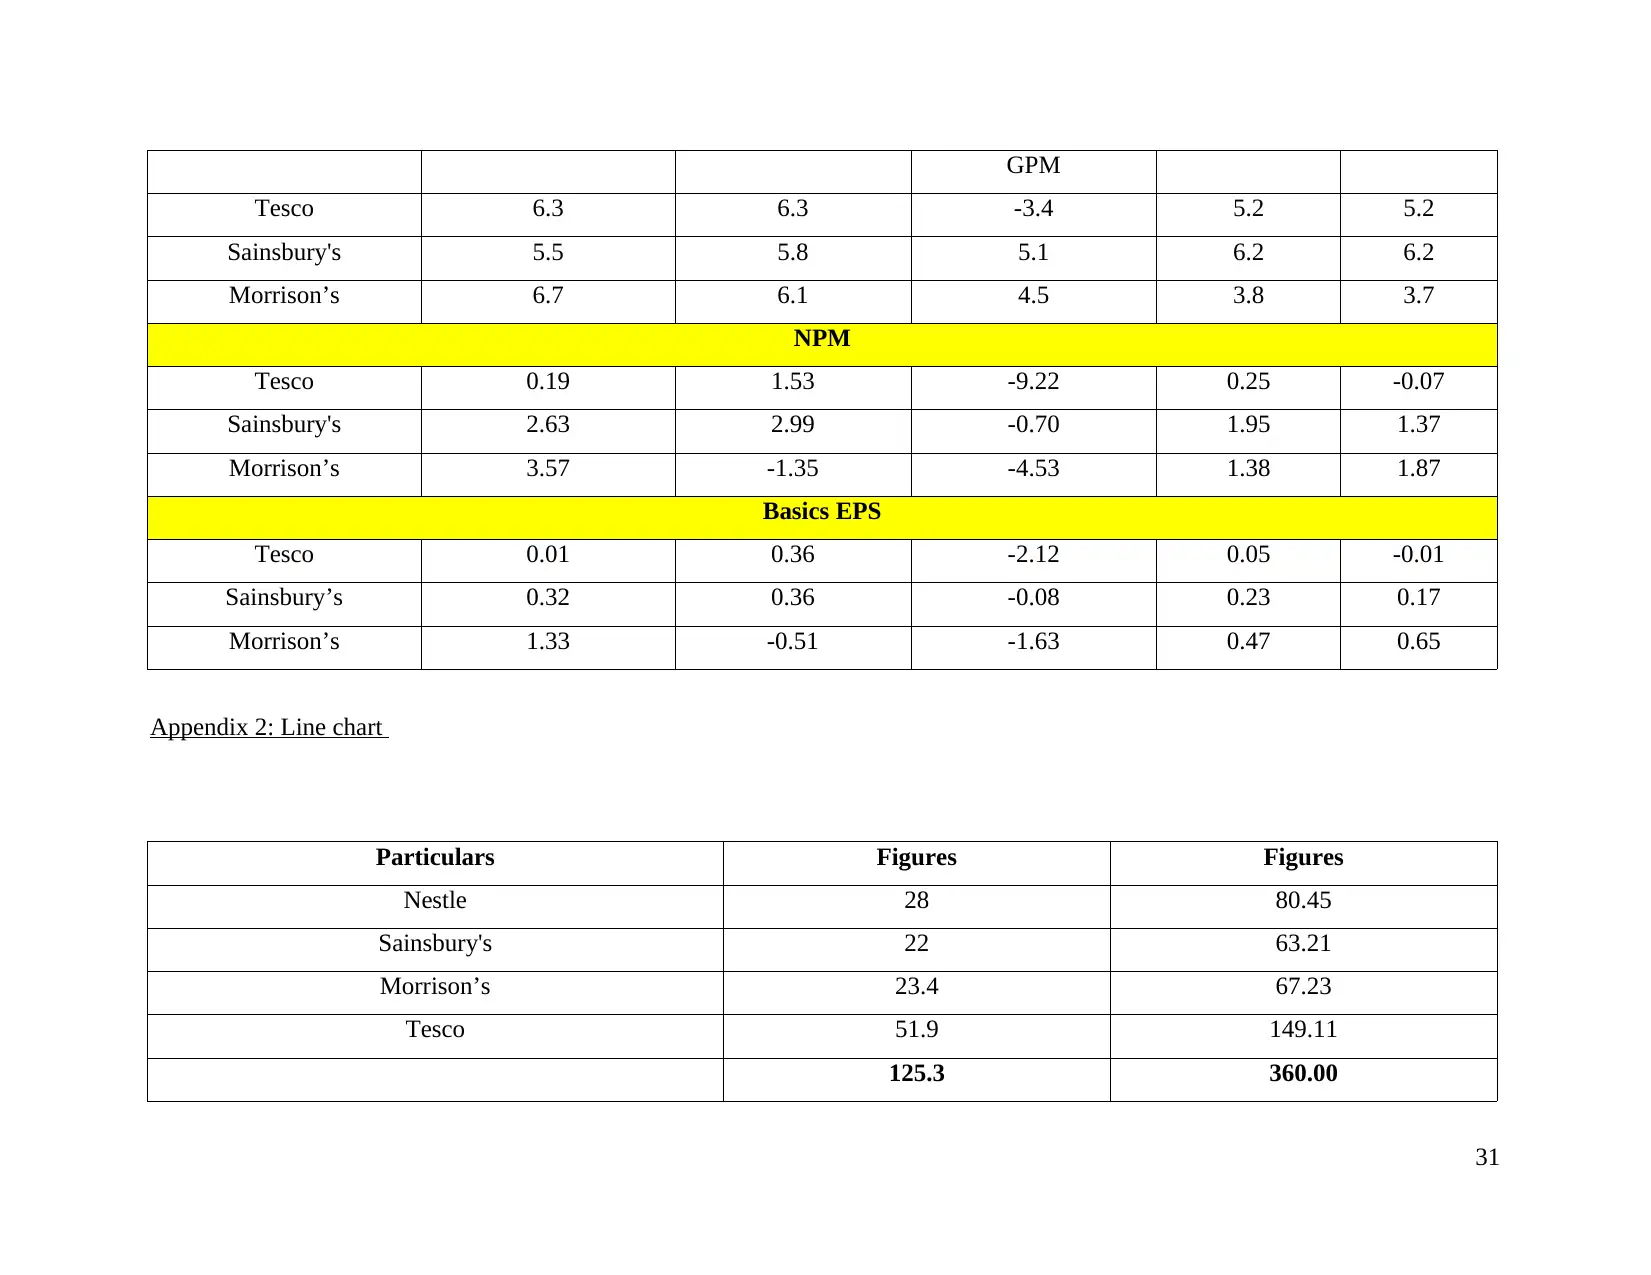
GPM
Tesco 6.3 6.3 -3.4 5.2 5.2
Sainsbury's 5.5 5.8 5.1 6.2 6.2
Morrison’s 6.7 6.1 4.5 3.8 3.7
NPM
Tesco 0.19 1.53 -9.22 0.25 -0.07
Sainsbury's 2.63 2.99 -0.70 1.95 1.37
Morrison’s 3.57 -1.35 -4.53 1.38 1.87
Basics EPS
Tesco 0.01 0.36 -2.12 0.05 -0.01
Sainsbury’s 0.32 0.36 -0.08 0.23 0.17
Morrison’s 1.33 -0.51 -1.63 0.47 0.65
Appendix 2: Line chart
Particulars Figures Figures
Nestle 28 80.45
Sainsbury's 22 63.21
Morrison’s 23.4 67.23
Tesco 51.9 149.11
125.3 360.00
31
Secure Best Marks with AI Grader
Need help grading? Try our AI Grader for instant feedback on your assignments.
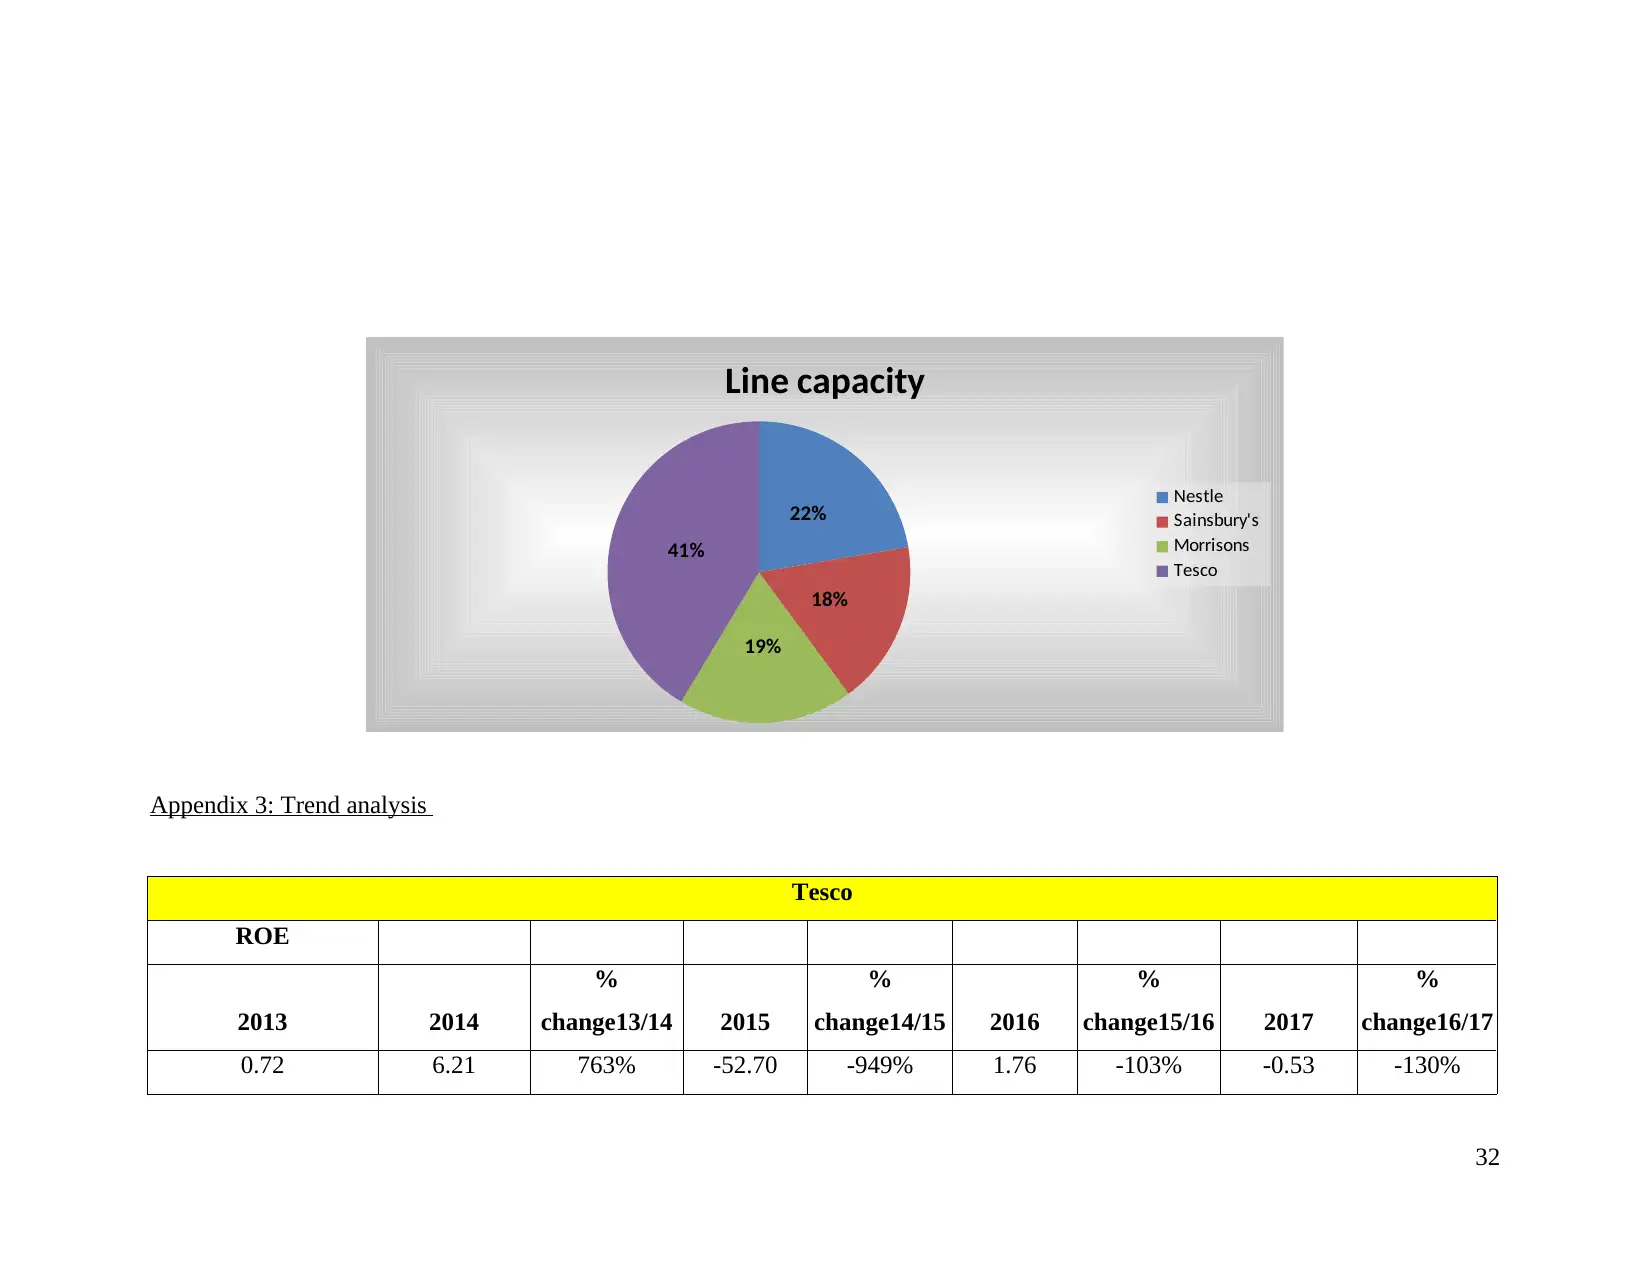
Appendix 3: Trend analysis
Tesco
ROE
2013 2014
%
change13/14 2015
%
change14/15 2016
%
change15/16 2017
%
change16/17
0.72 6.21 763% -52.70 -949% 1.76 -103% -0.53 -130%
32
22%
18%
19%
41%
Line capacity
Nestle
Sainsbury's
Morrisons
Tesco
Tesco
ROE
2013 2014
%
change13/14 2015
%
change14/15 2016
%
change15/16 2017
%
change16/17
0.72 6.21 763% -52.70 -949% 1.76 -103% -0.53 -130%
32
22%
18%
19%
41%
Line capacity
Nestle
Sainsbury's
Morrisons
Tesco
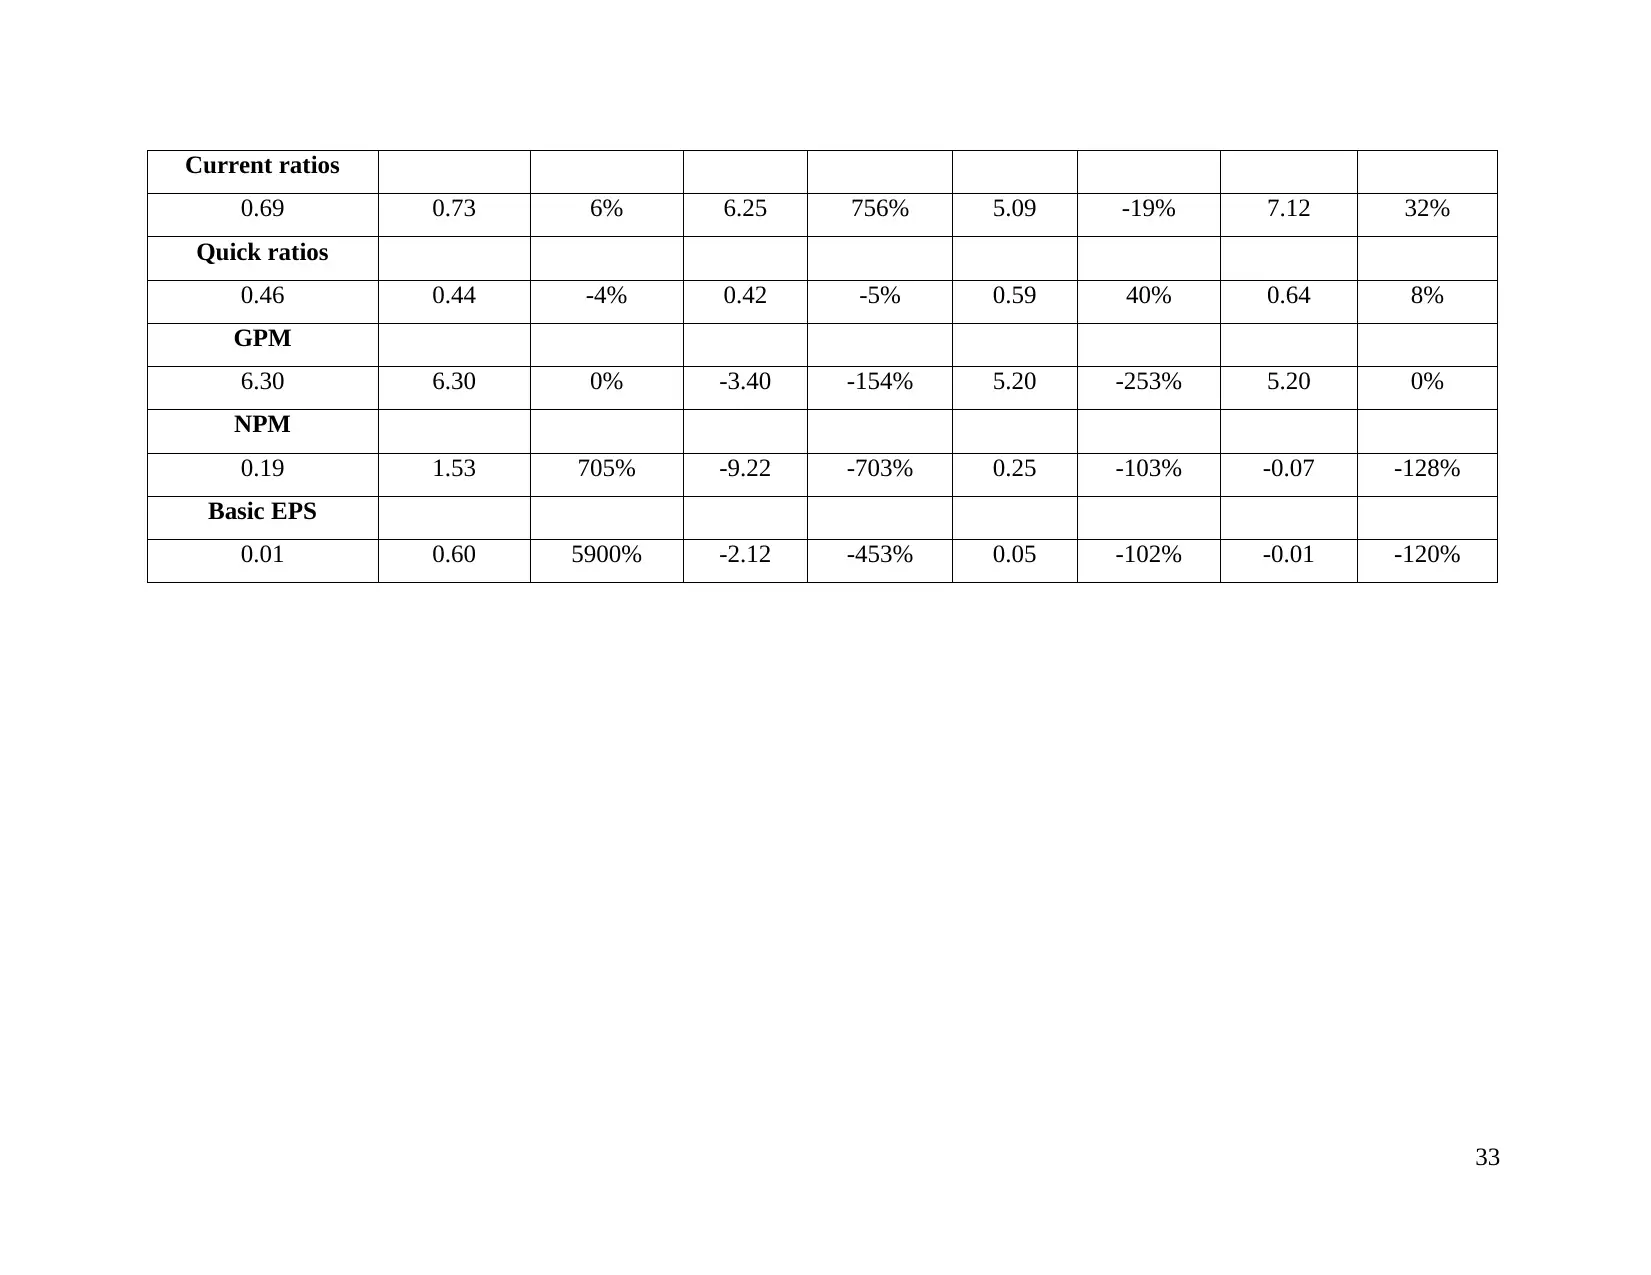
Current ratios
0.69 0.73 6% 6.25 756% 5.09 -19% 7.12 32%
Quick ratios
0.46 0.44 -4% 0.42 -5% 0.59 40% 0.64 8%
GPM
6.30 6.30 0% -3.40 -154% 5.20 -253% 5.20 0%
NPM
0.19 1.53 705% -9.22 -703% 0.25 -103% -0.07 -128%
Basic EPS
0.01 0.60 5900% -2.12 -453% 0.05 -102% -0.01 -120%
33
0.69 0.73 6% 6.25 756% 5.09 -19% 7.12 32%
Quick ratios
0.46 0.44 -4% 0.42 -5% 0.59 40% 0.64 8%
GPM
6.30 6.30 0% -3.40 -154% 5.20 -253% 5.20 0%
NPM
0.19 1.53 705% -9.22 -703% 0.25 -103% -0.07 -128%
Basic EPS
0.01 0.60 5900% -2.12 -453% 0.05 -102% -0.01 -120%
33
1 out of 36
Related Documents


Your All-in-One AI-Powered Toolkit for Academic Success.
+13062052269
info@desklib.com
Available 24*7 on WhatsApp / Email
![[object Object]](/_next/static/media/star-bottom.7253800d.svg)
Unlock your academic potential
© 2024 | Zucol Services PVT LTD | All rights reserved.